Improving INP and FID with production profiling
Improving INP and FID with production profiling
On March 12 Google began promoting INP (Interaction to Next Paint) into a Core Web Vital metric in an effort to push performance beyond page loads. This means your website or application’s SEO ranking may be impacted if users do not have smooth interactions on the site or app.
While this change is a net positive for users, finding the root cause of these reported slow interactions can be tricky for developers. In this blog post, we will look at a few different methods to identify the root cause of slow interactions, including comparing JavaScript self-profiling to other browser APIs.
What is an INP interaction?
For an interaction to be considered by INP, it needs to be either a pointer or keyboard event. A pointer event is a mouse click or a pointer down/pointer up event on devices where the tap occurs on a physical screen. A keyboard event is simpler and occurs when a user presses a key, e.g. typing into an input field will trigger a keypress event, plus its keydown and keyup events.
If the UI fails to respond in time to a pointer or keyboard event triggered on your website, it may be perceived as slowness by users and reported by INP.
💡 Note: While pointer and keyboard events are great starting points for addressing janky interactions, developers must also optimize other interactions like scrolling or window resizing for a truly performant experience. In other words, a good INP score doesn’t guarantee better perception by users if these interactions still drop frames regularly.
Diagnosing root cause issues from INP reports
Determining the root cause of a poor INP score can be difficult. Real user monitoring is one of the key ways to pinpoint why and where exactly your performance issue is occurring.
INP reports provide helpful attributes like eventTarget and eventType (which describe the CSS selector of the element that caused the INP event) that, at first glance, aid in working your way backward to diagnose the root problem.
However, this is not sufficient. While we know what happened (e.g. user clicking on a button) and when, we don’t know why it occurred — which is crucial to fixing the issue.
To figure out the “why”, most developers would first set up a local server, initiate the devtools profiler, and click on the problematic button causing INP. If lucky, they may notice a potential culprit; otherwise, they continue down a flawed path (with no way of knowing if what they find is actually what is happening to users in production). Some articles online even suggest artificially throttling the CPU, which is a great way to waste time on optimizing something that is not an issue.
Lab (sometimes referred to as local) data doesn’t guarantee what we observe is actually happening in production. Performance issues can be elusive because they surface as a combination of issues under specific conditions. For the front-end, there are often large differences between local code and the transpiled version served to your users. Your code might also be using runtime flags that cause the control flow to be entirely different from production.
The key is to set up real user monitoring (RUM) to collect INP reports from a production environment. RUM provides valuable data about when, where, and how often issues occur, which lets us prioritize the most impactful improvements and establish a baseline that we can use as a reference when we make improvements.
Let’s walk through a real-life scenario. Imagine receiving numerous INP reports for a click event on an element triggering a dropdown. Take a minute and list the possible causes of why the click event might cause INP.
In no particular order, here are some of the candidates I’d consider:
Dropdown is rendering a lot of options, causing a rendering bottleneck
Dropdown uses a positioning engine that causes layout thrashing when figuring out its position
There is an expensive side effect in our event handler that delays opening
The dropdown options are a consequence of an API response - we are suddenly rendering a lot more of them as the response had changed to include more options
Someone added a new analytics library that inserts synchronous calls in all of our event handlers
We have enabled a feature flag that renders a modified version of the dropdown
We use a 3rd party dropdown library that was recently upgraded and contained a regression
The user has installed a 3rd party extension that is causing slowdowns
Does this overlap with anything you listed or observed firsthand, let me know via Twitter.
With real user monitoring and our newly collected INP report, we can validate if the issue is severe enough where we want to fix it, but how do we do that with just the INP reported entry? We now have to deal with an attribution issue in which we know our app behaved poorly but don't know the root cause. Let’s see what other APIs and tools we can use to narrow down on the performance culprit.
Improving attribution with LoAF
Lucky for us, the developers behind Chrome recognized the attribution issue and have since worked on giving us LoAF. LoAF stands for long animation frames API, a concept building on the notion of long task performance entries to fix the attribution problem.
LoAF entries among other things feature a scripts attribute, which provide details about the script that lead to our performance issue as well as information like forcedStyleAndLayoutDuration. This is valuable and important information because browsers must efficiently update your screen as they execute code, meaning any delays in executing scripts or recomputing what to render on screen will impact the final frame rate. We’ve talked about a “dropdown” problem above, let us now take a look at an example of a common combobox pattern and see how LoAF enables us to narrow on the culprit.
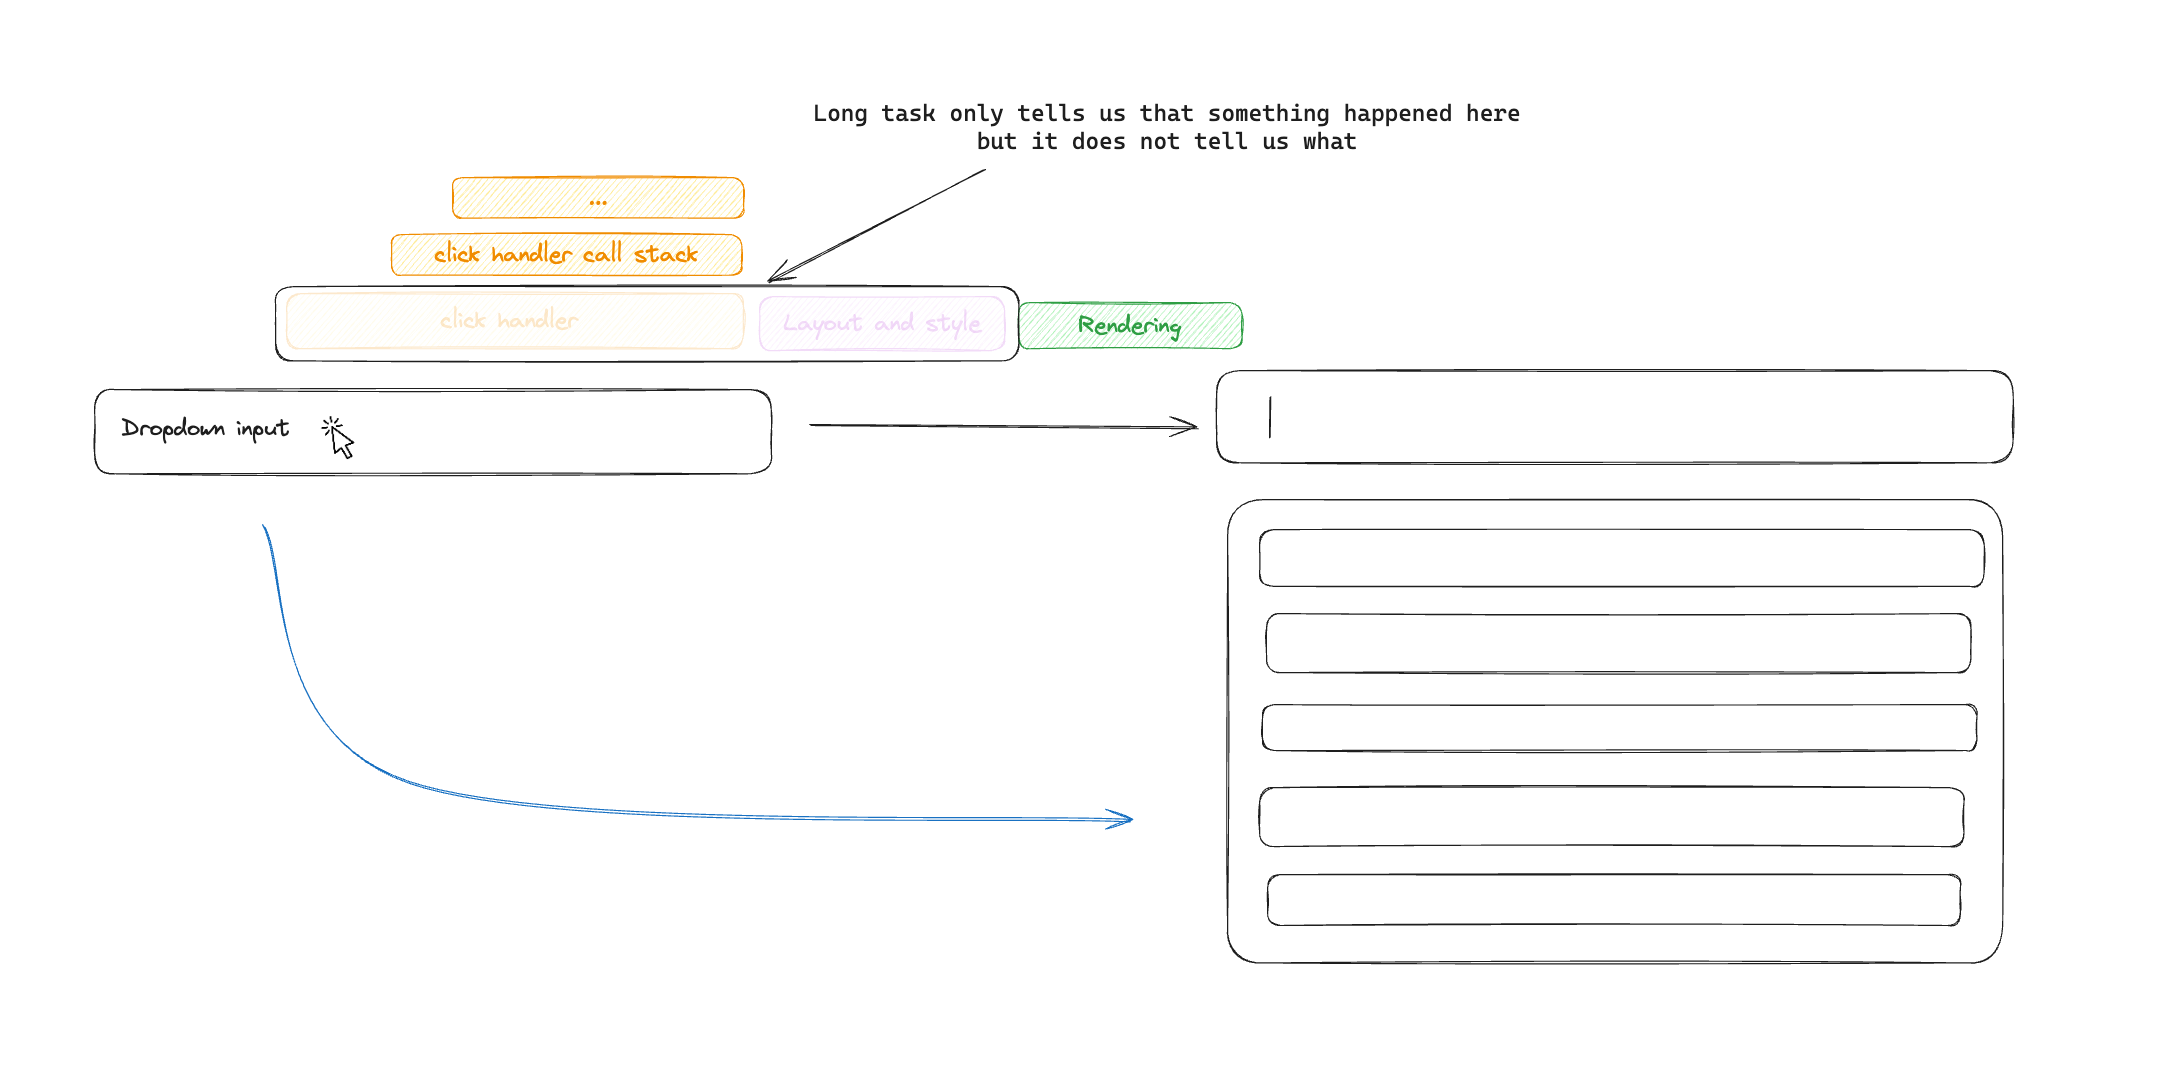
First, a refresher on the current state of long task reports. A long task report currently only tells us that a long task occurred, but doesn’t explain what happened during that time. Aside from the duration and a couple other properties, we don't really know what caused our performance issue.
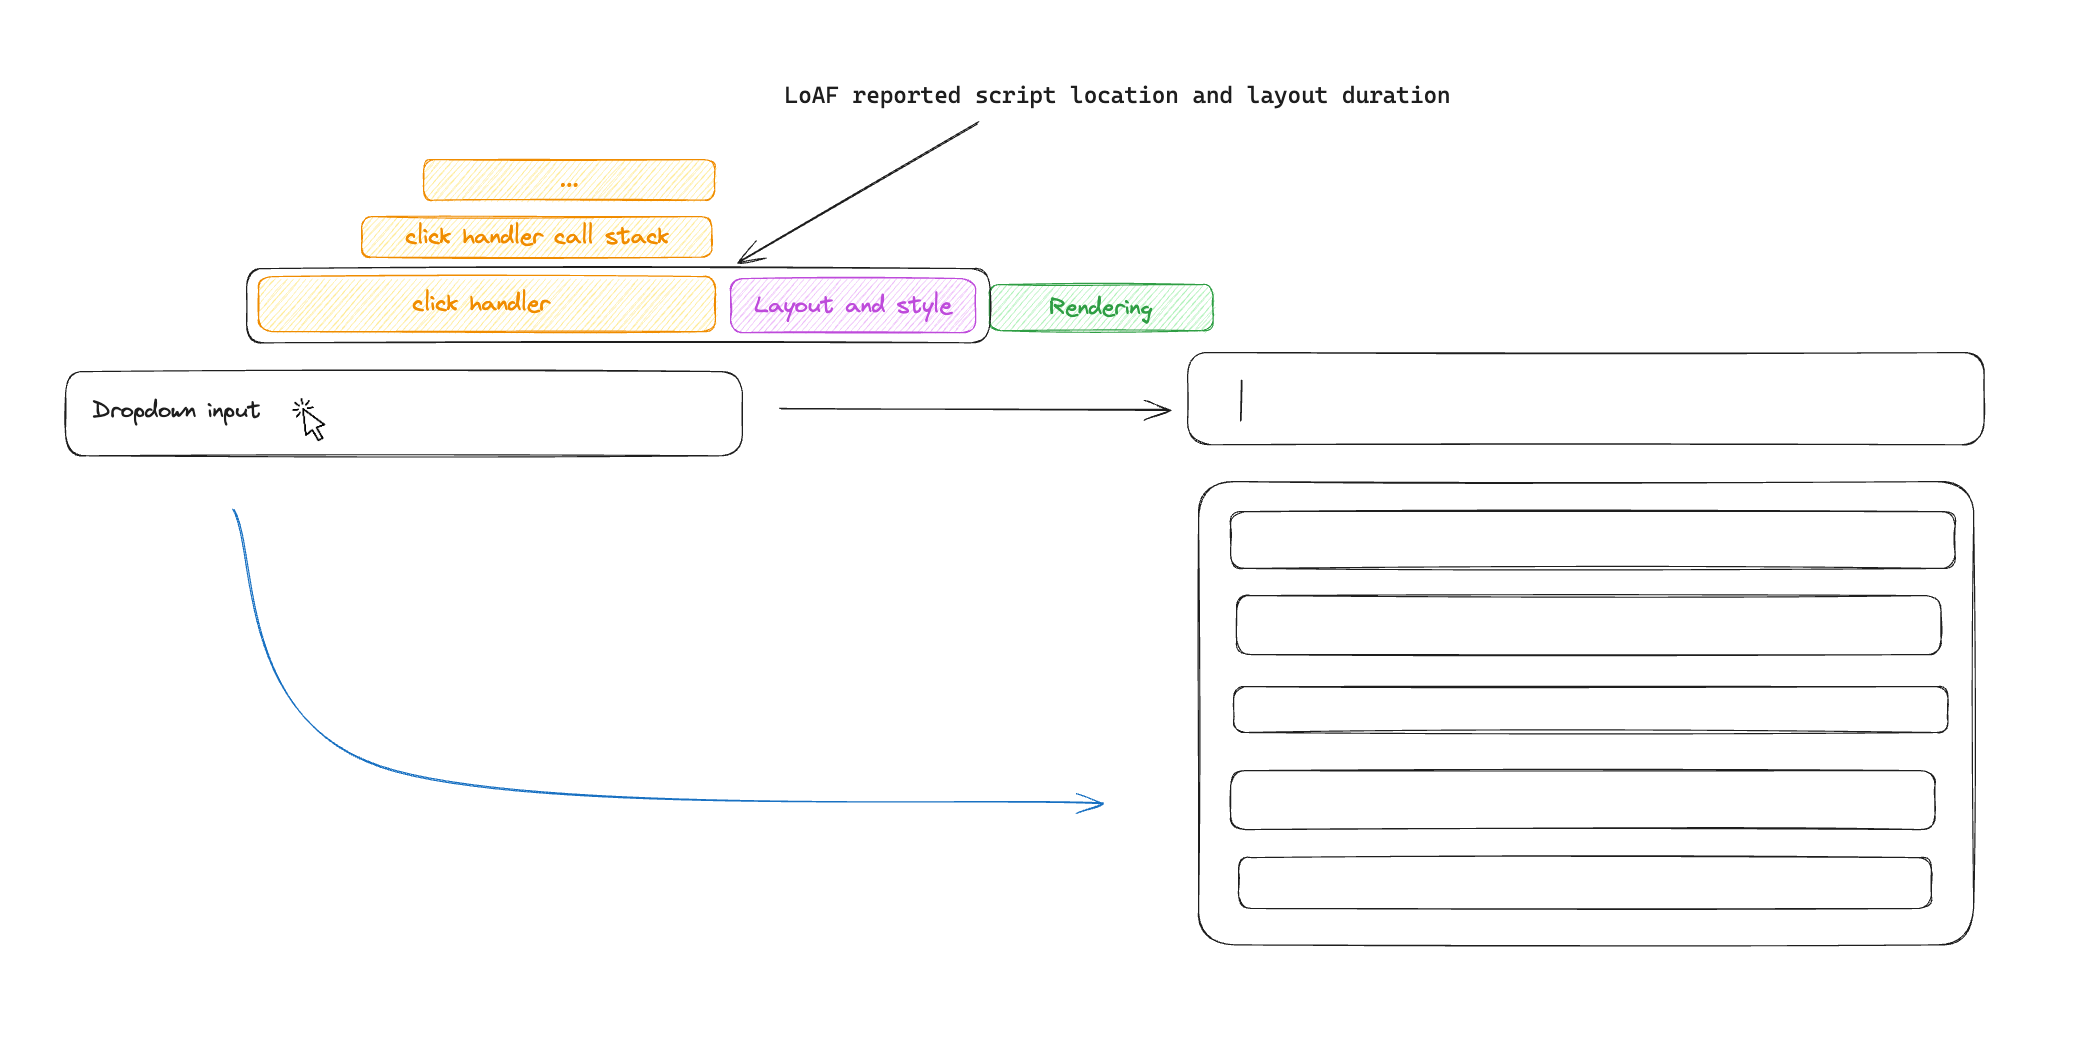
With LoAF, we now receive the script and layout duration attribution timings. This allows us to distinguish between issues caused by layout thrashing or script execution (or both), and narrow down on the cause. We now know if the browser layout had been invalidated, what script handler was executed as a consequence of our interaction, as well as that elements selector.
This might seem like it is enough to diagnose a root cause, however, I have encountered a few practical issues when attempting to use it. First, if you try to collect this from a production environment, the script location will often point to minified code, requiring an extra deobfuscation step to figure out where the function originated from in the source code. You might think we can just use source maps, however there is a small technical difference here as LoAF reports char position and not line/column locations, meaning some pre-processing will be required to make sourcemap deobfuscation work.
The second issue is somewhat of a data issue. From my testing, it seems that LoAF script attribution always points to the innermost stack frame, providing useful but often imprecise information on the source of the performance bottleneck. For example, adding a blocking function call inside an onClick react handler attribution would always point to the react-dom internal method that invoked my handler and the while true script that I added…
I’ve created a simple gist with steps to replicate a simple bottleneck and log the LoAF entries, I would be curious to see if you can get it to log an accurate location of your performance bottleneck.
Lastly, and this is not something that LoAF does today, but what it does not do. LoAF entries currently report layout thrashing as an external cause that trigger UI jank, but it overlooks another reason for screen paint delays — garbage collection. When garbage collection is triggered, the event loop is paused in what is often referenced as a “stop the world” event in which memory can safely be reclaimed. While it’s not a common source of performance issues, developers should still be able to identify their occurrence and assess their impact on user experience.
We’ve now looked into LoAF and how it helps us narrow down the attribution problem — and you may have noticed that is somewhat resembles stack-frame information collected by profilers. This brings us to the next point.
Attributing INP with js-self profiling
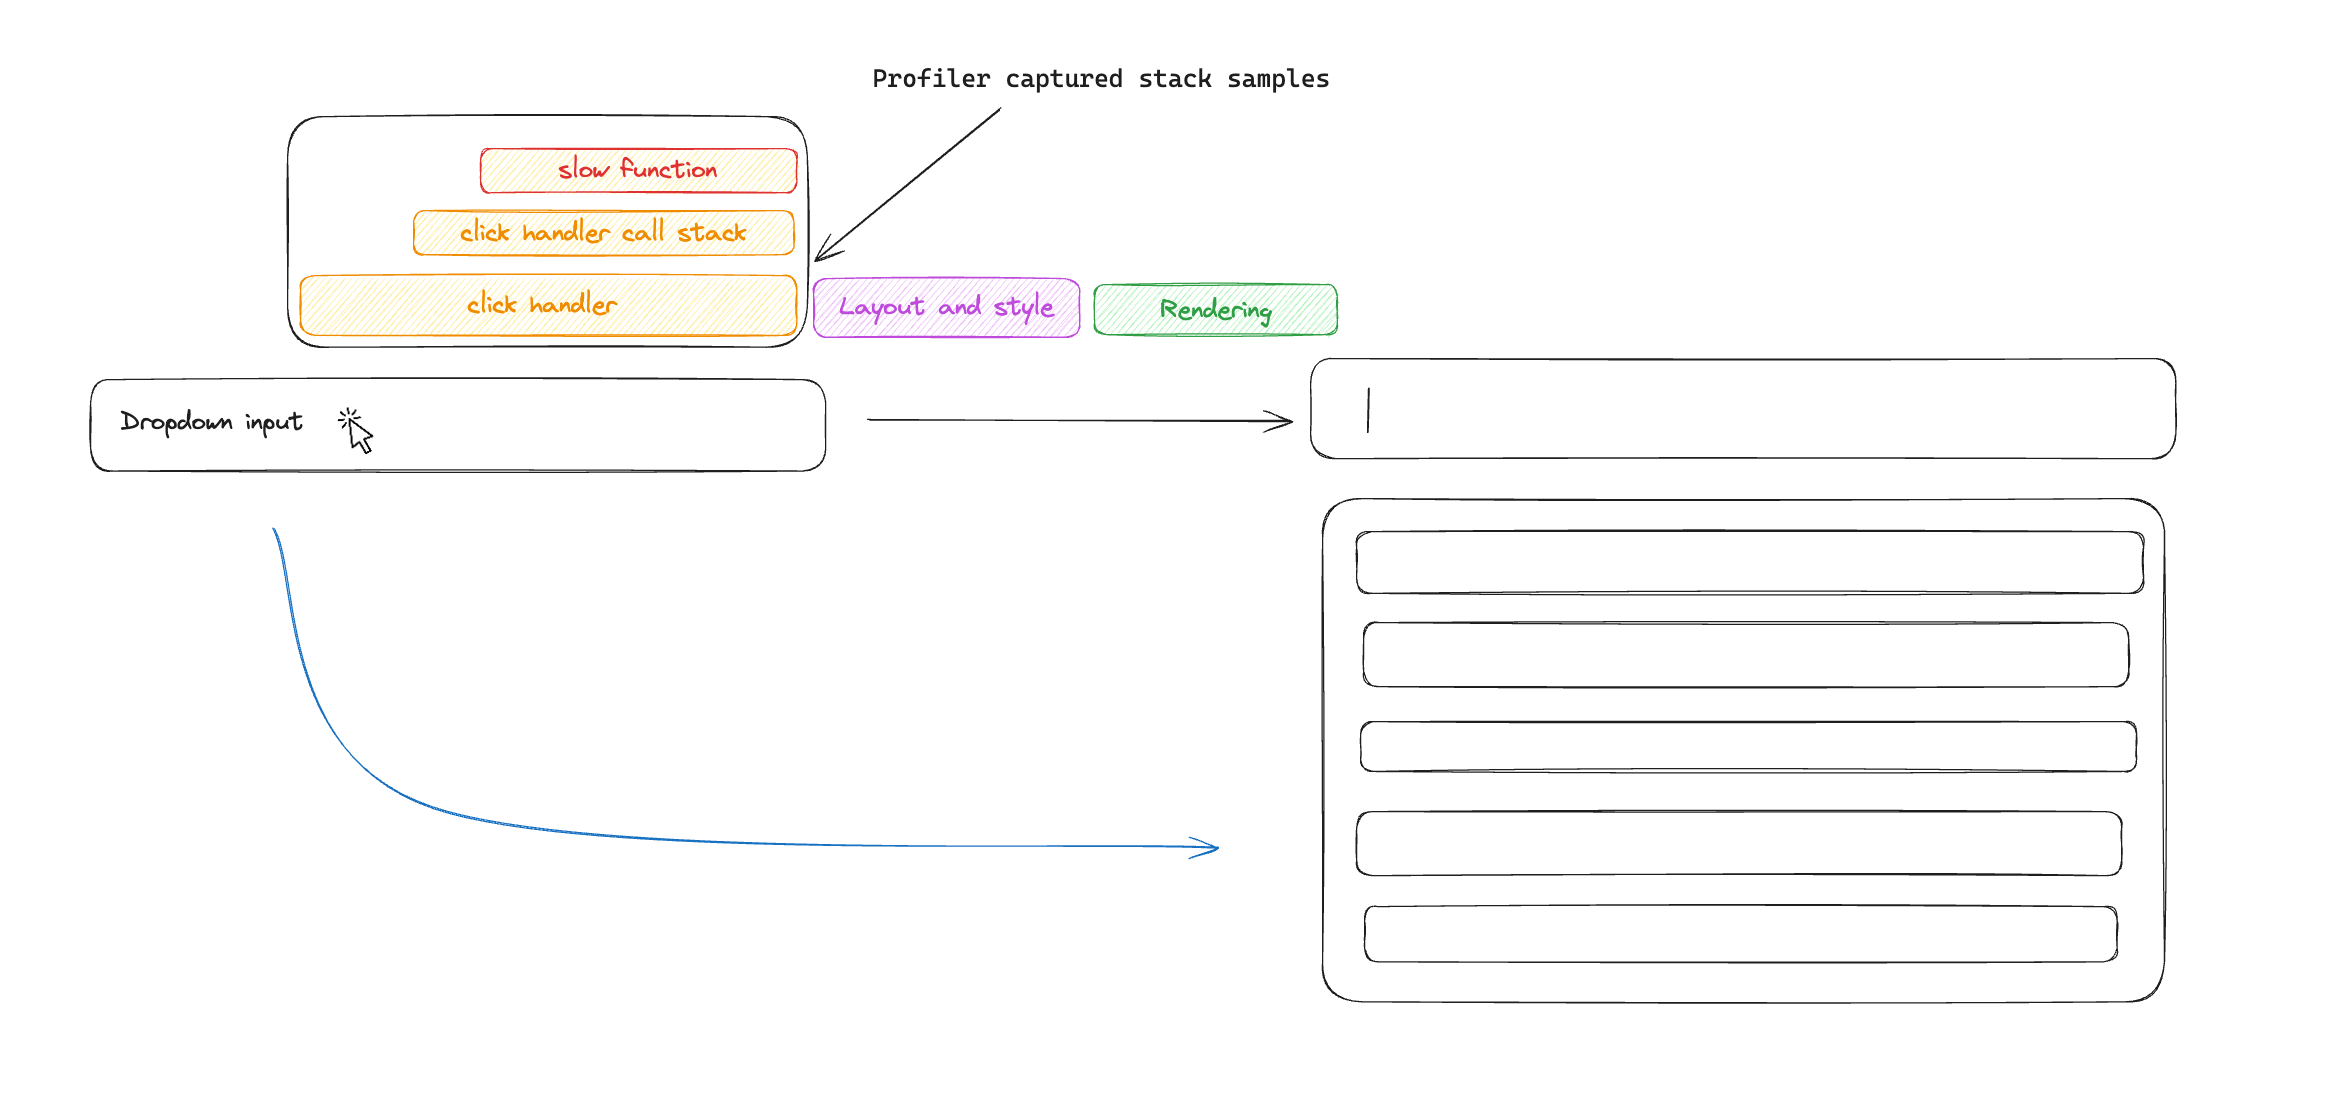
JS Self Profiling is a way for developers to programmatically start the profiler during our user session in production. The output is similar to what you would get from running a local browser profiler, however by being able to start and stop the profiler remotely, we can now collect profiles from production traffic. By collecting stack samples, we can visualize the JavaScript executing, which we can cross reference with our INP and FID data, showing us the code that was executed during that time.
Since we know what interaction (keydown, click…) and element (selector) are triggering INP, we can instrument it and start a profile.
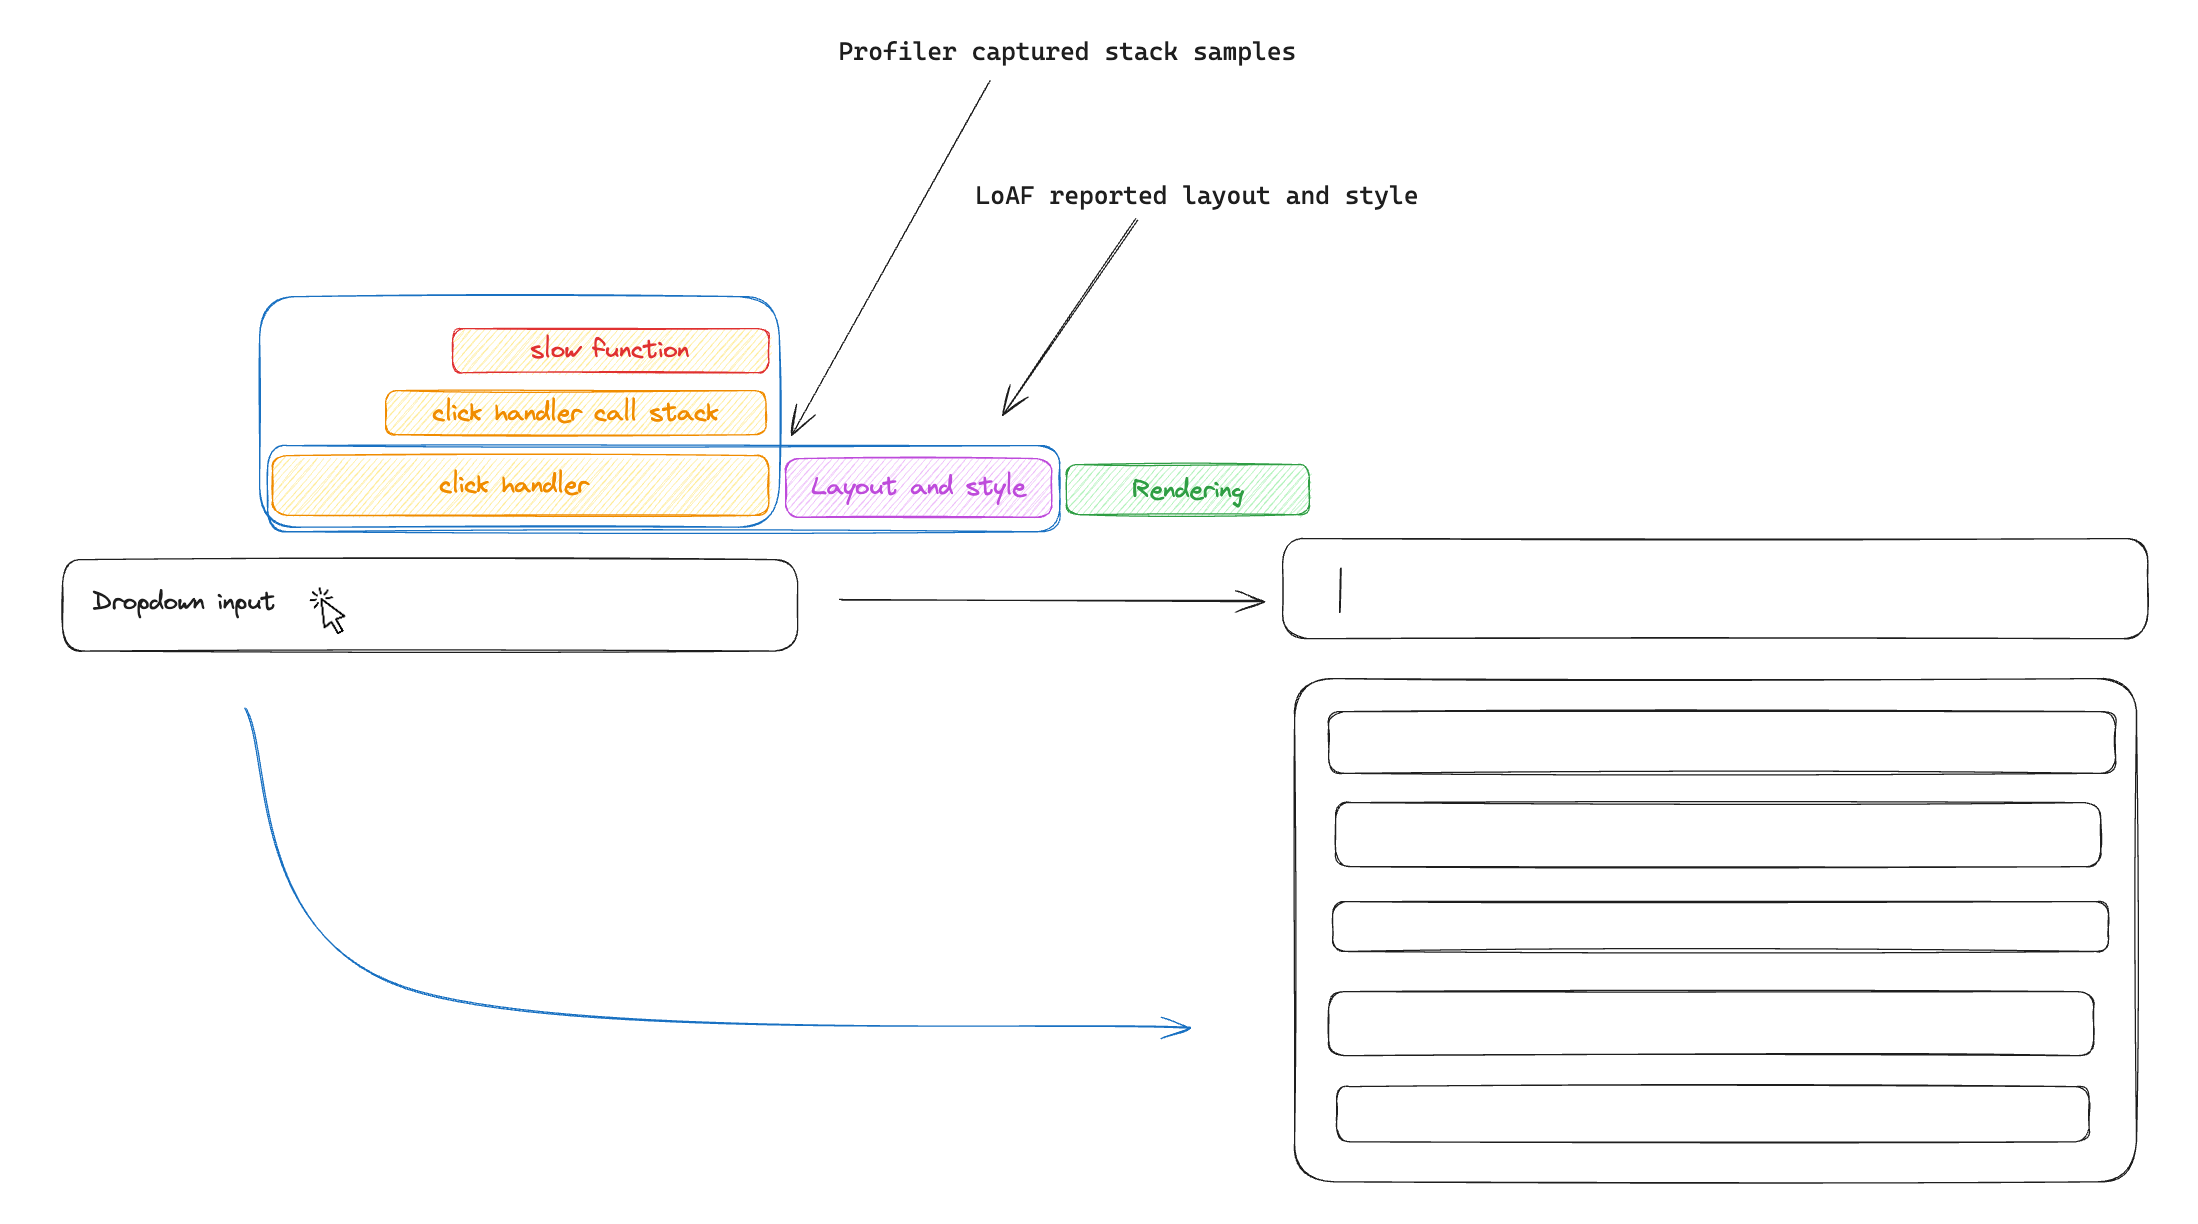
When we do so, we receive stack samples collected during that interaction, revealing the exact slow function and its location in our source code.
You may have noticed that we lost the information about layout and style recalculations - this is because the profiler that the browser exposes is a script profiler and does not see outside of the JavaScript stack. To fix this, we can overlay LoAF collected data over the profile timeline and visualize it to get a more complete picture.
💡 There is a markers spec proposal that extends profiler reported data to include browser events such as style and layout recalculations. If accepted, this could eventually paint a more complete picture than LoAF reports.
Of course, tradeoffs still exist. LoAF, being a report-only API, incurs minimal runtime cost (aside from reporting the data to the server) and simplifies data ingestion and visualization. Profiling, however, requires dedicated tooling to aid investigation and requires domain-specific knowledge to visualize and interpret.
There is also a reported runtime overhead of 3% when the profiler was enabled — though it’s important to recognize that this cost is incurred when the profiler is initialized, not for the duration of the profiler session. Although not ideal, I suspect that as profiling gains more traction, this overhead will be improved. We have not observed any slowdowns on Sentry.io, where profiling is implemented, and it’s proved valuable by catching regressions and enabling us to apply optimizations.
Moving on, let’s take a look at how we improved INP and FID for a very common interaction on Sentry.io using only real user data.
We started off by collecting input delay events from the production environment. By visualizing the elements that triggered input delays, we observed that a pointer down event on our search bar was a common cause of input delay issues.
This is a core component that every Sentry user interacts with on a daily basis, so we looked for ways to improve it.
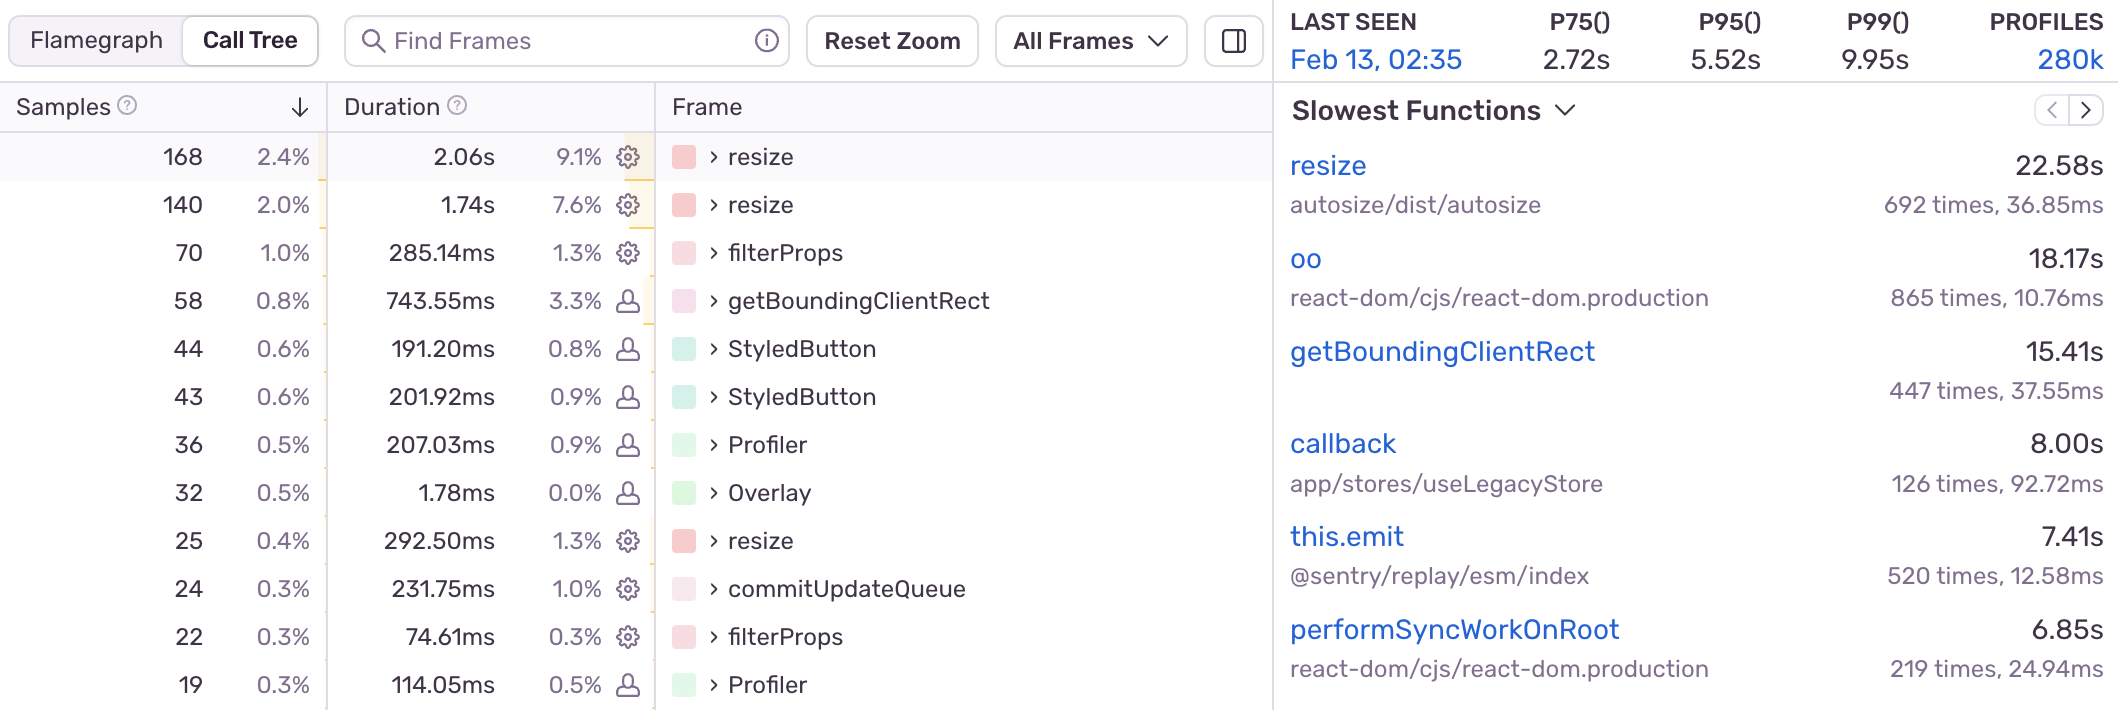
After instrumenting the interaction to start a profile, we identified a slow function called resize , which is often being called during this interaction. We can see that the sample counts as well as aggregated durations for this function are high, making it good optimization target.
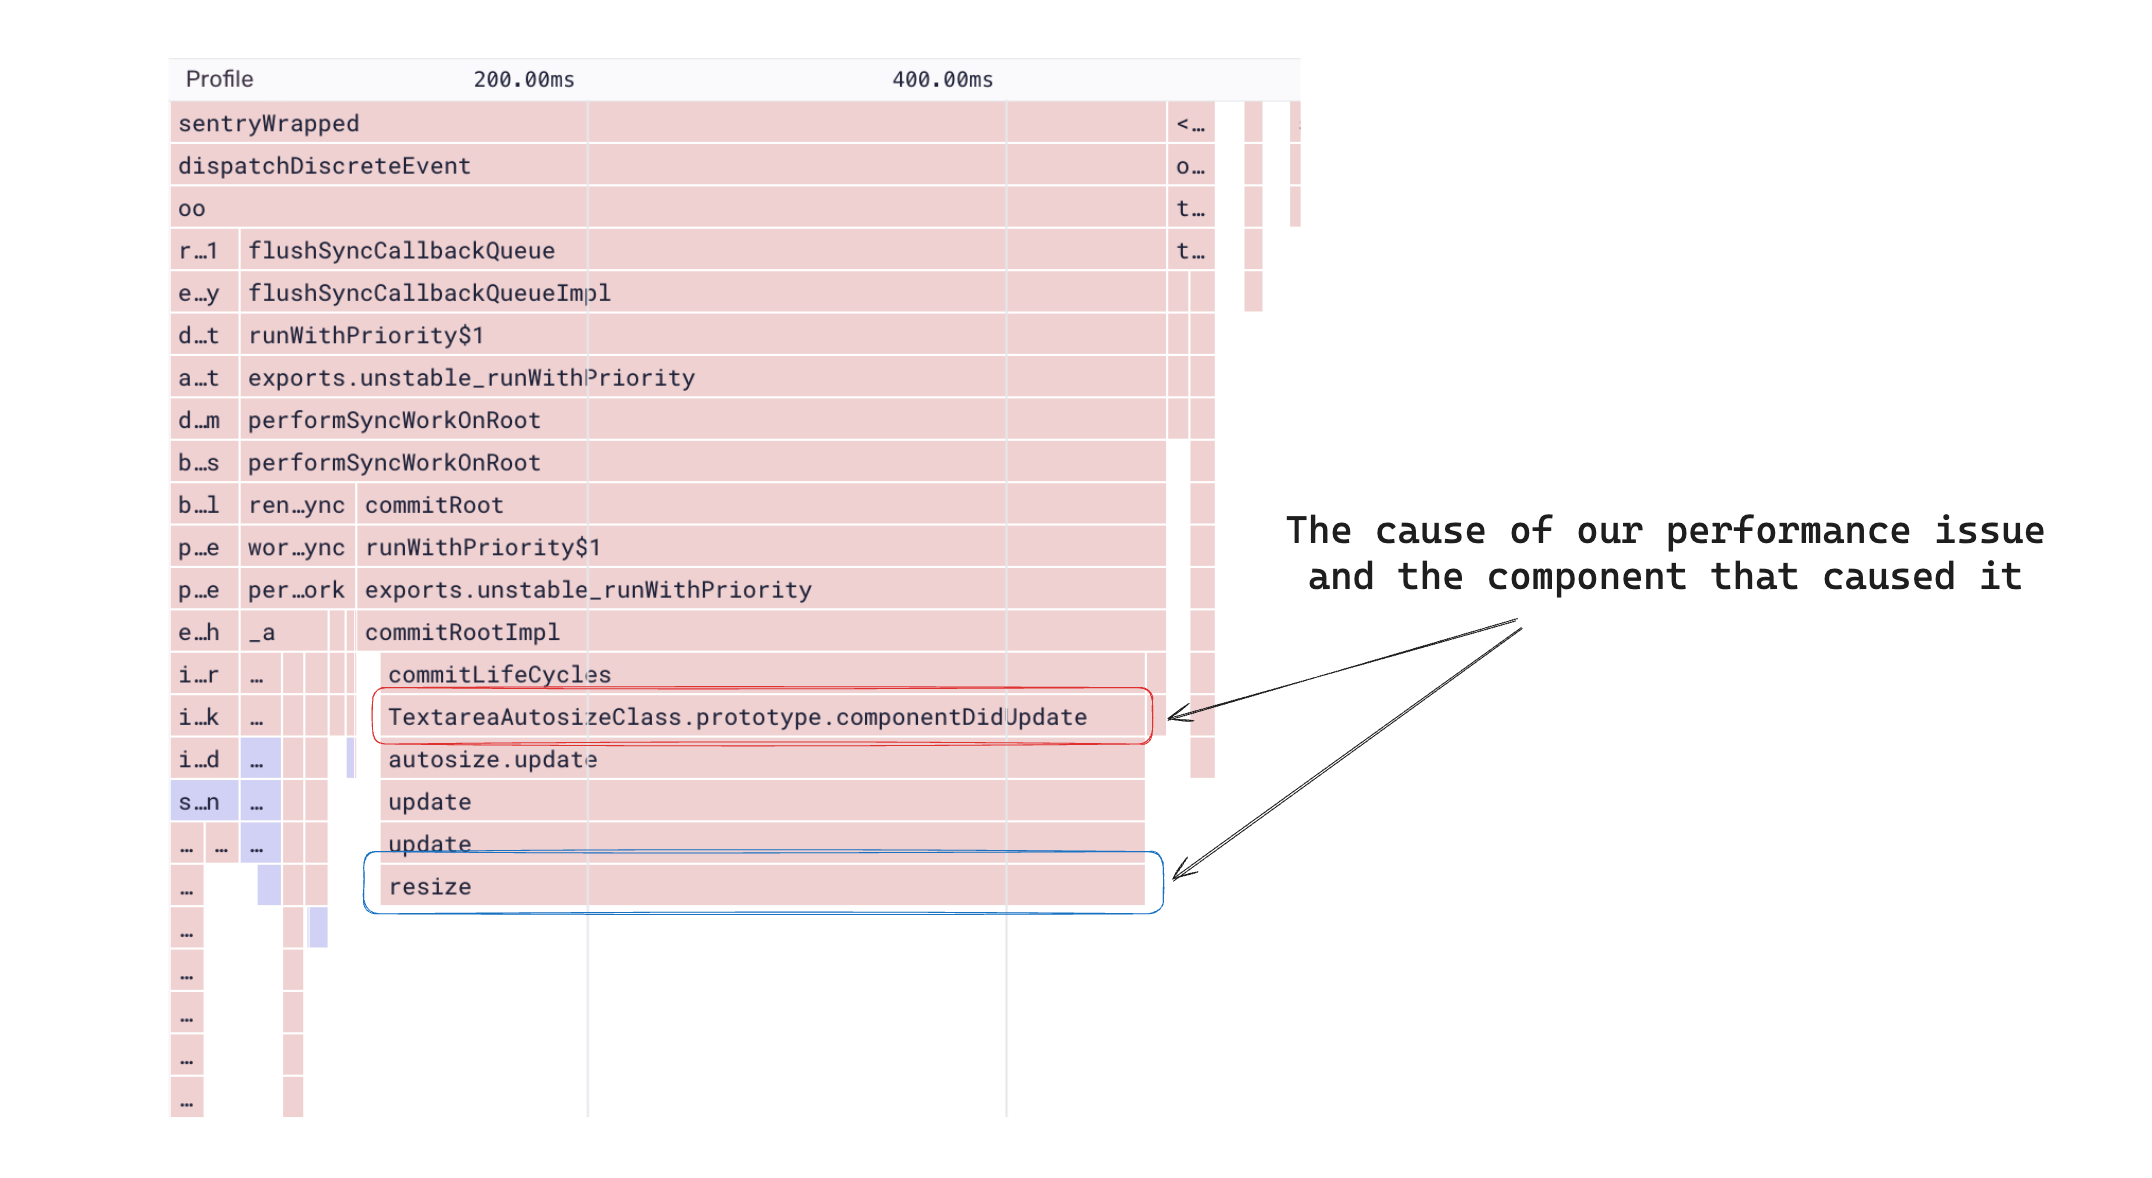
From our table view, we can quickly look at an example profile of where this function was collected, which reveals the slow duration.
Remember, raw profiler data includes minified function names and source locations that only exist as a result of your build process. This means most of the data is unusable without sourcemap resolution.
However, Sentry can process stack frames and symbolicate them to provide meaningful error stack traces — which also means those same sourcemaps can be used to process profiles and provide a more accurate output. This is why we see the path to a package called autosize and not function a@bundle.vendor.1341241.js.
We use the TextareaAutosize component here because we want to be able to handle increasing or decreasing vertical space as the input changes, which is not something easily doable with a native textarea input element.
To autosize the textarea depending on the content, we use the autosize component; however an alternative approach exists if we reconsider the relationship. Our input in fact consists of two components: the one rendering the tokenized output and the textarea overlaid above it. This means that there is already a container which is height aware —the container rendering the tokenized input.
So can we just tell our textarea to take 100% height of the tokenized area? Yes, we absolutely can. By changing the CSS rules of our textarea to be absolutely positioned inside our container, we no longer need to use the autosizing functionality, eliminating our performance issue. You can see the PR changes here.
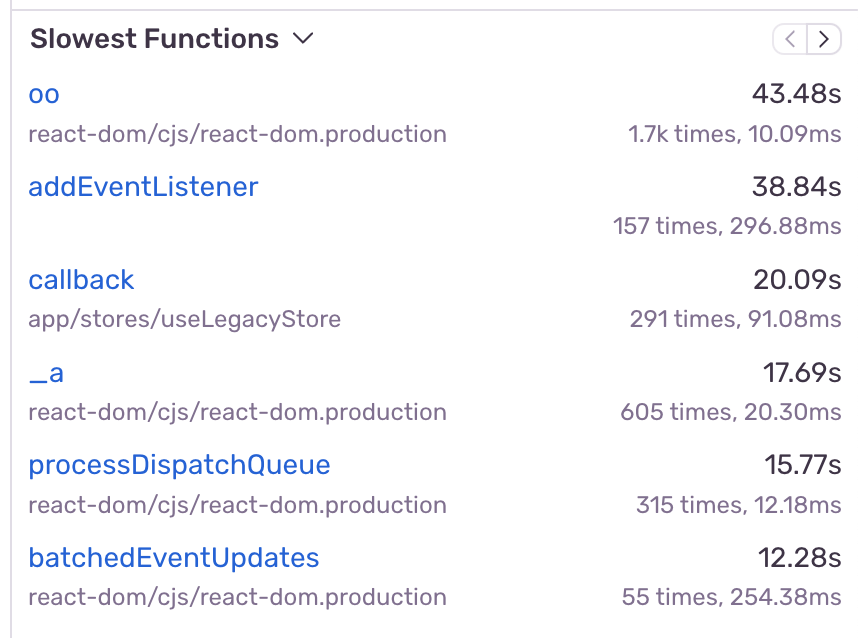
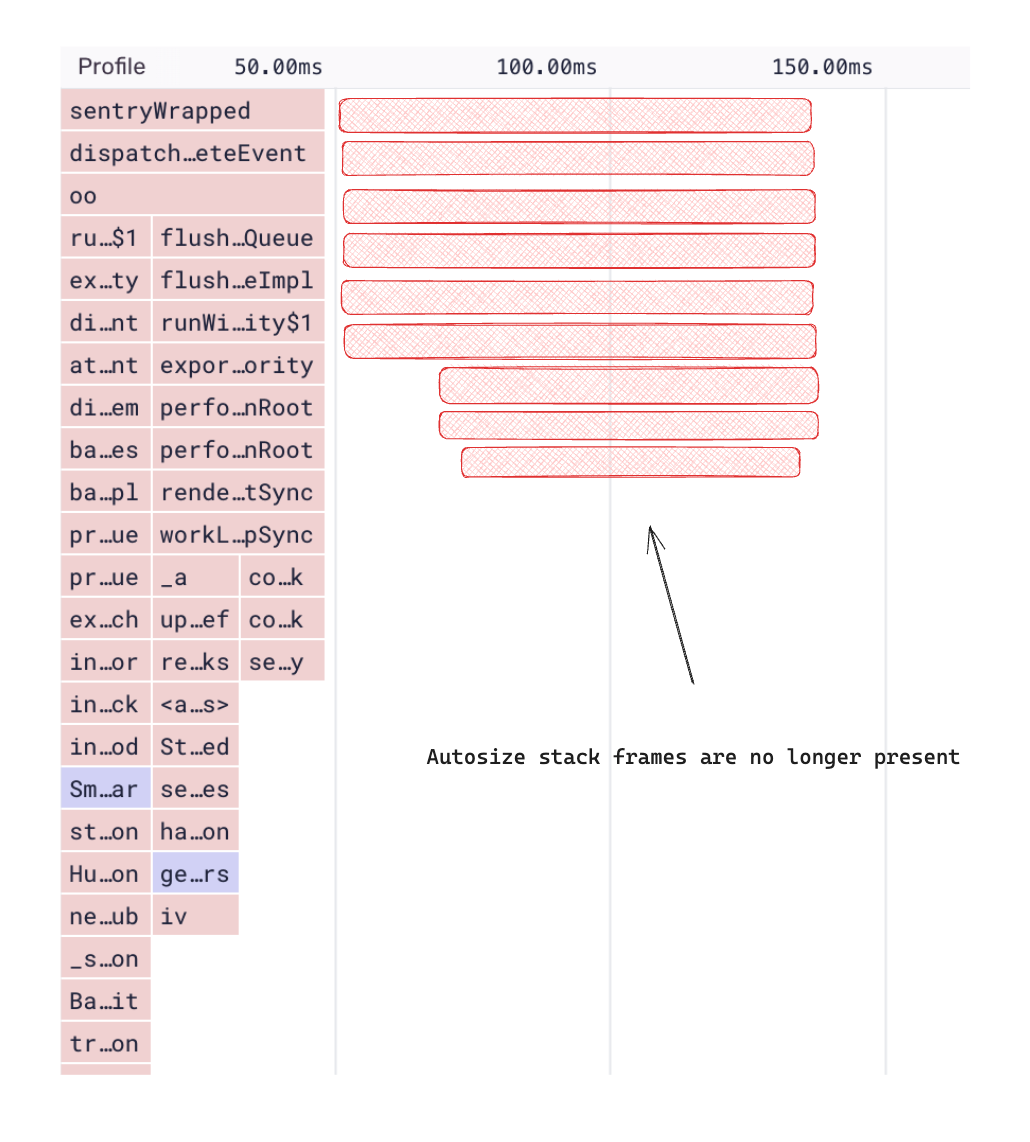
After deploying the changes, we can validate that autosize is no longer one of the slowest functions in this interaction and that the autosize stack frames are no longer collected.
Theory aside, we can compare user experience before and after our changes in a side-by-side example. We can see that one of the experiences has a noticeable delay upon user interaction, which we eliminated. Plus, we managed to do this by solely relying on real user data. This demonstrates that capturing FID and INP metrics and cross referencing them with profiling data helped us efficiently diagnose and fix the root causes of performance issues.
We had to manually instrument the interactions with profiling, which means that our changes had to go through a release cycle, meaning historical profiling data could not be retrieved before manual instrumentation was added, which can sometimes be too late to diagnose a performance issue. I believe that there is an opportunity here where profiling SDKs could become guided by the long task API and implement automatic instrumentation - this would remove the requirement to release any changes to our code in order to observe the impact performance issues (which may also be due to an external event).
Both LoAF and profiling are promising additions that complement each other, pushing performance beyond loading into the usability space. They can help your app not only load faster, but provide a pleasing user experience.

