How to Improve Performance in PHP
How to Improve Performance in PHP
PHP apps can be deceptively simple — until something starts slowing down. Maybe it’s a page load that takes a few seconds too long, or maybe your server costs are creeping up without a clear reason. That’s where performance monitoring comes in.
In this guide, we’ll walk through how to monitor and improve the performance of a PHP application. You’ll learn how to use profiling and tracing to identify bottlenecks in your code, and how to optimize your app. Whether you’re using Docker or already have PHP installed locally, you’ll be able to follow along with the examples.
The information in this guide is correct for PHP 8 and perhaps above, depending on the extent of future changes.
Prerequisites
You can run all code examples in this guide with Docker on any host operating system. If you don’t have Docker, download it here.
If you already have PHP installed, you don’t need Docker.
The following sections of this guide will show you how to use profiling and tracing to identify areas of code that are running too slowly. At the end of the guide is a checklist of best practices to help improve your site’s performance.
What is Profiling?
Profiling your app involves recording its performance data and analyzing it to see where code can be improved. Performance metrics include the time an app takes to perform a function for the user, and the CPU, memory, disk, and network bandwidth used while running the function. Lower values for all these metrics is better for the user, and better for your server fees.
Analyzing the recorded results involves identifying metrics that are higher than you want, and finding the lines of code responsible.
Generally, the time taken to perform a function, often inversely related to CPU use, is the most important metric to improve. Memory, disk, and network use are either easier to address or cannot be fixed.
You know the size of the data you are working with, and unless inefficient data structures are used or files are repeatedly accessed from the network or disk without caching, there’s probably little you can do about it.
Profiling PHP with SPX
The popular PHP debugging extension Xdebug also supports profiling, but its high system resource use will decrease the performance of your app and give you unrealistic results.
Instead, this guide demonstrates profiling with SPX (Simple Profiling eXtension). SPX is a lightweight tool dedicated to profiling, with a built-in web report and flame chart. SPX does not yet work on Windows, but that shouldn’t be a problem as PHP is normally deployed on Linux servers. Run SPX using Docker by following the instructions below.
In any folder on your computer, create a file called
dockerfilewith the content below, which installs SPX on a standard PHP Docker image.
FROM --platform=linux/amd64 php:8.3 RUN apt update \ && apt install zlib1g-dev git -y \ && cd / \ && git clone https://github.com/NoiseByNorthwest/php-spx.git \ && cd php-spx \ && git checkout release/latest \ && phpize \ && ./configure \ && make \ && make install
Create an
index.phpfile with the content below. The code uses multiple loops with a nested function to simulate a long-running PHP page load.
<?php
function go()
{
    for ($i = 1; $i <= 100000; $i++) {
        innerGo();
        if ($i % 10000 == 0) {
            echo "Count: $i<br>";
        }
    }
}

function innerGo()
{
    for ($i = 1; $i <= 10000; $i++) {
        ;
    }
}

go();
Create a
php.inifile with the content below:
error_reporting = E_ALL
display_errors = off
log_errors = on
error_log = log.log

extension=spx.so             ; enable SPX
spx.http_enabled = 1         ; enable the web UI
spx.http_ip_whitelist="*"    ; allow any computer to use the web UI. 0.0.0.0 is insufficient
spx.http_key="dev"           ; the web UI password
Run the commands below in a terminal in the same folder as these files. The first command builds the Docker image. The second command runs a temporary container based on the image that is configured with the
php.inifile above, which enables the SPX extension.
docker build --platform linux/amd64 -t phpspx -f dockerfile .

docker run --name phpbox --rm -v ".:/app" -p 8000:8000 --platform linux/amd64 phpspx php -S 0.0.0.0:8000 -t /app -c /app/php.ini
In a Chromium-based browser or Firefox, browse to both http://localhost:8000 and, in a separate tab, http://localhost:8000/?SPX_KEY=dev&SPX_UI_URI=/. You will see the SPX web UI in the second tab.
Refresh the first tab, then refresh the second tab. Now you will see a report line at the bottom of the screen that you can click on to open a report. Every time you want to see a new report, refresh both tabs.
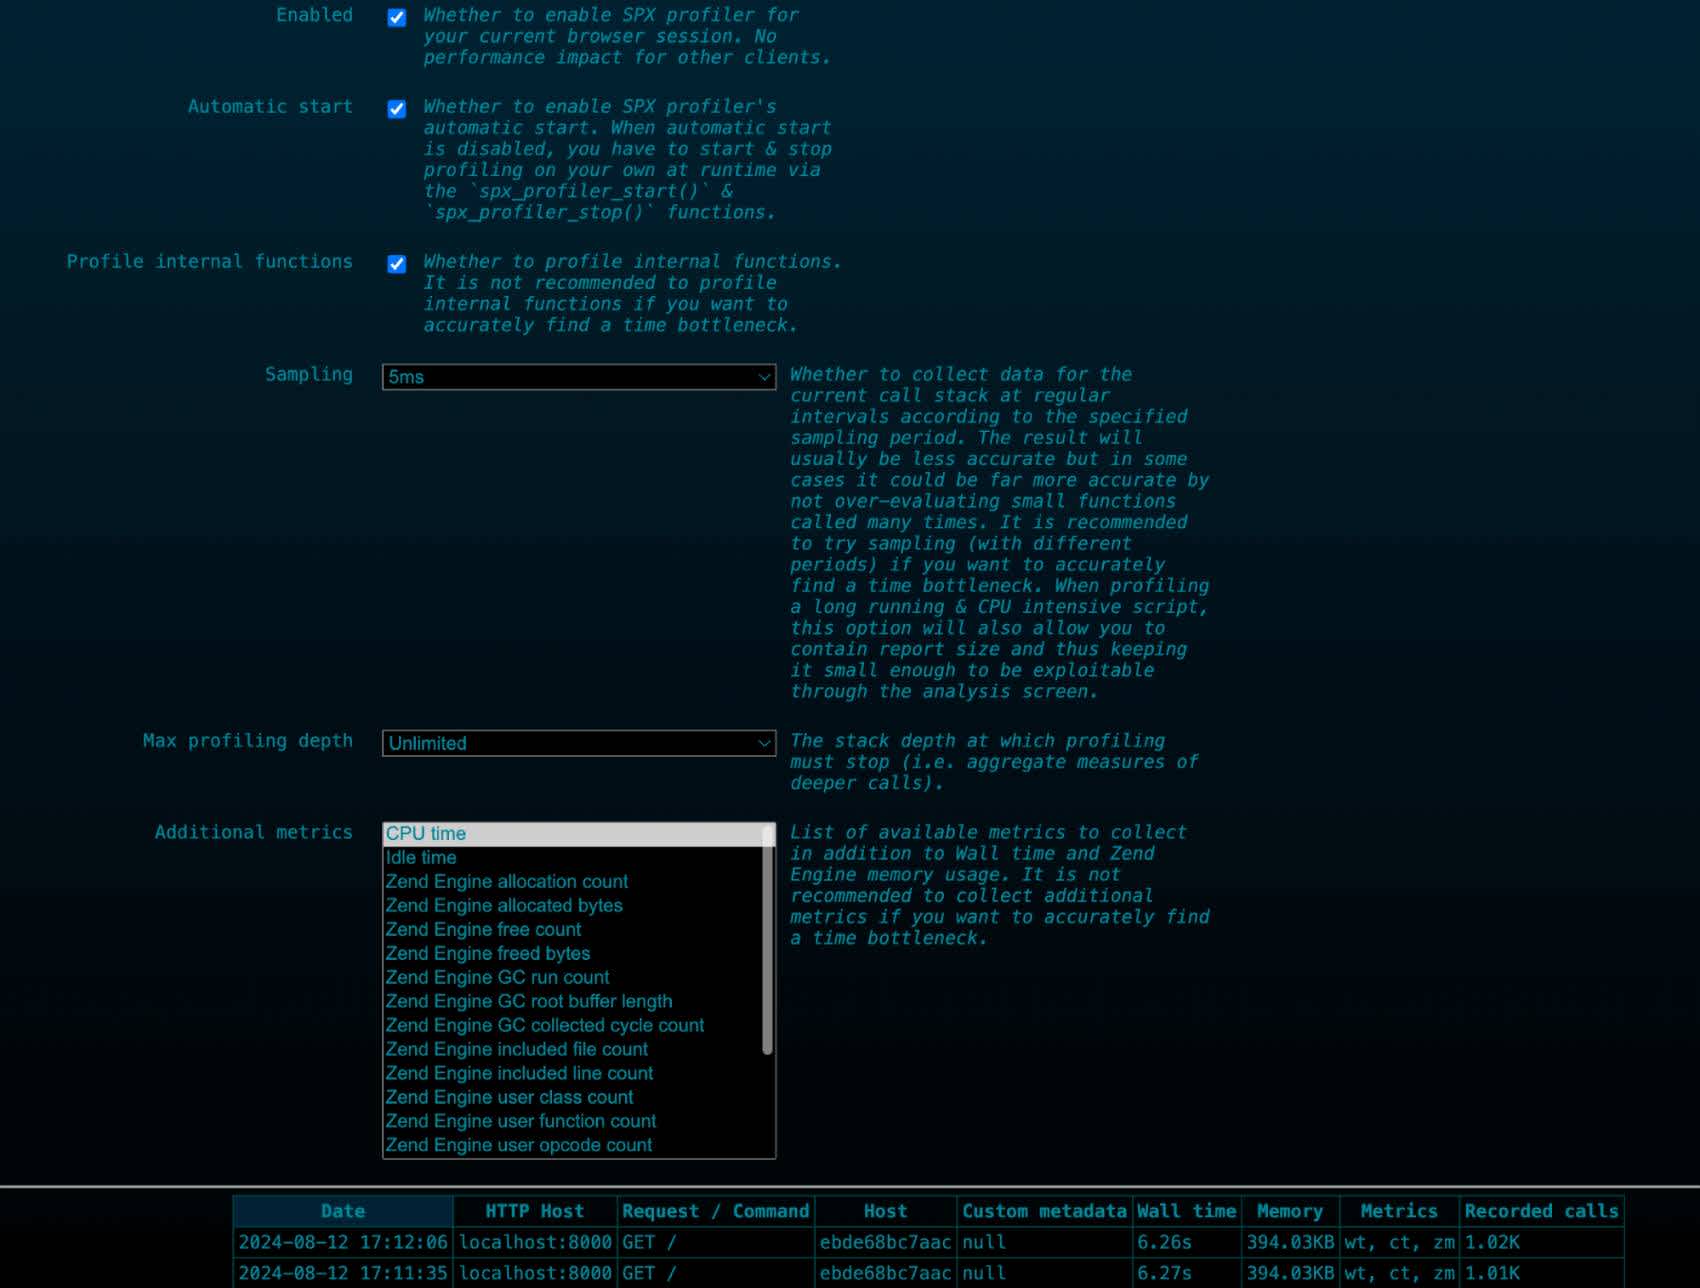
Below is what the web UI configuration page looks like, with the available reports separated into rows at the bottom.
SPX configuration
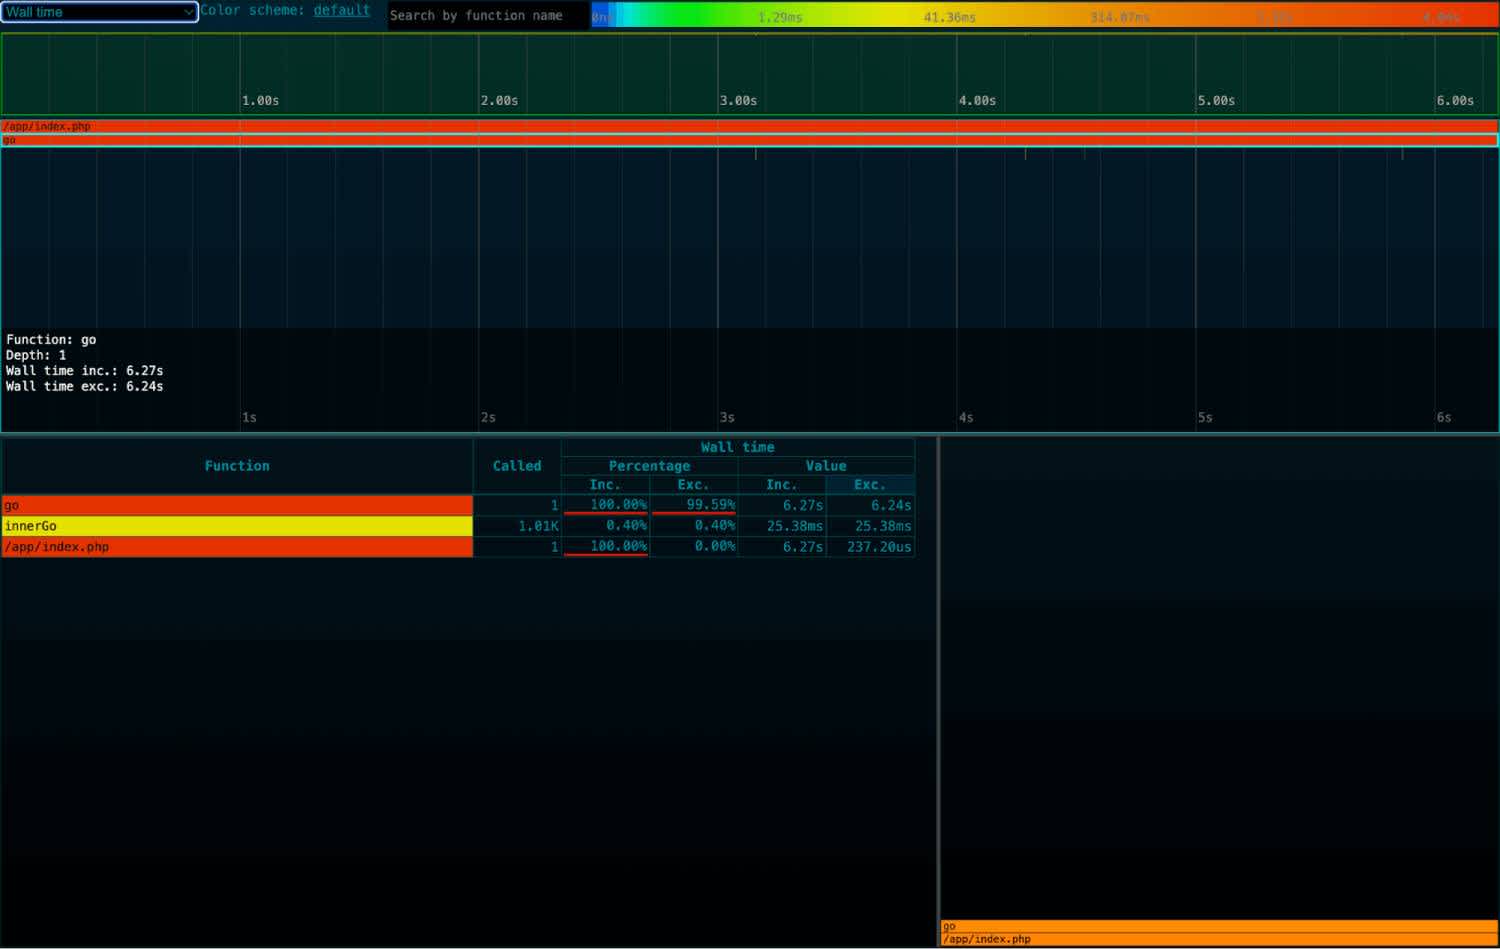
Below is an SPX report.
SPX report
In this report, we can see a flame chart displaying the two functions from index.php: go() and innerGo(). A flame chart visualizes a nested hierarchy of function calls as colored bars, representing the execution stack traces over time. This allows you to see which functions your app spends most of its time executing, as well as the sequence of functions called (execution flow).
A flame chart shows functions organized as follows:
Horizontal axis: Represents the elapsed time from left to right, showing the chronological order of function calls and their durations.
Vertical axis: Represents the stack depth or the hierarchy of function calls. Each function call is represented by a rectangular block, and the height of the block indicates the depth of the call stack at that point in time.
Colors: Different colors represent different types of functions or modules, making it easier to identify patterns and correlate them with specific parts of the codebase.
The chart displays the total time spent in go() (called “wall time”) and short spikes of time spent in innerGo(). The table on the bottom left gives the exact proportion of time each function takes. Wall time, also known as real time or elapsed time, refers to the actual time that passes from the start of a process or operation until its completion, as measured by a clock on the wall (hence the name “wall time”). It represents the total time experienced by a user waiting for a task to finish, including any time spent waiting for I/O operations, network latency, or other external factors. In this simple example, there is no IO, so the wall time will be the same as the CPU time.
Using the combo box at the top left, you can view other metrics about your page request, such as CPU time or RAM used. Wall time differs from CPU time, which only measures the time the CPU spends executing the code. When profiling, it’s important to consider both wall time and CPU time. Wall time measures overall end-to-end performance, while CPU time measures computationally expensive bottlenecks within the code itself.
SPX works equally well on this demonstration example as on a complex Laravel application. In both cases, a request from a customer for a page can be seen as a flame chart. The chart and metrics shown by SPX allow you to see where bottlenecks in your application are and check for other problems, such as spikes in CPU or RAM use. To use SPX with your real-world application, install it on your server with the code from the Dockerfile above, and add the php.ini code above to your INI file.
Be aware that using SPX provides a bigger attack surface for hackers to attempt to penetrate your site. Rather run it on your QA server than your live server. Be especially careful to set a strong password and whitelist only administrator IP addresses. For more information, read the SPX README.md file.
What is Tracing?
Profiling shows you the internal stack trace for your app, and how long each function takes. To understand the full path a user request takes across all services, you need to use distributed tracing. For example, a user on your site wants to know the status of a product she ordered. If instead of a monolithic website, you have one web service for authentication, and one service to handle orders, the response to the user’s request would work as follows:
The website receives the user’s
POSTrequest to get the order information for an order number.The web server for the website makes an internal HTTP request to the authentication service to check that the user’s cookie is valid.
The web server requests the order information from the order service and returns it to the user.
In the language of tracing, the full request path across all services is called a trace, and the work done in each service is called a span. Whenever a (parent) service calls another (child) service, such as the website calling the order service, it passes a random span ID with the call. The tracing tool that watches the flow of execution across all the services combines all the span IDs into a unified log of the whole request, called the trace. This happens for every request, or a sample of requests, made by users.
Tracing PHP with OpenTelemetry
The standard protocol for recording traces and performance metrics is OpenTelemetry. The ecosystem of tools built using OpenTelemetry include tracing tools for PHP.
To demonstrate how to record automated traces with OpenTelemetry simply, we’ll use a micro-framework called Slim. An even simpler framework would be Flight, but it doesn’t have an automated OpenTelemetry library. Packages for Laravel, Symfony, and WordPress are also available.
Automated Tracing for a Single Service
Let’s start with adding automatic tracing to a single web server with OpenTelemetry. This is similar to how profiling worked in the previous section. OpenTelemetry calls this “zero-code” instrumentation, as you don’t have to manually mark the start and end of traces with lines of code.
Unfortunately, the PHP OpenTelemetry documentation is broken at the time of writing this article. It is missing dependencies and their example does not run. This guide, however, gives you the exact PHP packages you need and specific code to run in Docker to ensure the example works on your system.
Start by creating an empty directory to work in and open a terminal there.
Create a file called dockerfile and insert the content below. This creates an image based on PHP 8.3, installs Composer, then adds all the OpenTelemetry extensions and the Slim web framework.
FROM php:8.3.13-alpine3.20
RUN apk add unzip git curl autoconf gcc g++ make linux-headers zlib-dev file
RUN curl -sS https://getcomposer.org/installer | php -- --install-dir=/usr/local/bin --filename=composer
RUN pecl install excimer && docker-php-ext-enable excimer
RUN pecl install opentelemetry && docker-php-ext-enable opentelemetry
RUN pecl install grpc
RUN docker-php-ext-enable grpc
RUN composer require slim/slim:4.14 slim/psr7 nyholm/psr7 nyholm/psr7-server laminas/laminas-diactoros open-telemetry/sdk open-telemetry/api open-telemetry/opentelemetry-auto-slim open-telemetry/opentelemetry-auto-psr18 open-telemetry/opentelemetry-auto-psr15 open-telemetry/exporter-otlp open-telemetry/transport-grpc guzzlehttp/guzzle open-telemetry/opentelemetry-auto-guzzleBuild the Docker image. This can take up to an hour, as the image has to compile the PHP gRPC extension in C (this line: pecl install grpc).
docker build --platform linux/amd64 -t phpbox -f dockerfile .While the command above is running, create a file called index.php and insert the content below. This code is a minimalist web server with a homepage, $app->get('/', that runs a function called callNetwork to take some time getting a page from the internet, then returns Hello world to the user. There is no OpenTelemetry code included, as tracing is automatically handled by the extension open-telemetry/opentelemetry-auto-slim.
<?php
use Psr\Http\Message\ResponseInterface as Response;
use Psr\Http\Message\ServerRequestInterface as Request;
use Slim\Factory\AppFactory;

require __DIR__ . '/vendor/autoload.php';

$app = AppFactory::create();

$app->get('/', function (Request $request, Response $response, $args) {
    callNetwork();
    $response->getBody()->write("Hello world!");
    return $response;
});

function callNetwork() {
    $context = stream_context_create(['http' => ['method' => 'GET', 'header' => 'User-Agent: PHP']]);
    $result = file_get_contents('https://example.com', false, $context);
}

$app->run();
Unlike profiling with SPX, OpenTelemetry only outputs traces, and it doesn’t display them. The simplest tool to collect and display the traces is Jaeger. We’ll run Jaeger in a separate Docker container.
First we create a Docker network that the PHP and Jaeger can both run on so they can talk to each other. (Even though PHP and Jaeger expose ports on your local host, the containers themselves treat localhost as their own internal container name, so you have to reference another container by its name on a shared network). Run the code below in a new terminal to create the network then start Jaeger.
docker network create jnet

docker run  --platform linux/amd64 --rm --network jnet --name jbox -p 4317:4317 -p 16686:16686 jaegertracing/all-in-one:latest
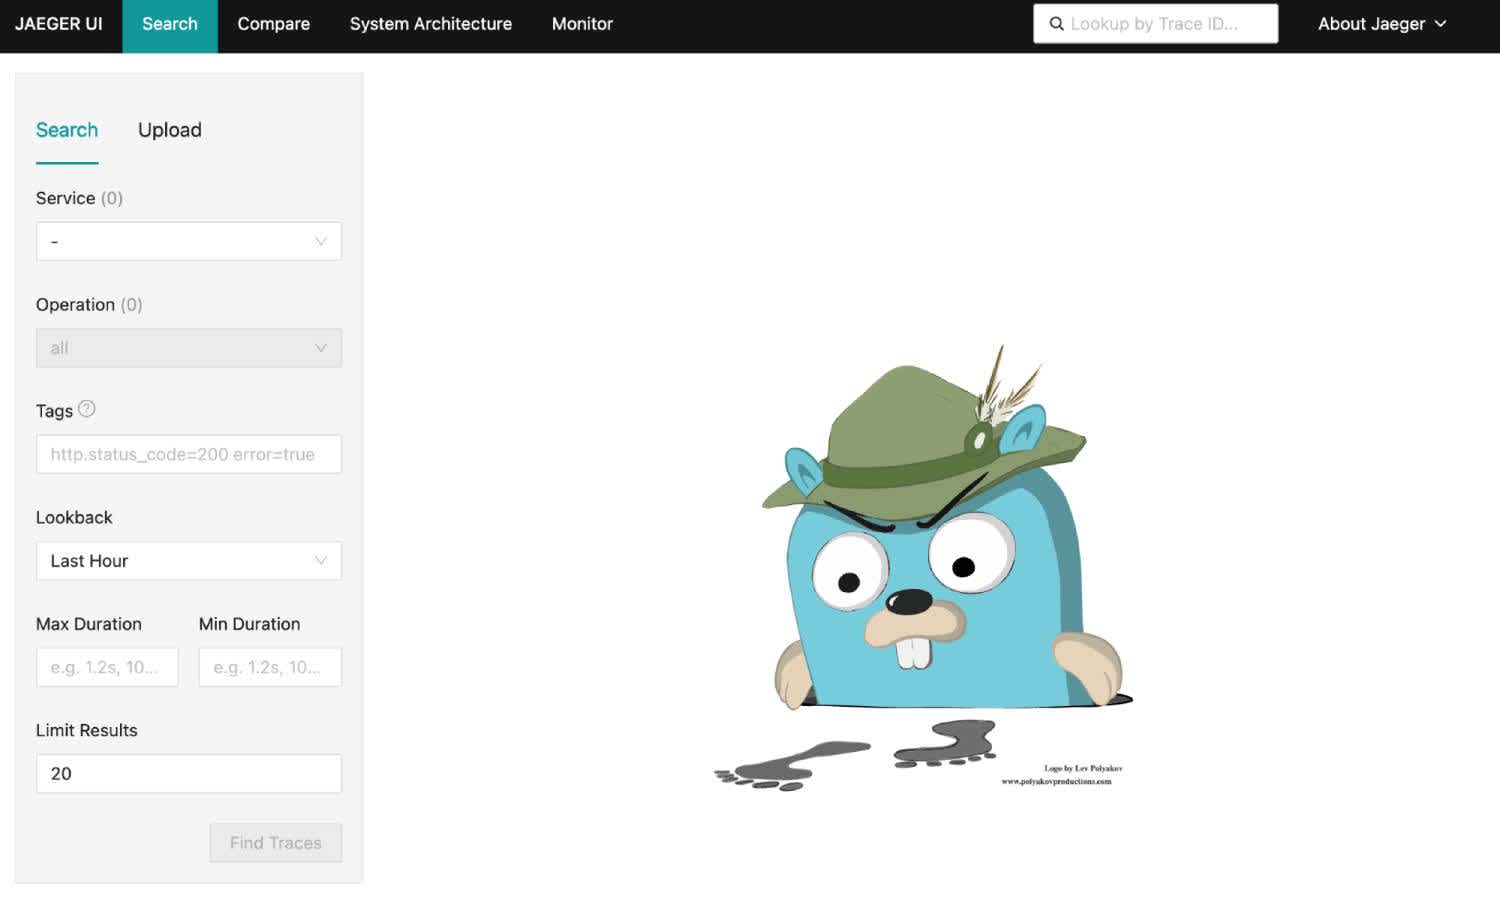
Check you can browse Jaeger at http://localhost:16686.
Jaeger
Refresh the page and see that the service count increases from 0 to 1. This is because Jaeger monitors itself.
Select Jaeger in the dropdown box at the top then click Find Traces at the bottom. You can click on any trace to expand it for more information about it.
Once the PHP Docker image has finished building, run the commands below in its terminal. This will install PHP modules to the vendor subdirectory, then start Slim with environment variables enabling OpenTelemetry and sending traces to http://jbox:4317.
docker run  --platform linux/amd64 --rm -v ".:/app" -w "/app" phpbox sh -c  "composer require  slim/slim:4.14 slim/psr7  nyholm/psr7  nyholm/psr7-server  laminas/laminas-diactoros  open-telemetry/sdk  open-telemetry/api  open-telemetry/opentelemetry-auto-slim  open-telemetry/opentelemetry-auto-psr18  open-telemetry/opentelemetry-auto-psr15  open-telemetry/exporter-otlp  open-telemetry/transport-grpc  guzzlehttp/guzzle  open-telemetry/opentelemetry-auto-guzzle"

docker run  --platform linux/amd64 --rm --network jnet -p "8000:8000" -v ".:/app" -w "/app" phpbox sh -c "env OTEL_PHP_AUTOLOAD_ENABLED=true   OTEL_SERVICE_NAME=app   OTEL_TRACES_EXPORTER=otlp   OTEL_EXPORTER_OTLP_PROTOCOL=grpc   OTEL_EXPORTER_OTLP_ENDPOINT=http://jbox:4317   OTEL_PROPAGATORS=baggage,tracecontext   OTEL_LOGS_LEVEL=debug   php -c /app/php.ini -S 0.0.0.0:8000 index.php"
Browse to http://localhost:8000. The page should display Hello world!.
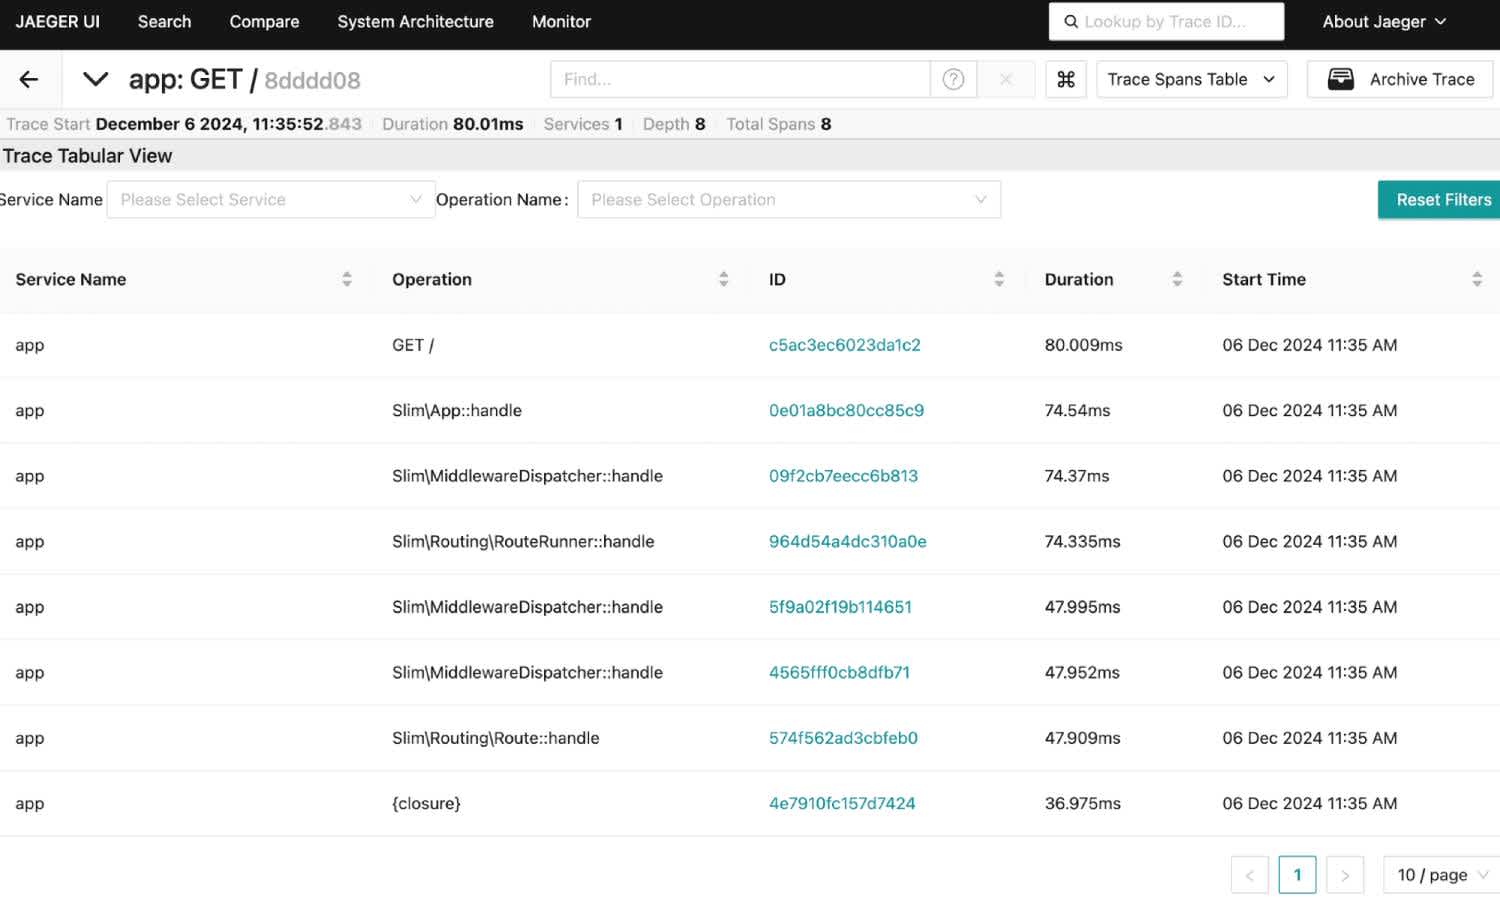
Back in Jaeger, you should now see the app service appear in the list of services. (This comes from OTEL_SERVICE_NAME=app.)
Jaeger with errors
Depending on your browser, you should see two traces: One that took over a second, because it made a network call to the web, and one of only a few milliseconds with an error. If you see the error trace, expand it to investigate further. The error likely occurred because the browser tried to request http://localhost:8000/favicon.ico, which does not exist. This demonstrates how tracing can detect an error that may not be noticeable when browsing your site.
If no traces appear in Jaeger, try writing them to the terminal instead of using gRPC. Alter your Docker run command for the website to use OTEL_TRACES_EXPORTER=console instead of OTEL_TRACES_EXPORTER=otlp. If traces appear in the terminal but not in Jaeger, it indicates a networking problem. If no traces appear, OpenTelemetry is not monitoring Slim. Check that all PHP packages are installed correctly and all environment variables are correct.
Explicit Tracing for a Single Service
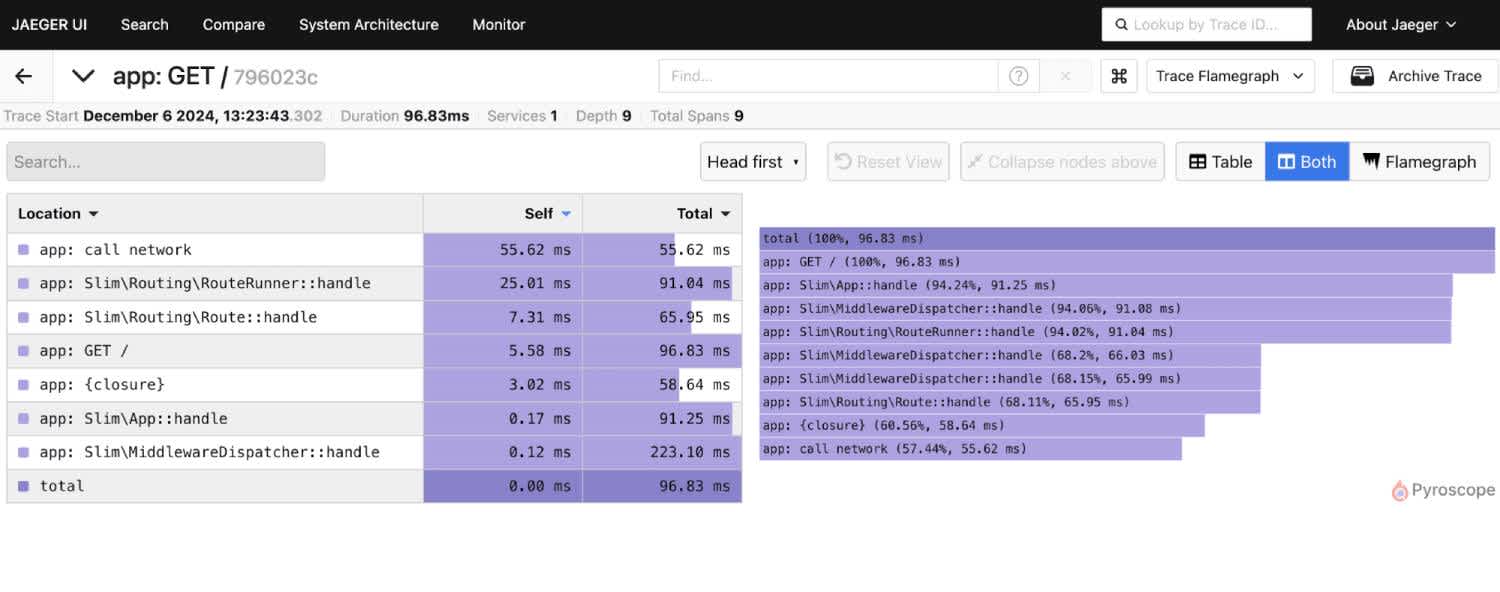
If you explore the trace with no errors in Jaeger, you’ll see that OpenTelemetry measured only the containing Slim GET method, not the internal callNetwork function that took all the time.
Jaeger timeline
To investigate at a finer granularity, you can either combine tracing with profiling, which measures all functions, or you can manually add OpenTelemetry instrumentation code for specific functions. Let’s look at how to use OpenTelemetry manually now.
Replace the contents of index.php with the code below.
<?php
use Psr\Http\Message\ResponseInterface as Response;
use Psr\Http\Message\ServerRequestInterface as Request;
use Slim\Factory\AppFactory;
use OpenTelemetry\API\Globals;

require __DIR__ . '/vendor/autoload.php';

$tracer = Globals::tracerProvider()->getTracer('app tracer');

$app = AppFactory::create();

 $app->get('/', function (Request $request, Response $response, $args) use ($tracer) {
    $span = $tracer->spanBuilder('call network')->startSpan();
    callNetwork();
    $span->addEvent('called network', [])->end();
    $response->getBody()->write("Hello world!");
    return $response;
});

function callNetwork() {
    $context = stream_context_create(['http' => ['method' => 'GET', 'header' => 'User-Agent: PHP']]);
    $result = file_get_contents('https://example.com', false, $context);
}

$app->run();
The new lines in the middle are the two calls on either side of callNetwork() that start and stop a new span you explicitly create.
Refresh the http://localhost:8000 page and return to Jaeger to see the new trace. If you explore the latest trace, you’ll now see there is a span recorded specifically for the network call, showing it uses above 90% of the total time of the request.
Jaeger explicit span
Distributed Tracing in PHP
The tracing examples we’ve examined so far don’t offer any benefit over profiling. Configuring distributed tracing provides deeper insights into request flows across services. This final tracing example demonstrates how to run two separate PHP services and use Jaeger to monitor how a request runs through both services and back to the user.
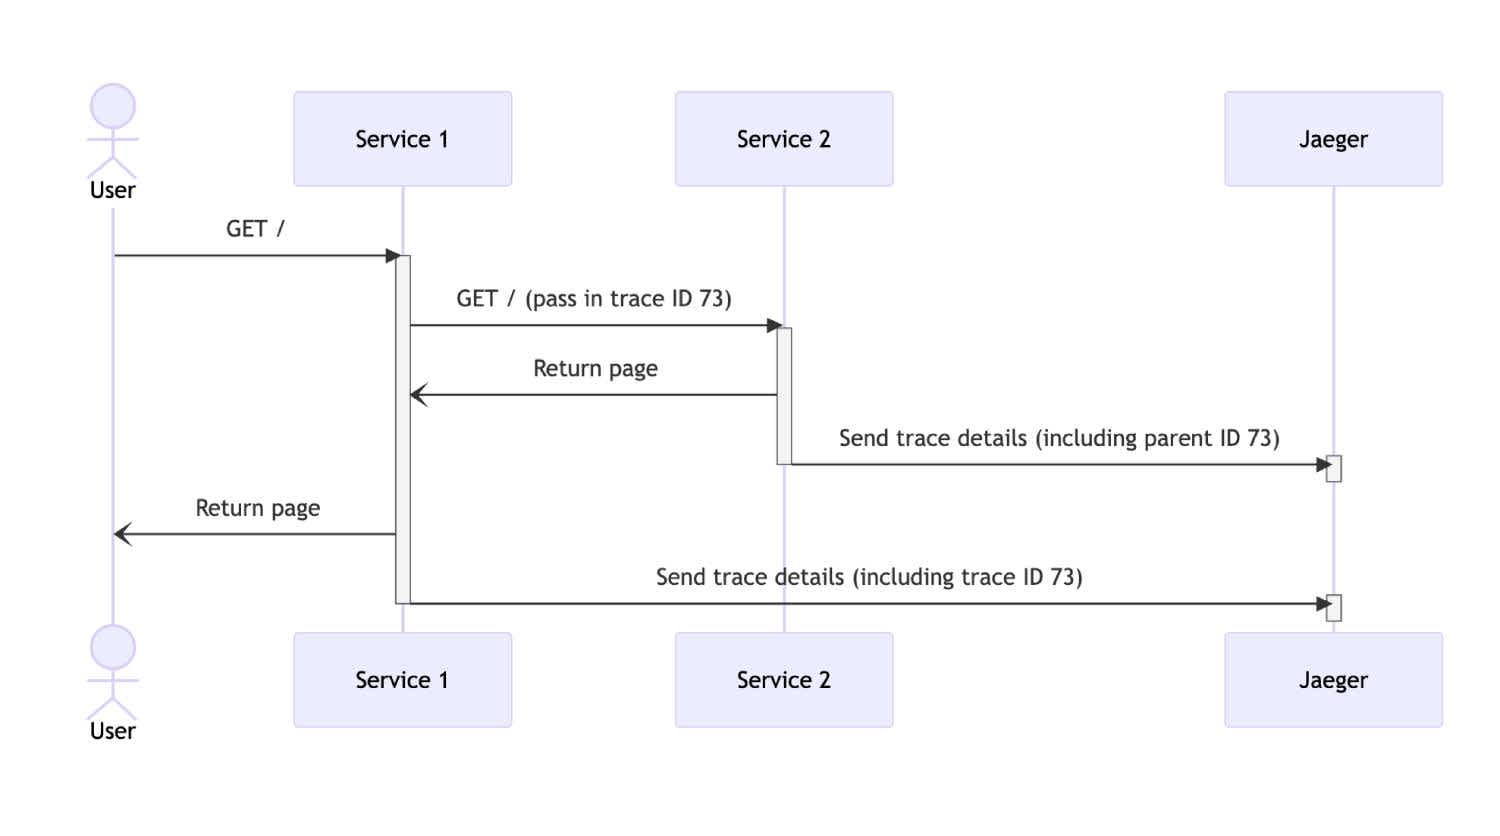
Trace IDs make it possible to track a user’s request flow across different services. When one service responds to a user request, OpenTelemetry gives it a random trace ID. When this parent service calls a child service, the trace ID is passed along in the request header. This is called propagation.
When Slim receives an HTTP request, OpenTelemetry automatically sends a trace about it to Jaeger. With two services involved, Jaeger receives two traces. However, because the child request includes the trace ID from the parent request, Jaeger automatically wraps the child trace inside the parent trace and displays only one trace.
Below is a diagram showing the flow of messages between the services. Read it from top to bottom to see the order of messages sent.
Message flow illustration
Let’s code this example now.
Create a file called
parent.phpand insert the content below, which includes theOpenTelemetry\APIpackages as we need to work with trace IDs directly. It also uses theGuzzleHttppackage to simplify making an HTTP call to another service. TheGETmethod for this parent service creates a new request tochildboxwith Guzzle, gets the current trace ID withTraceContextPropagator::getInstance, adds the trace ID to the request it’s about to make the child service at$childRequest->withAddedHeader($name, $value), then sends the request and returns the contents to the user. A little method at the end provides a favicon to the browser so there are no more errors shown in Jaeger.
<?php
use Psr\Http\Message\ResponseInterface as Response;
use Psr\Http\Message\ServerRequestInterface as Request;
use Slim\Factory\AppFactory;
use OpenTelemetry\API\Globals;
use OpenTelemetry\API\Trace\Propagation\TraceContextPropagator;
use OpenTelemetry\API\Trace\SpanKind;
use OpenTelemetry\SemConv\TraceAttributes;
use GuzzleHttp\Client;
use GuzzleHttp\Psr7\Request as GuzzleRequest;

require __DIR__ . '/vendor/autoload.php';

$tracer = Globals::tracerProvider()->getTracer('parent service');

$app = AppFactory::create();

$app->get('/', function (Request $request, Response $response, $args) use ($tracer) {
    $client = new Client();
    $childRequest = new GuzzleRequest('GET', 'http://childbox:8000');
    $outgoing = $tracer->spanBuilder('Parent calls child')->setSpanKind(SpanKind::KIND_CLIENT)->startSpan();
    $outgoing->setAttribute(TraceAttributes::HTTP_METHOD, $childRequest->getMethod());
    $outgoing->setAttribute(TraceAttributes::HTTP_URL, (string) $childRequest->getUri());
    $carrier = [];
    TraceContextPropagator::getInstance()->inject($carrier);
    foreach ($carrier as $name => $value) { $childRequest = $childRequest->withAddedHeader($name, $value); }
    $result = $client->send($childRequest);
    $outgoing->end();
    $responseBody = $result->getBody()->getContents();
    $response->getBody()->write("Parent called child, result: " . $responseBody);
    return $response;
});

$app->get('/favicon.ico', function (Request $request, Response $response) {
    return $response->withStatus(204);
});

$app->run();
Create a file called
child.phpand insert the content below. This code is similar to the original example and doesn’t do anything except return some text. It doesn’t need to explicitly get the parent trace ID from the request header — OpenTelemetry takes care of that automatically.
<?php
use Psr\Http\Message\ResponseInterface as Response;
use Psr\Http\Message\ServerRequestInterface as Request;
use Slim\Factory\AppFactory;
use OpenTelemetry\API\Globals;

require __DIR__ . '/vendor/autoload.php';

$tracer = Globals::tracerProvider()->getTracer('child service');

$app = AppFactory::create();

$app->get('/', function (Request $request, Response $response, $args) use ($tracer) {
    $response->getBody()->write("Hello from child!");
    return $response;
});

$app->run();
In the terminal where you last ran
index.php, stop it with Ctrl + C and run the parent service with the code below. Note at the end of the command we are now specifying the file to run, instead of it defaulting toindex.php.
docker run --platform linux/amd64 --rm --network jnet -p "8000:8000" -v ".:/app" -w "/app" phpbox sh -c "env OTEL_PHP_AUTOLOAD_ENABLED=true OTEL_SERVICE_NAME=app OTEL_TRACES_EXPORTER=otlp OTEL_EXPORTER_OTLP_PROTOCOL=grpc OTEL_EXPORTER_OTLP_ENDPOINT=http://jbox:4317 OTEL_PROPAGATORS=baggage,tracecontext OTEL_LOGS_LEVEL=debug php -c /app/php.ini -S 0.0.0.0:8000 parent.php"In a new terminal, run the child service with the code below. Note that this Docker container is named
childboxto allow the parent service to reference it on the network, similar to how the Jaeger service is identified asjbox.
docker run --platform linux/amd64 --rm --name childbox --network jnet -p "8001:8000" -v ".:/app" -w "/app" phpbox sh -c "env OTEL_PHP_AUTOLOAD_ENABLED=true OTEL_SERVICE_NAME=app OTEL_TRACES_EXPORTER=otlp OTEL_EXPORTER_OTLP_PROTOCOL=grpc OTEL_EXPORTER_OTLP_ENDPOINT=http://jbox:4317 OTEL_PROPAGATORS=baggage,tracecontext OTEL_LOGS_LEVEL=debug php -c /app/php.ini -S 0.0.0.0:8000 child.php"Refresh the page at http://localhost:8000 and return to Jaeger.
Explore the new request in Jaeger. You’ll see that the child service is nested inside the parent service call.
Jaeger with two services
If you have a suite of interdependent microservices, OpenTelemetry and Jaeger can help you see the exact path a request takes through all services, grouped into a single trace with multiple spans.
Distributed Tracing Including the Frontend
The process for including the frontend app (either native mobile or web app) in a distributed trace is similar to the server-side implementation:
Add an OpenTelemetry library for iOS, Android, or JavaScript to your app.
Include code in the frontend app to send traces to Jaeger.
Ensure the trace ID is included in requests to the server.
Jaeger will collate the full path of request flows from the user to the server all the way to the database calls, as long as the parent trace IDs are propagated properly.
Profiling and Tracing With an Online Service
So far, this guide has used free tools. But monitoring your application — being alerted to any errors and having a dashboard of application performance available at all times — is more complicated.
Free tools like Prometheus and Elastic are available to set up on your server, but they are complex and require you to maintain that server and scale it as your user base grows. Additionally, if your monitoring server goes offline, you won’t be alerted to problems.
A better approach is to use paid services, or the free starter tier of paid services, to provide an always-available monitoring service with a simple setup.
Using a paid tool instead of multiple free profiling, tracing, and error monitoring tools offers the advantage of an easy-to-manage, centralized solution using a single service.
This section shows you how to profile and trace an app with the free tier of Sentry. Follow the instructions below to set up a Sentry account, connect your app to Sentry, and monitor your app on the Sentry web interface.
First, stop all the running Docker containers in your terminal from the previous sections. You can reuse the same directory and overwrite the files in it, or create a new directory to work in.
Browse to https://sentry.io/signup and create an account. Skip onboarding.
Click Create project.
Choose PHP.
Enter a Project name.
Click Create Project.
On the next page, with setup instructions, note your dsn URL value. Keep it secret and do not commit it to GitHub.
Now, in a working directory on your computer, create a file called dockerfile with the content below. (You can overwrite your existing files from earlier in this guide, as we won’t need them anymore.)
FROM php:8.3.13-alpine3.20
RUN apk add zip unzip git curl autoconf gcc g++ make linux-headers zlib-dev file
RUN curl -sS https://getcomposer.org/installer | php -- --install-dir=/usr/local/bin --filename=composer
RUN pecl install excimer && docker-php-ext-enable excimer
RUN composer require slim/slim:4.14 slim/psr7 guzzlehttp/psr7 "^2" guzzlehttp/guzzle sentry/sentryBuild the image, called sbox.
docker build --platform linux/amd64 -t sbox -f dockerfile .Install the Composer dependencies for Sentry.
docker run --platform linux/amd64 --rm -v ".:/app" -w "/app" sbox sh -c "composer require slim/slim:4.14 slim/psr7 guzzlehttp/psr7 "^2" guzzlehttp/guzzle sentry/sentry"Create parent.php with the code below. Replace https://YOUR_DSN with your DSN URL in the Sentry initialization code.
<?php
use Psr\Http\Message\ResponseInterface as Response;
use Psr\Http\Message\ServerRequestInterface as Request;
use Slim\Factory\AppFactory;
use GuzzleHttp\Client;
use GuzzleHttp\Psr7\Request as GuzzleRequest;

require __DIR__ . '/vendor/autoload.php';

\Sentry\init([
    "dsn" => "https://YOUR_DSN",  // <-- REPLACE THIS
    'traces_sample_rate' => 1.0,
    'profiles_sample_rate' => 1.0,
    'logger' => new \Sentry\Logger\DebugStdOutLogger()
]);

$app = AppFactory::create();

$app->get('/', function (Request $request, Response $response, $args) {
    // start trace
    $transactionContext = \Sentry\Tracing\TransactionContext::make()->setName('Call child Transaction')->setOp('http.server');
    $transaction = \Sentry\startTransaction($transactionContext);
    \Sentry\SentrySdk::getCurrentHub()->setSpan($transaction);
    $spanContext = \Sentry\Tracing\SpanContext::make()->setOp('child_operation');
    $span= $transaction->startChild($spanContext);
    \Sentry\SentrySdk::getCurrentHub()->setSpan($span);
    $stack = new \GuzzleHttp\HandlerStack();
    $stack->setHandler(new \GuzzleHttp\Handler\CurlHandler());
    $stack->push(\Sentry\Tracing\GuzzleTracingMiddleware::trace());

    // call child
    $client = new \GuzzleHttp\Client(['handler' => $stack]);
    $result = $client->get('http://childbox:8000');
    $responseBody = $result->getBody()->getContents();
    $response->getBody()->write("Parent called child, result: " . $responseBody);

    // end trace
    $span->finish();
    \Sentry\SentrySdk::getCurrentHub()->setSpan($transaction);
    $transaction->finish();
    return $response;
});

$app->get('/favicon.ico', function (Request $request, Response $response) {
    return $response->withStatus(204);
});

$app->run();
The line \Sentry\init([ adds Sentry to the PHP app. Sentry initialization options are explained here. In this paragraph, you set your Sentry key, say that you want to collect 100% of traces and profiles, and route any error messages to the terminal so you can see if Sentry can’t connect to the server.
The same Slim GET request as in the previous example follows, calling the child service with Guzzle. Before the child is called, the code creates a new Sentry transaction, adds a span to it, and inserts the headers necessary for trace propagation into the Guzzle request. Explicit tracing like this is necessary if you aren’t using Laravel or Symfony. For those frameworks, Sentry provides automatic tracing.
Now create child.php with the code below. Replace https://YOUR_DSN with your DSN URL in the Sentry initialization code. This code is similar to the parent file, except the trace information from the parent service is first extracted from the GET request, then used to start a new transaction, with \Sentry\continueTrace.
<?php
use Psr\Http\Message\ResponseInterface as Response;
use Psr\Http\Message\ServerRequestInterface as Request;
use Slim\Factory\AppFactory;

require __DIR__ . '/vendor/autoload.php';

\Sentry\init([
    "dsn" => "https://YOUR_DSN",  // <-- REPLACE THIS
    'traces_sample_rate' => 1.0,
    'profiles_sample_rate' => 1.0,
    'logger' => new \Sentry\Logger\DebugStdOutLogger()
]);

$app = AppFactory::create();

$app->get('/', function (Request $request, Response $response, $args) {
    // get parent trace from headers
    $sentryTraceHeader = $request->getHeaderLine('sentry-trace');
    $baggageHeader = $request->getHeaderLine('baggage');
    $transactionContext = \Sentry\continueTrace($sentryTraceHeader, $baggageHeader);

    // create local transaction from parent transaction
    $transaction = \Sentry\startTransaction($transactionContext);
    $transaction->setName('Inside child transaction')->setOp('http.server');
    \Sentry\SentrySdk::getCurrentHub()->setSpan($transaction);
    $spanContext = \Sentry\Tracing\SpanContext::make()->setOp('span in child');
    $span = $transaction->startChild($spanContext);
    \Sentry\SentrySdk::getCurrentHub()->setSpan($span);

    // do work
    $response->getBody()->write("Hello from child!");

    // end local transaction
    $span->finish();
    $transaction->finish();
    return $response;
});

$app->run();
Run the child service.
docker run --platform linux/amd64 --rm --name childbox --network jnet -p "8001:8000" -v ".:/app" -w "/app" sbox sh -c "php -c /app/php.ini -S 0.0.0.0:8000 child.php"Run the parent service.
docker run --platform linux/amd64 --rm --network jnet -p "8000:8000" -v ".:/app" -w "/app" sbox sh -c "php -c /app/php.ini -S 0.0.0.0:8000 parent.php"Browse to http://localhost:8000.
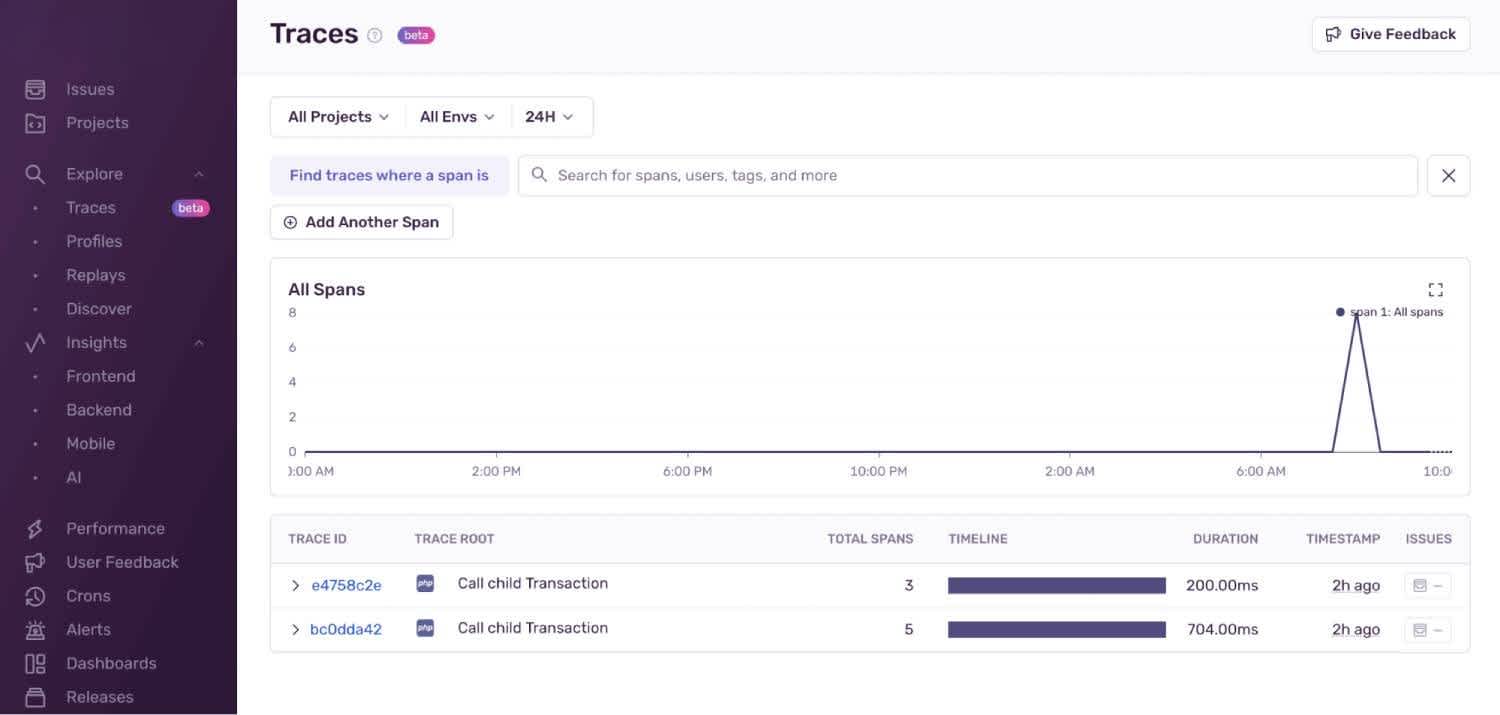
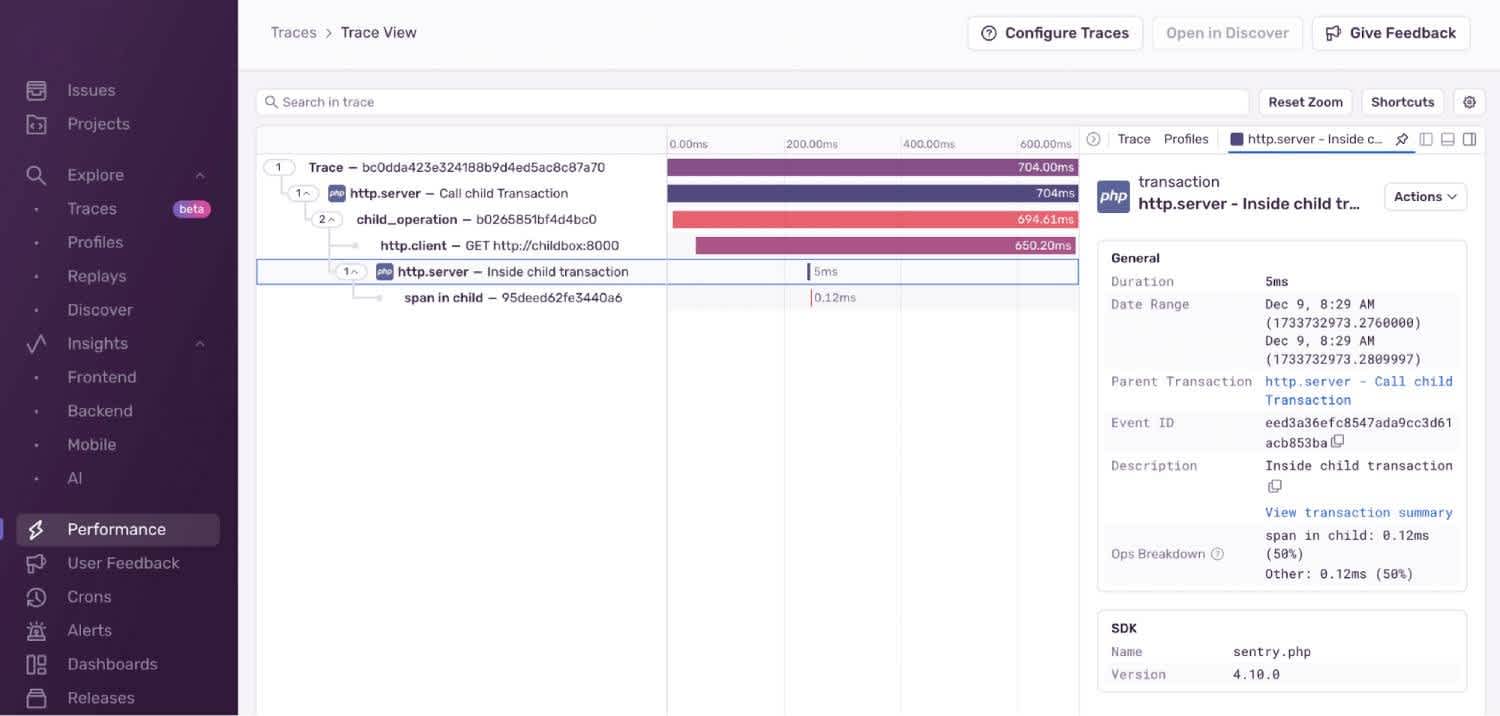
On the Sentry web interface, browse to Traces. You may need to wait a few minutes for your trace to arrive, but it should look like the images below. You can see that Sentry has linked the child and parent traces with the same trace ID, similar to OpenTelemetry.
Sentry traces
Sentry trace
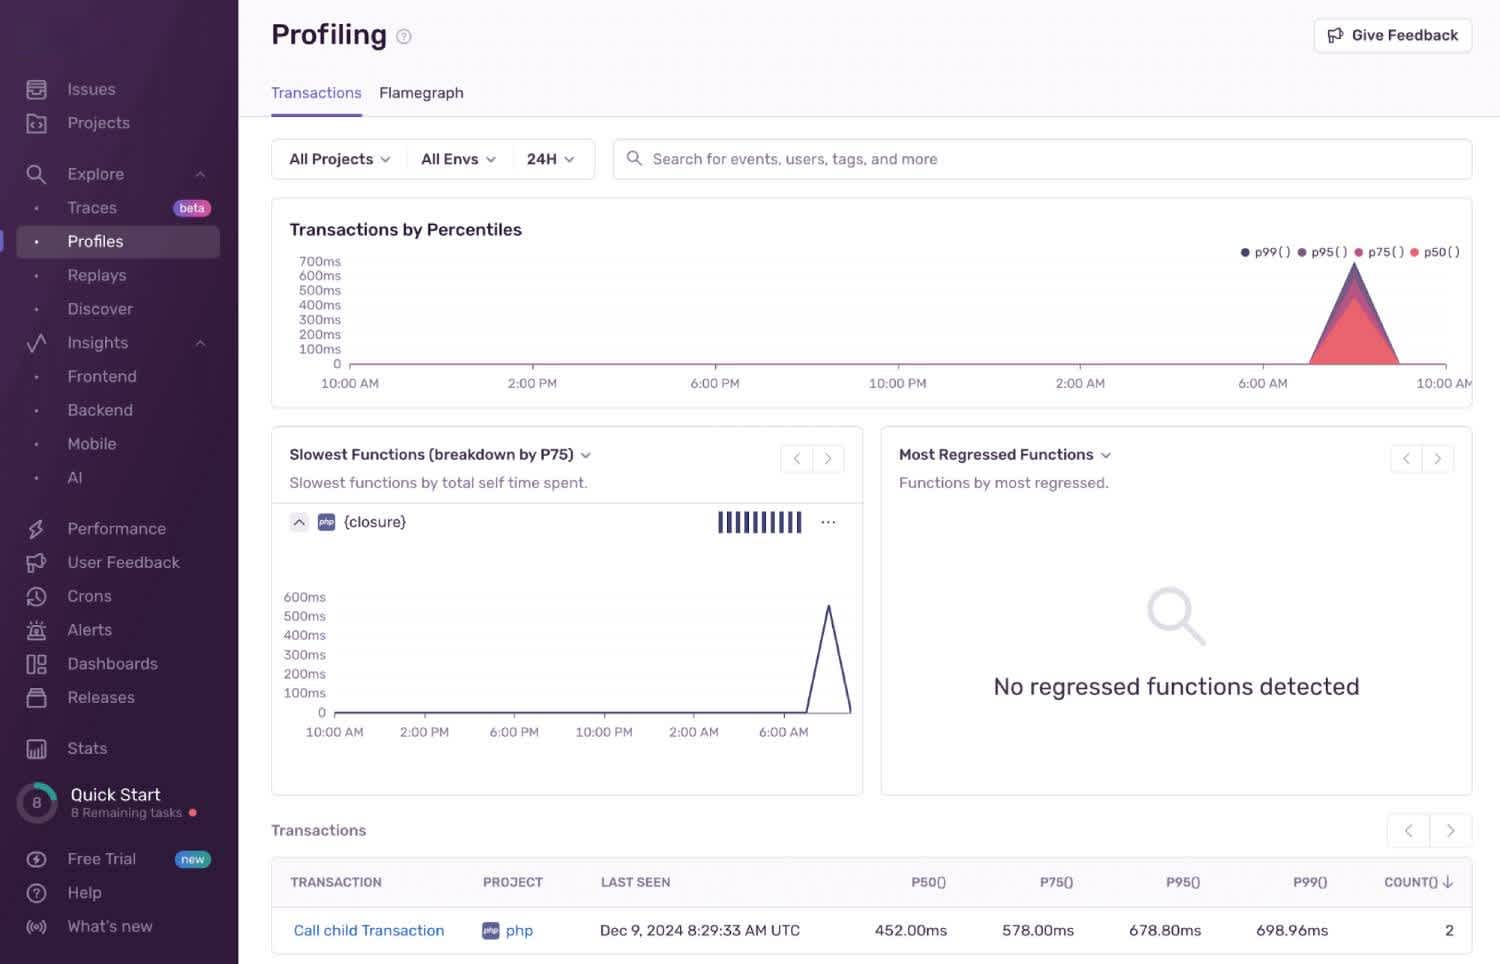
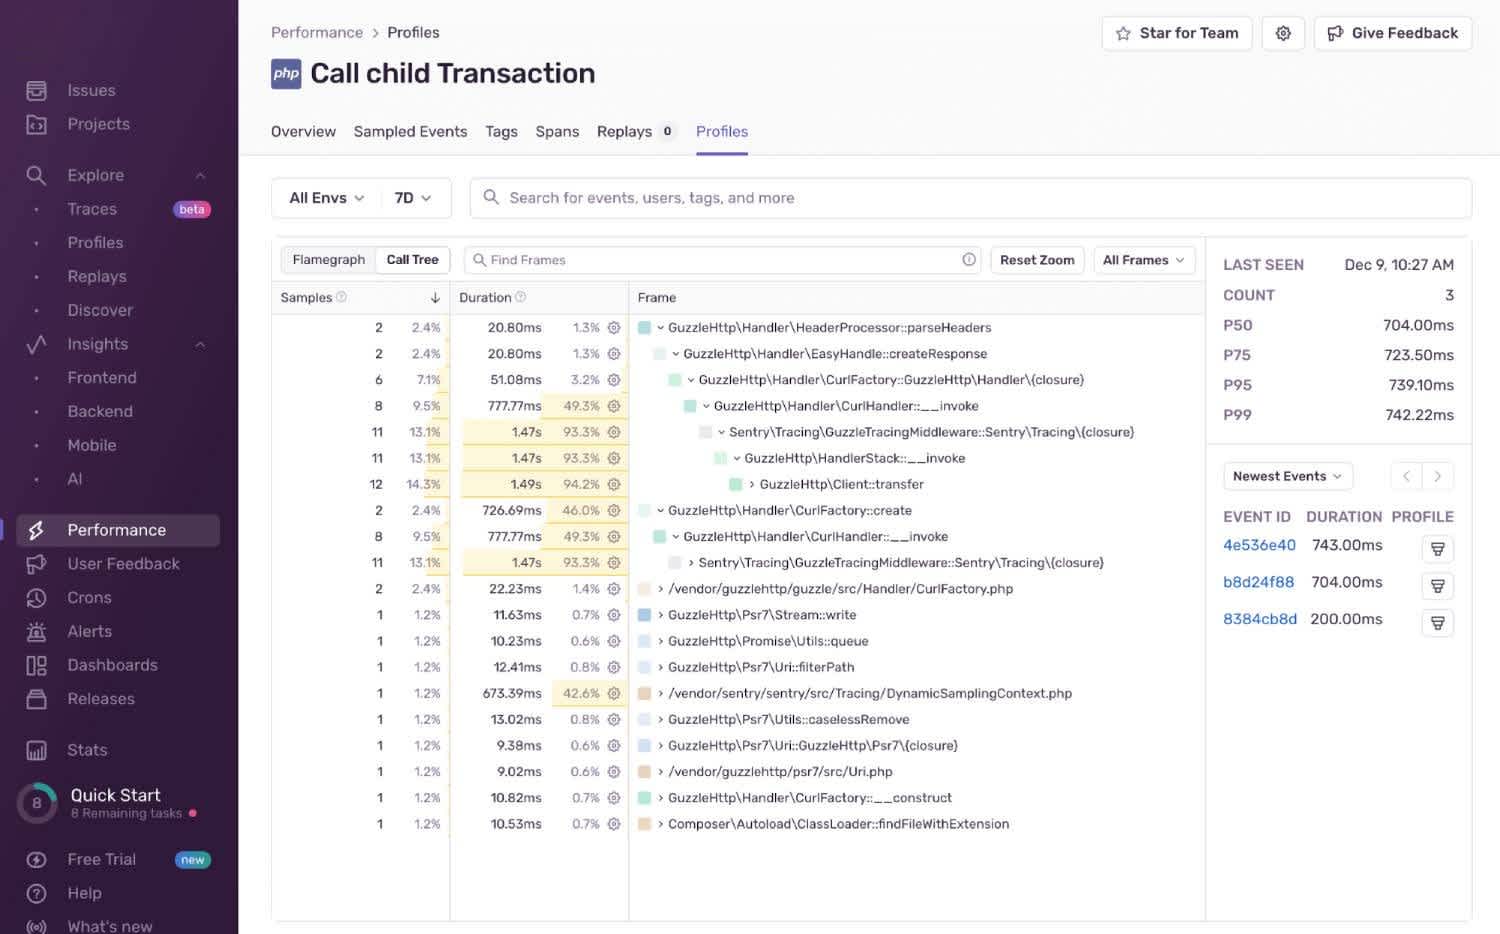
Sentry automatically collects profiling information. To view your app’s performance, browse to Profiles in the Sentry web interface. You can see flame graphs or call trees of any request.
Sentry profiles
Sentry profile
Clean Up
This guide has created several Docker components on your computer. If you want to delete them, run the commands below.
docker rm jbox phpbox sbox; # remove containers
docker image prune -a; # remove images not used by a container
docker network prune; # remove unused networks
docker buildx prune -f; # clear the build cache
Tips to Improve PHP Performance
In the list of PHP optimizations below, try to implement the easier ideas immediately, and the complex ones (like using Redis) only if you need to.
Language and Parallelization Tips
Use the latest version of PHP and your web server. Each new version often includes all sorts of optimizations that can make your application faster.
For slow long-running functions, you could also move them to asynchronous processing so that they don’t slow your main web server. Do this by moving lengthy jobs (such as uploaded video processing) to a background queue so they don’t monopolize your CPU. Consider using a queue management app like RabbitMQ or Beanstalkd.
Network and Cache Tips
Use a different web server. If you’re using Apache, try changing to Nginx or Caddy. It might not be your code that is slow, but a bottleneck in request handling at the server.
Enable compression on your web server to reduce the data transferred over the network.
Use a content delivery network (CDN) to serve static assets like images, audio, CSS, and JavaScript, instead of serving them from your application server. This will reduce the load on your server, improve load times for users, and reduce your server fees, as static CDNs are much cheaper than dynamic web hosts.
Use Memcached or Redis instead of database or network calls to retrieve frequently used data. In-memory caching apps provide data to your program much faster than accessing disk or remote servers. If you have any data that does not change frequently, can be out of date without causing harm, or needs to be computed before being shown to the user, consider caching it.
Enable OPCache on your production server. OPCache caches the compiled code of your PHP scripts (opcodes) instead of regenerating them on every request.
Use the autoloader. Autoloading classes allow scripts to include other scripts only when necessary. This prevents wasting time loading unused code. It also simplifies programming, as you can instantiate new classes anywhere in your code without explicitly including them. For example:
// autoloader.php
function autoloader($className) {
    $directories = ['classes/Controllers/', 'classes/Models/'];
    foreach ($directories as $directory) {
        $file = $directory . $className . '.php';
        if (file_exists($file)) {
            include $file;
            return;
        }
    }
}
spl_autoload_register('autoloader');

// main.php
require_once 'autoloader.php';
$homeController = new HomeController();
$user = new User();
PHP Language Tips
Minimize the use of global variables. Accessing global variables is slower than local variables. Local variables are also removed by the garbage collector when a function ends, reducing RAM use.
Use single-quote instead of double-quote strings. PHP doesn’t spend any time parsing a single-quote string to find variables to replace, and treats the single-quote string as a literal.
Use
isset()instead ofarray_key_exists()for very large arrays. Theisset()function is built into PHP rather than a regular function, so it’s faster to call. But only slightly faster, so you won’t see a difference unless you’re working with long arrays.Use
fopen(),fread(), andfclose()instead offile_get_contents()to process large files. Thefile_get_contents()function reads the entire file at once, which can be slow and uses a lot of RAM for big files.Use native string functions instead of regular expressions. Use regular expressions only when functions like
strpos(),substr(),strlen(),str_replace(), and others can’t solve your problem. Regular expressions are much slower.Use native PHP functions instead of writing your own. PHP functions are implemented in C and so will run faster than trying to write your own code for tasks like merging, sorting, and joining.
Don’t use magic methods (object lifecycle methods). These are methods in PHP that begin with underscores, like
__destruct(), and are slower than writing your own explicit methods to edit objects. For instance, instead of using__destruct()to force the garbage collector to run your cleanup code, write aclose()method for an object yourself and call it after you no longer need the object.Use
unset()on large variables that you no longer need inside a long-running function. The variables will be marked as deletable next time the garbage collector runs, saving memory and possibly time.Don’t use
eval()to create dynamic functions unless there is no alternative. It’s much slower than normal PHP code, which gets compiled and cached.
General Tips
Optimize database queries. Make your SQL code as short as possible, use indexes, and avoid running unnecessary queries.
Turn off unnecessary debugging code in production, such as unnecessary logging, performance profiling code, database query logging, and memory usage tracking.
Remember that a CPU can’t run faster, it can only run fewer tasks for a shorter time. So whenever you examine your code trying to find a way to speed it up, always ask: How can I make this simpler, so it runs with fewer iterations but still produces the same result?
Next Steps
To learn more about error detection and notification in PHP, read our guide to logging and debugging in PHP.
To learn more about how Sentry helps you debug, read our guides to tracing and profiling.

