How Slow is Slow?
How Slow is Slow?


Slow is the new downtime. What you once feared from a downed website — decreased conversion rates, lower page ranks, abandoned carts — now applies to a slow-loading experience.
Problem is, slow is more nuanced than downtime; that is, while downtime is binary — the site’s either up or it isn’t — slow is in the eye of its beholder. It’s why asking what makes a slow website gets the same shrug from a developer as asking them how long an afternoon is.
And when slow lacks a standard, debugging becomes difficult. By now you’re familiar with the usual suggestions toward fixing a slow website: cleaner code, compressed images, enable caching. But this slapdash approach leads to the worst kind of collaboration: a huddle of developers muttering “Did that work?” around a monitor.
Finally Defining Slow
With Google’s recent release of Web Vitals, we now have a uniform definition of slow: a p75(LCP) over 4 seconds. Let’s break that down.
P75 is a threshold metric; that is, it establishes that 75% of your site’s transactions meet a specific time threshold.
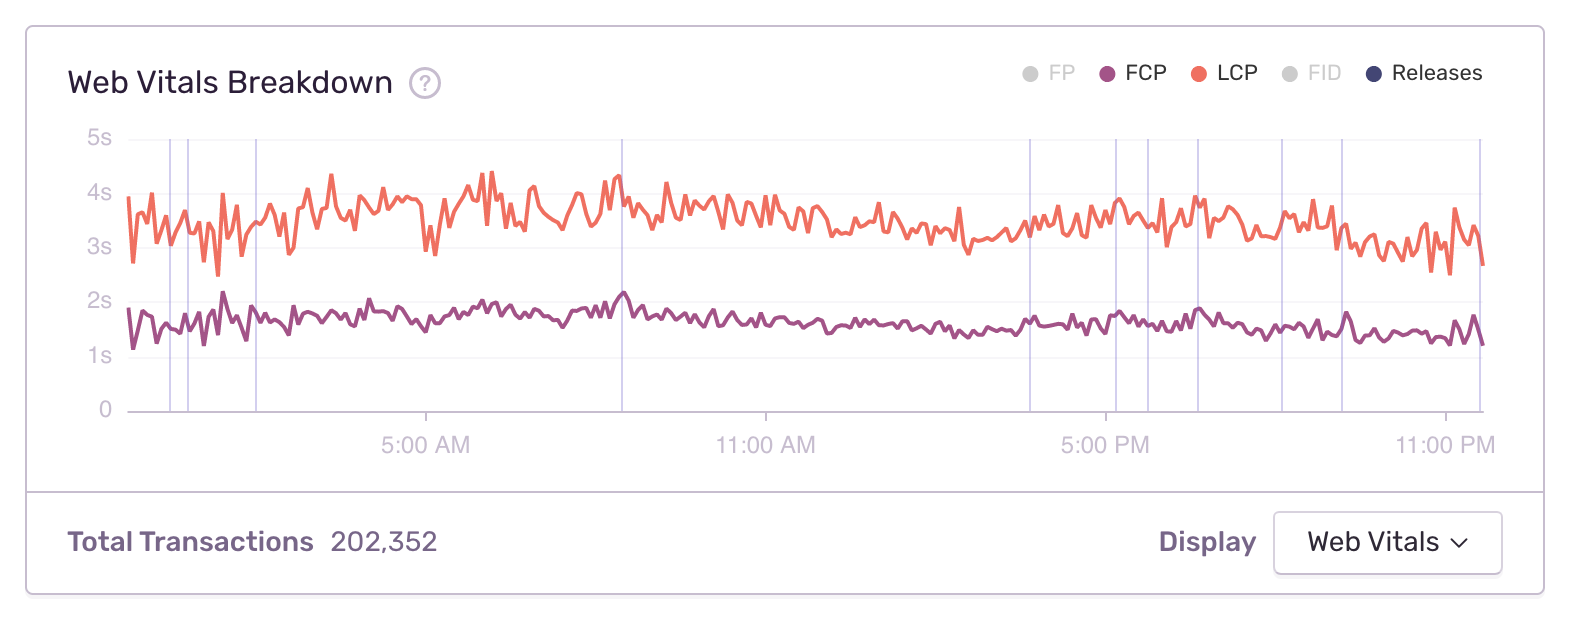
That threshold, LCP, stands for Largest Contentful Paint. It measures the time it takes to load your largest element (e.g. thumbnail graphic, background image, video) from the DOM.
So according to Web Vitals, a performant, well-oiled website means three out of every four users have their LCP loaded in under four seconds. Problem is, without instrumentation, you can’t know which one of those four users is having a slow experience — or the conditions that created their slow experience.
An example: say you receive a support ticket complaining of a slow experience — but your Web Vitals looks to be on point. Responding to this user with the equivalent of “it says here, the LCP is 3.9 seconds” won’t cut it. Which is to say that you need real-time intelligence about a specific user experiencing slow — not just all users broadly.
Performance + Web Vitals: How The Pieces Fit
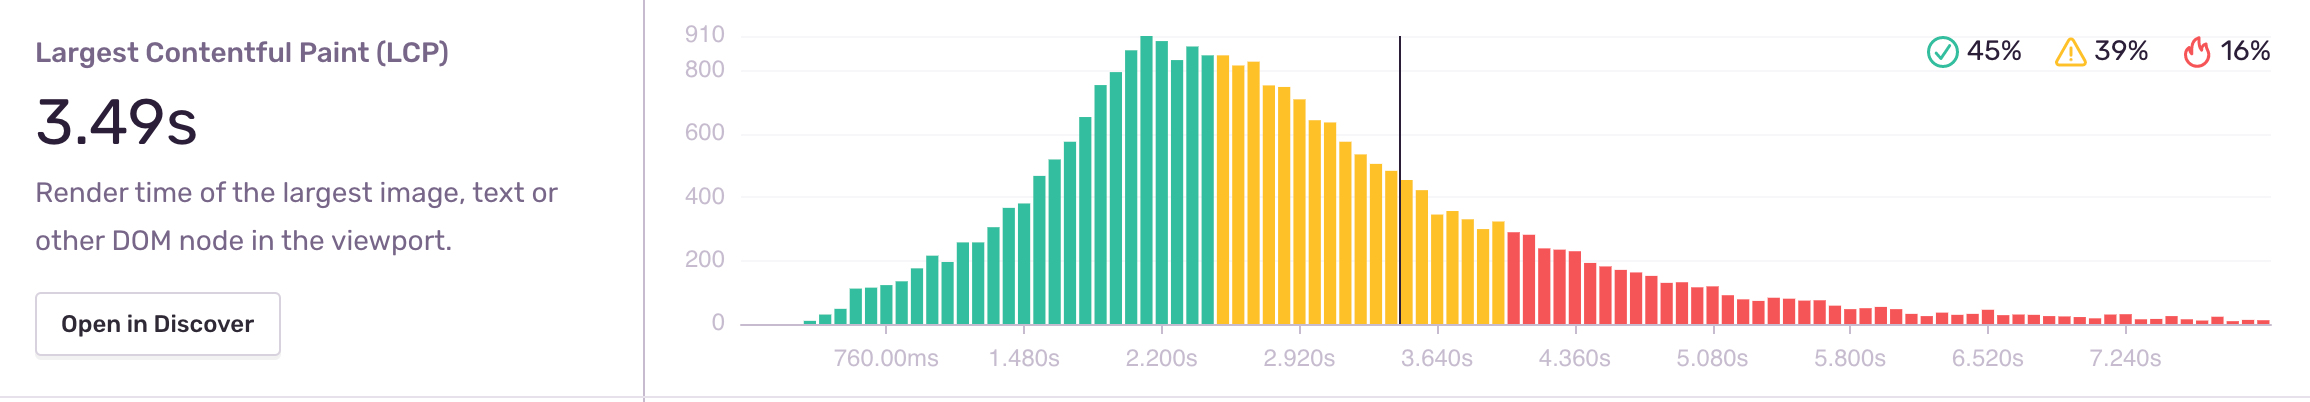
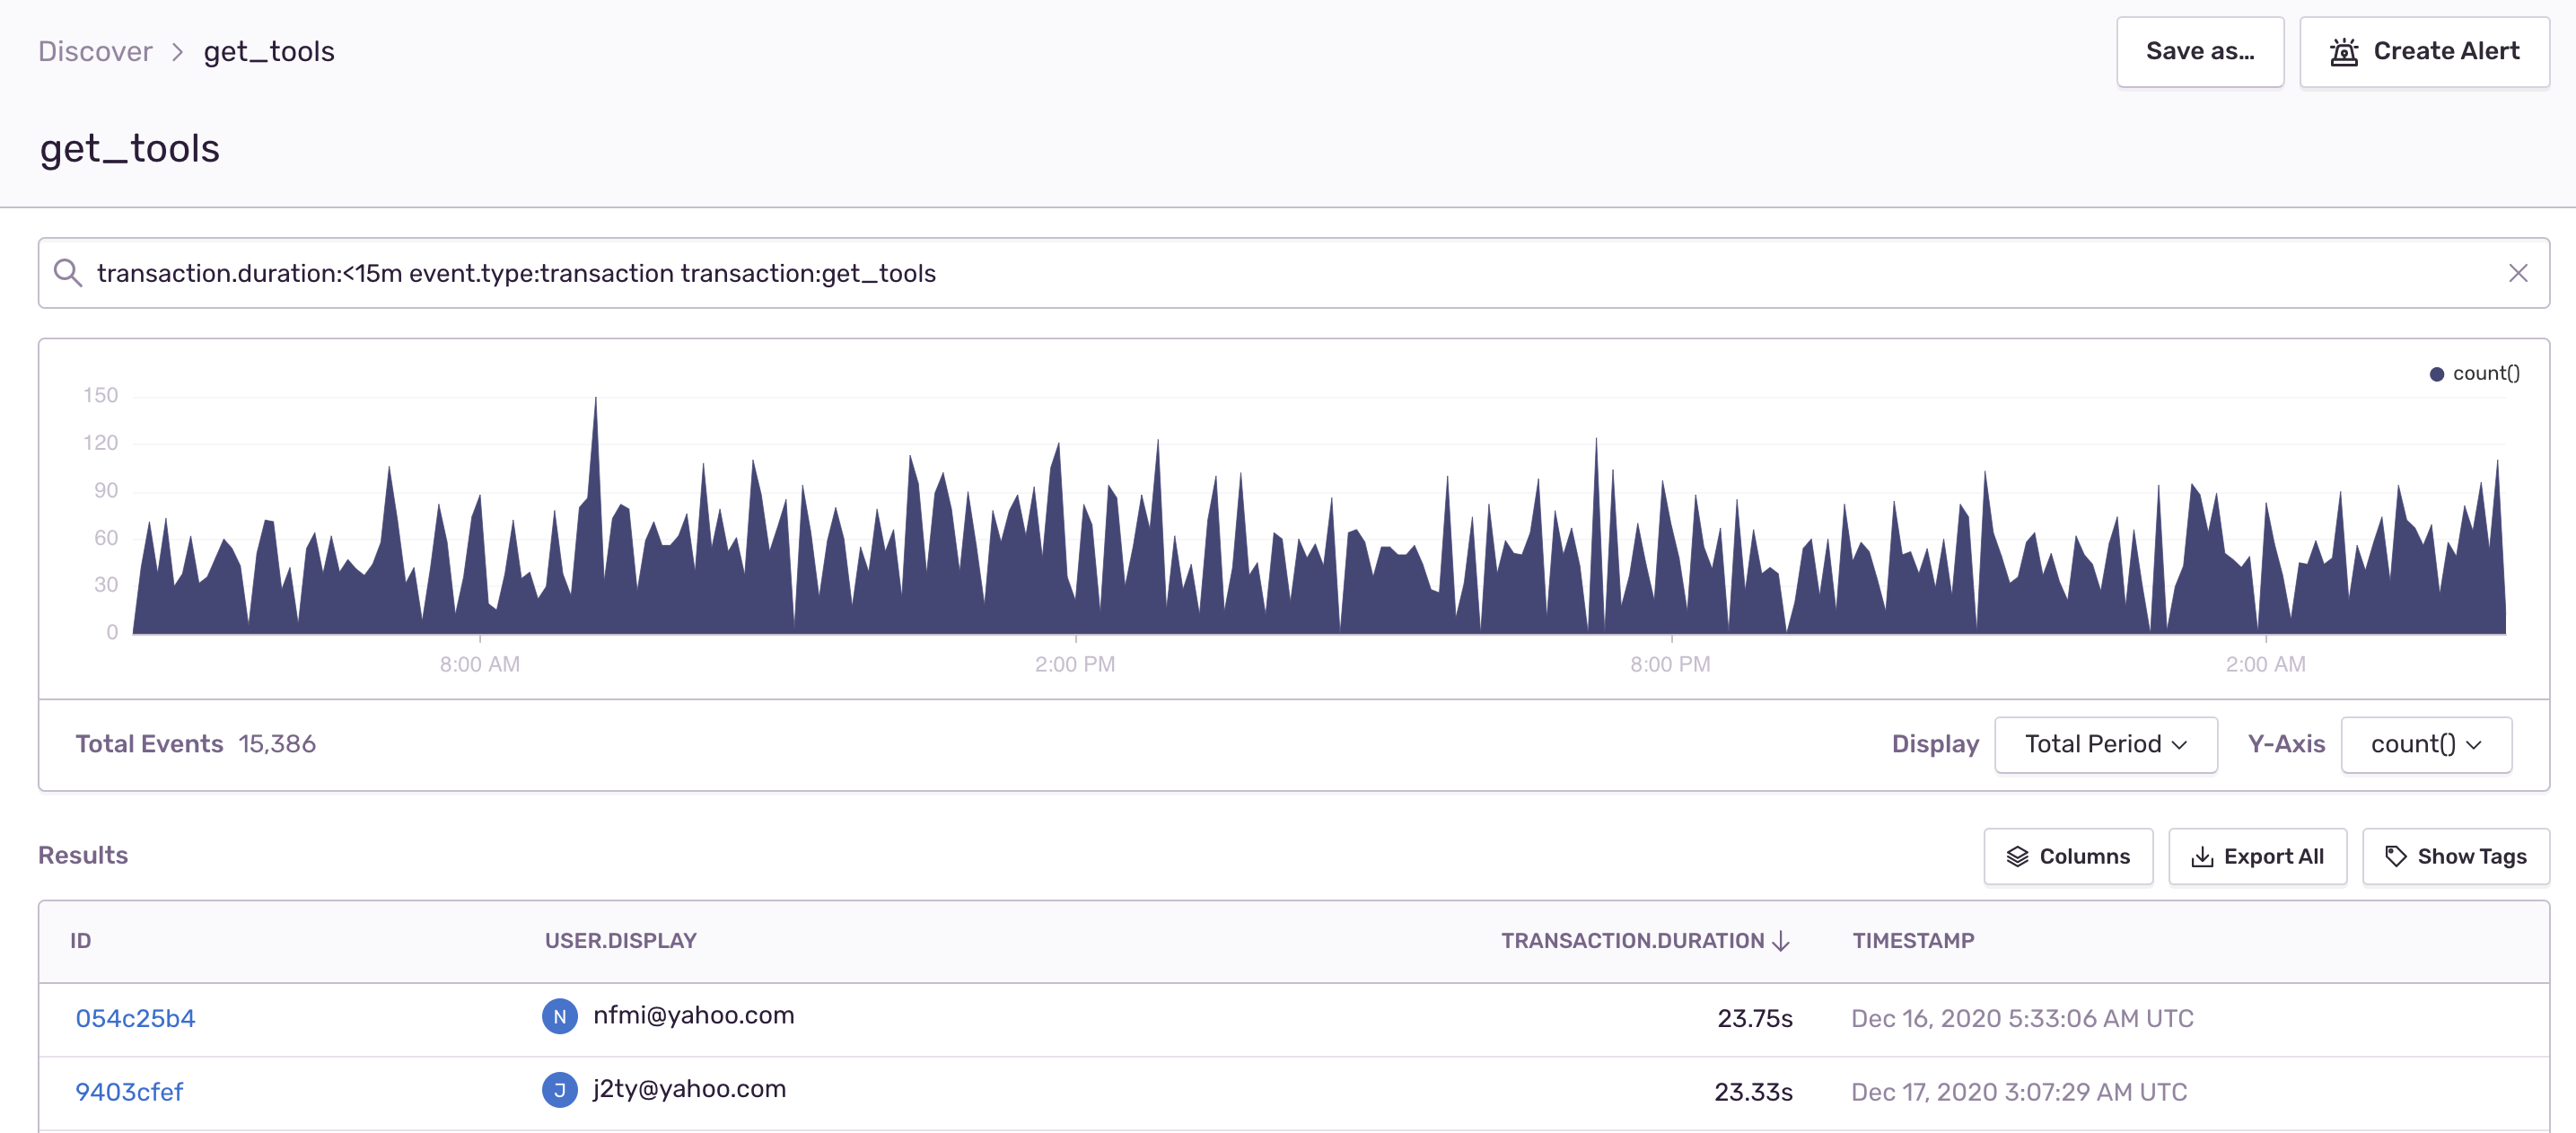
On a macro level, Performance’s Web Vital histograms show you if your transactions are largely passing or failing. But with Performance, you can also visualize specific user transactions by browser, OS, or even the user themselves — so you can see which transactions are slowing their experience down. And you can hone in even further by building a custom query using Discover.
It’s not enough to perceive slow — you need to prove it. That starts with Web Vitals replacing your best guess on slow with an actual benchmark. And by instrumenting Web Vitals with Performance, you can finally shine a light on your user’s experience so that fixing slow will no longer be a shot in the dark.


