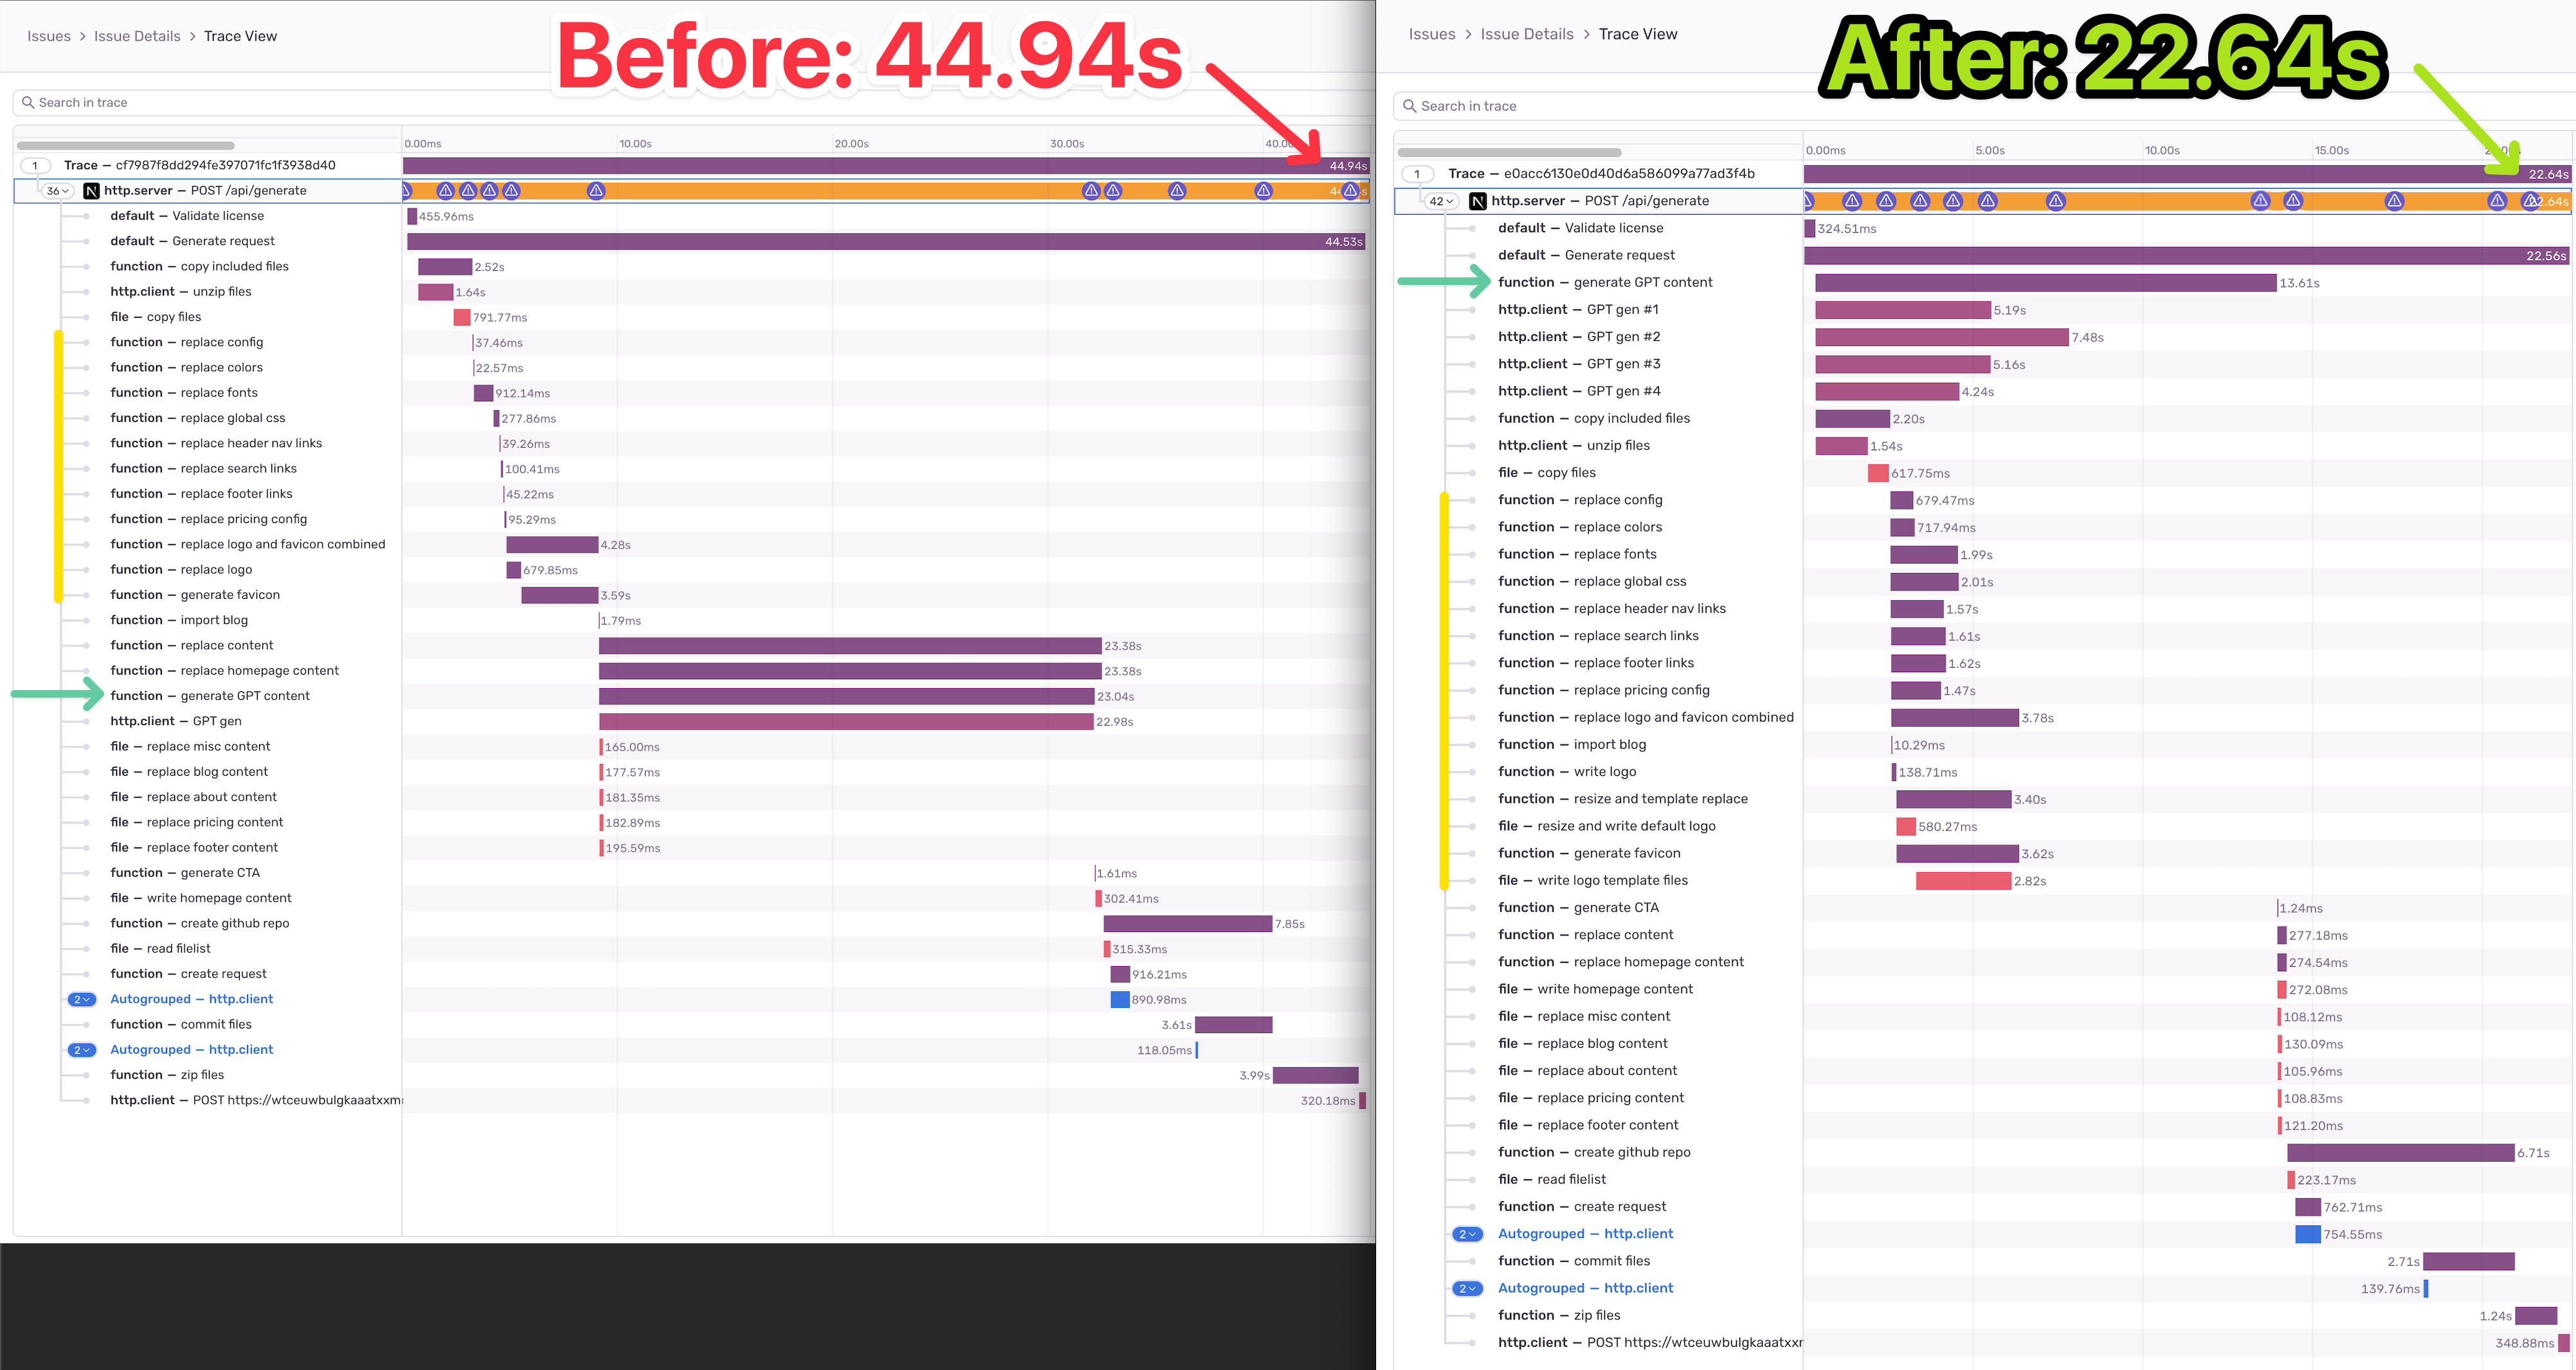
How I cut 22.3 seconds off an API Call using Trace View
How I cut 22.3 seconds off an API Call using Trace View
Dan Mindru is a Frontend Developer and Designer who is also the co-host of the Morning Maker Show. Dan is currently developing a number of applications including PageUI, Clobbr, and CronTool.
As a developer, few things are more frustrating than an API that's slower than molasses. You know the code works, but you know it can’t possibly be a good user experience anymore. I had one of those and looked the other way for a couple of weeks. However, some issues become personal after a while.
The problem is, I had no idea where to start. That’s until I discovered Sentry’s new Trace View. Of course, tracing is what I needed to be able to get to the root causes of my slower performance. So, let me tell you how I shaved off 22.3s of load time from my API call with this one trick Trace View.
I’ll go over all the details in this post and show you how to use tracing to find bottlenecks in your own API calls. Hopefully, you’ll end up shaving off a few seconds of response time yourself. Let’s go!
What’s a Trace View and why does Sentry have it?
Most people know Sentry for their error monitoring capabilities. But it’s so much more than that. In fact, Sentry can also help you find performance bottlenecks, among other things!
I mentioned how easy it is to set up Sentry before ― you should be up and running in about 5 minutes. After that, Sentry will also collect performance metrics for you.
The Trace View is an integral part of that and it shows a waterfall-like visualization of transactions and spans. As you can imagine, this helps identify delays, related errors, and bottlenecks affecting application performance.
Next, I’ll show you how I set this up for my use case.
Fun fact, Sentry saved $160k/year by dogfooding their own performance metric features.
Setting up the Trace View for file I/O
The endpoint I’ve been debugging is not your average bottleneck. It involves a long series of HTTP calls, file I/O, third-party calls (AI generation), and finally, a couple of DB queries to round it off.
The endpoint in question was for an app called Shipixen, which can generate an entire codebase, repository, content and even deploy it for you to Vercel.
As you can see, it’s not your usual CRUD endpoint. This situation is common for endpoints that keep growing in features month after month without measuring their impact.
Call it a final endpoint boss if you will.
Understanding the issue at hand
The only thing I knew was all steps in this request were necessary. I’ve flirted with making it a background job, breaking it up into queues and applying other architecture backflips, but the fact of the matter is this:
the user only gets a benefit once all tasks are complete
the user is king/queen; and they do not care about my architecture
I need to get my act together and try to half the time it takes to complete the request
Here’s why: I have 44.94 reasons why.
Sorry, I meant 44.94 seconds. Or however long it took to complete this request in an average scenario.
I quickly put my debugging shoes on and opened up the Trace View. Surprise!

Sentry did a good job detecting network I/O, but all the rest was a black-box. And that makes sense, how could it possibly know it should trace all the various file I/O it was performing?
Let’s ignore the fact that it took 54s now and focus on the issue at hand. I didn’t know what task takes the most time and even more importantly: the order in which the tasks complete.
Setting up custom instrumentation
Luckily, Sentry exposes methods to do custom instrumentation so you can track any operation be it on the filesystem, https or anything in between.
You need to wrap the operation in question in a function call which will create a span. A span is essentially a measurement of time; a thing that happens. I suppose calling it “thing” was a bit more abstract so span it is.
Depending on your language/framework of choice, it’ll look something like this:
const result = await Sentry.startSpan(
{ name: "Important Function" },
async () => {
const res = await doSomethingAsync();
return updateRes(res);
},
);I then started to wrap my methods in spans, and before you know it, the trace viewer looked like this:
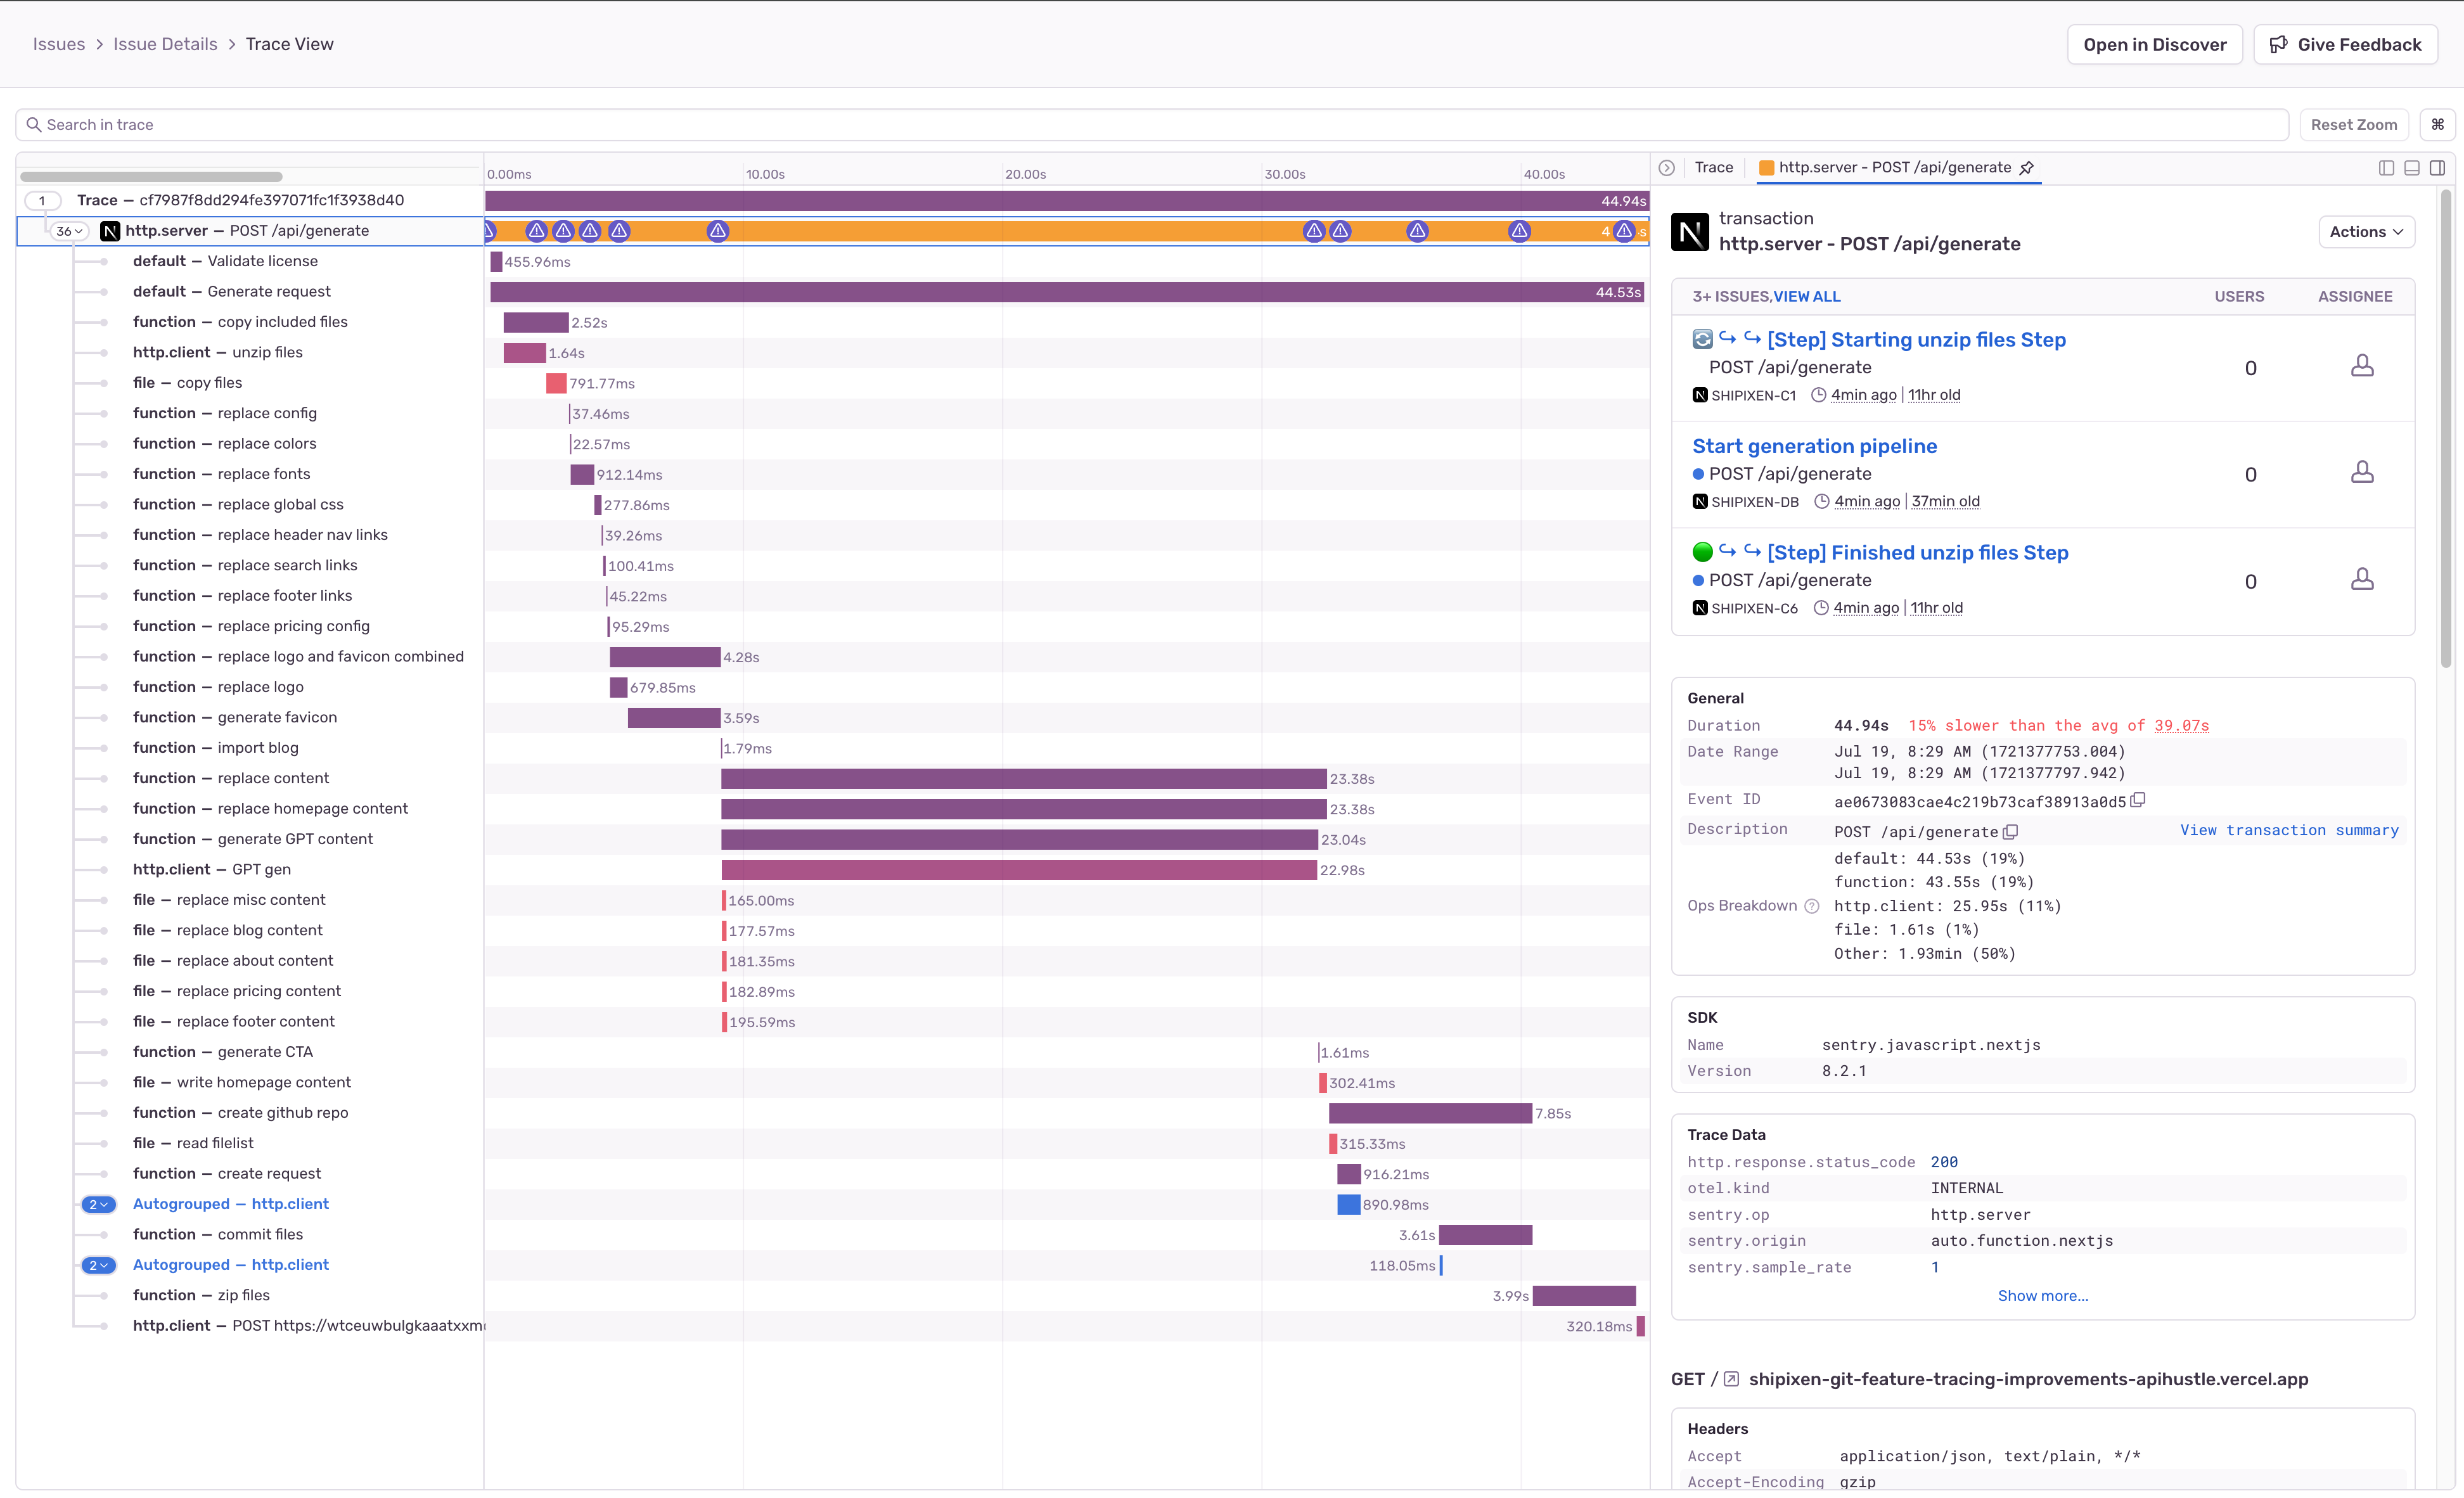
Let’s explore how to identify bottlenecks.
Identifying bottlenecks
Let’s look closely at this view. In general, these are the most common issues to keep an eye out:
Long-Running spans (obviously)
can the payload be reduced?
can it be split into multiple parallel tasks
can it be queued / ran in the background
is there a new API available that might be faster / more efficient
Waterfall spans that wait for each other (that could be parallelized)
Inefficient spans order that have to wait on each other
Dependencies between spans (often code smells)
Slow time to first byte / cold starts on network dependencies
If this was a bingo card, you’d realize I almost won this round upon further inspection. I nearly have all of those. Let’s break them down.
1. Long running spans
Fortunately, there are plenty of them in your implementation, which can be database queries, third-party calls or heavy file I/O. The point is not to get depressed that there are so many, but to pinpoint which ones could be easy wins.
Here’s what I identified, from the top.
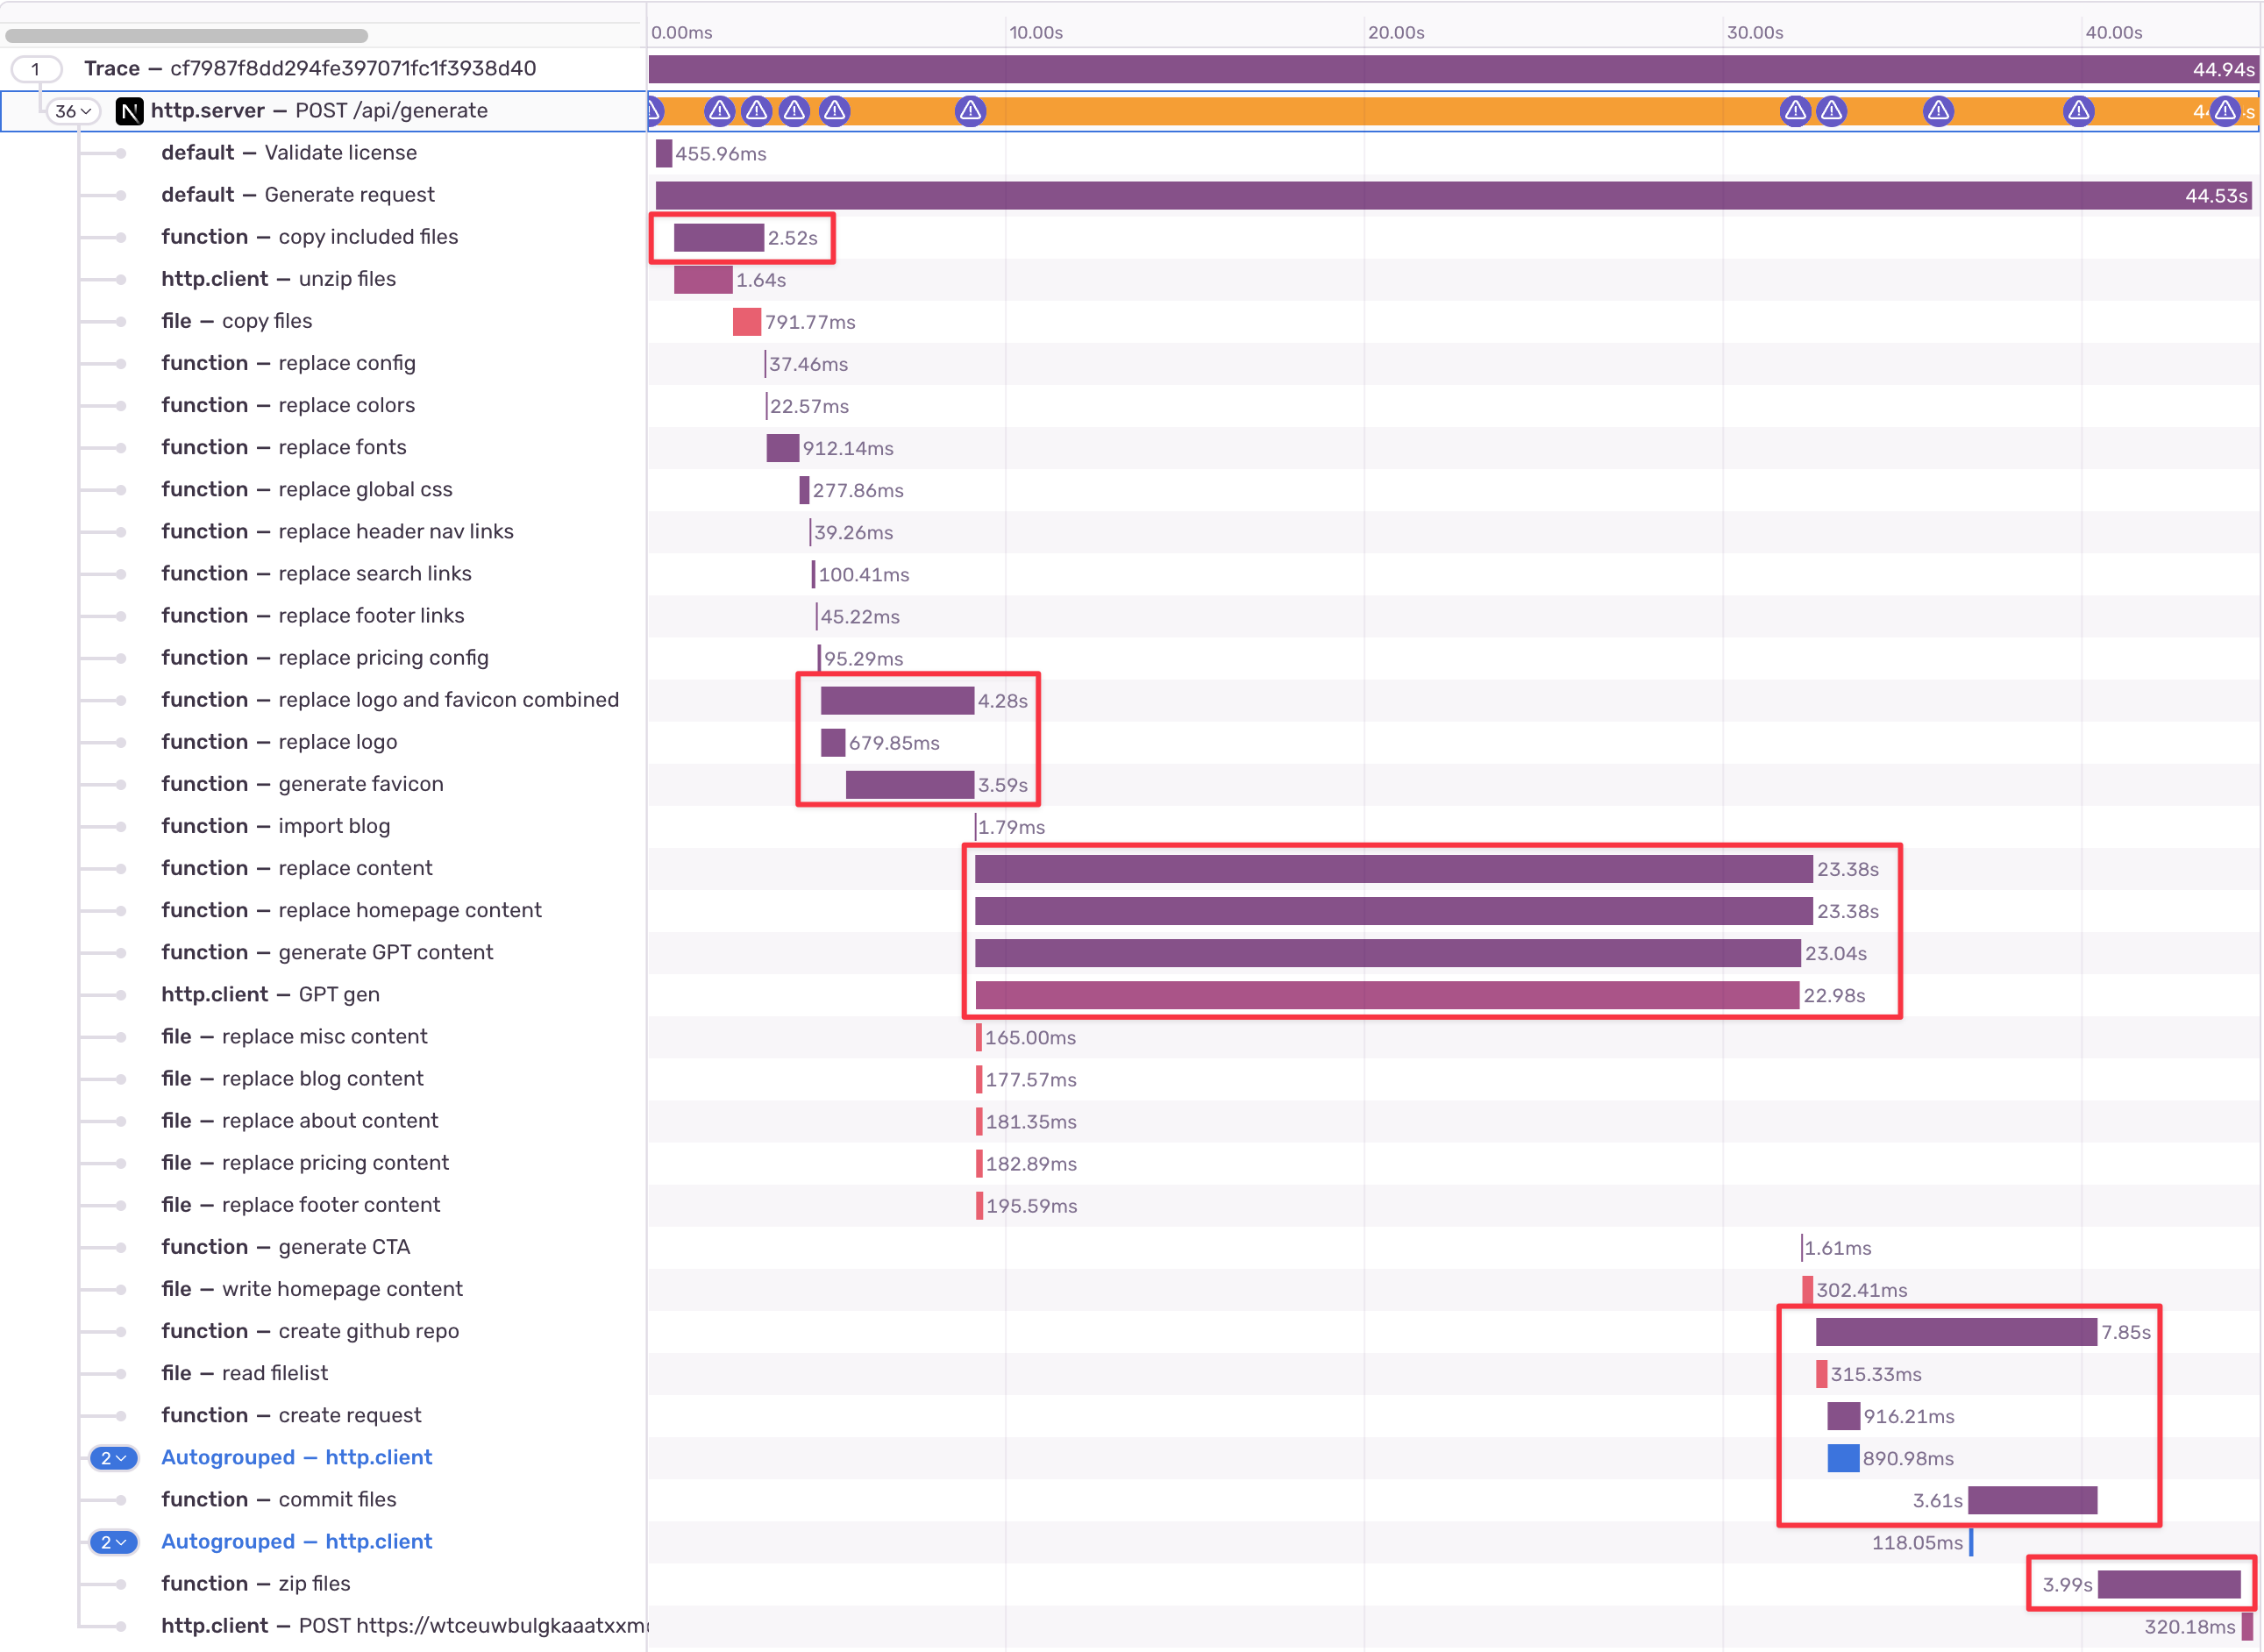
❌ Unzipping (heavy I/O). There is not much to optimize here, except for the size of the zip. Not an easy win.
✅ Image processing. These could run in parallel but run in sequence. There’s clearly a dependency that can probably be easily untangled.
✅ AI generation (3rd party http call). This surely can be optimized: maybe with a different model and/or different sequence. There is no reason to wait almost 8s to fire this off. Should be an easy win.
❌ Repo creation. This can probably be optimized, but it is likely dependent on the unzipping step above & payload size. Also not an easy win.
❌ Zipping (heavy I/O). Same as before, it’s all related to the initial zip size. cannot directly affect this part.
🆗 Querying the database. The DB updates within 300ms so not much to gain by optimizing the query.
Based on this, I picked what seemed to be in the 20% effort / 80% gain category. If this thesis proves to be incorrect, I still have the more difficult spans to optimize (as a plan B).
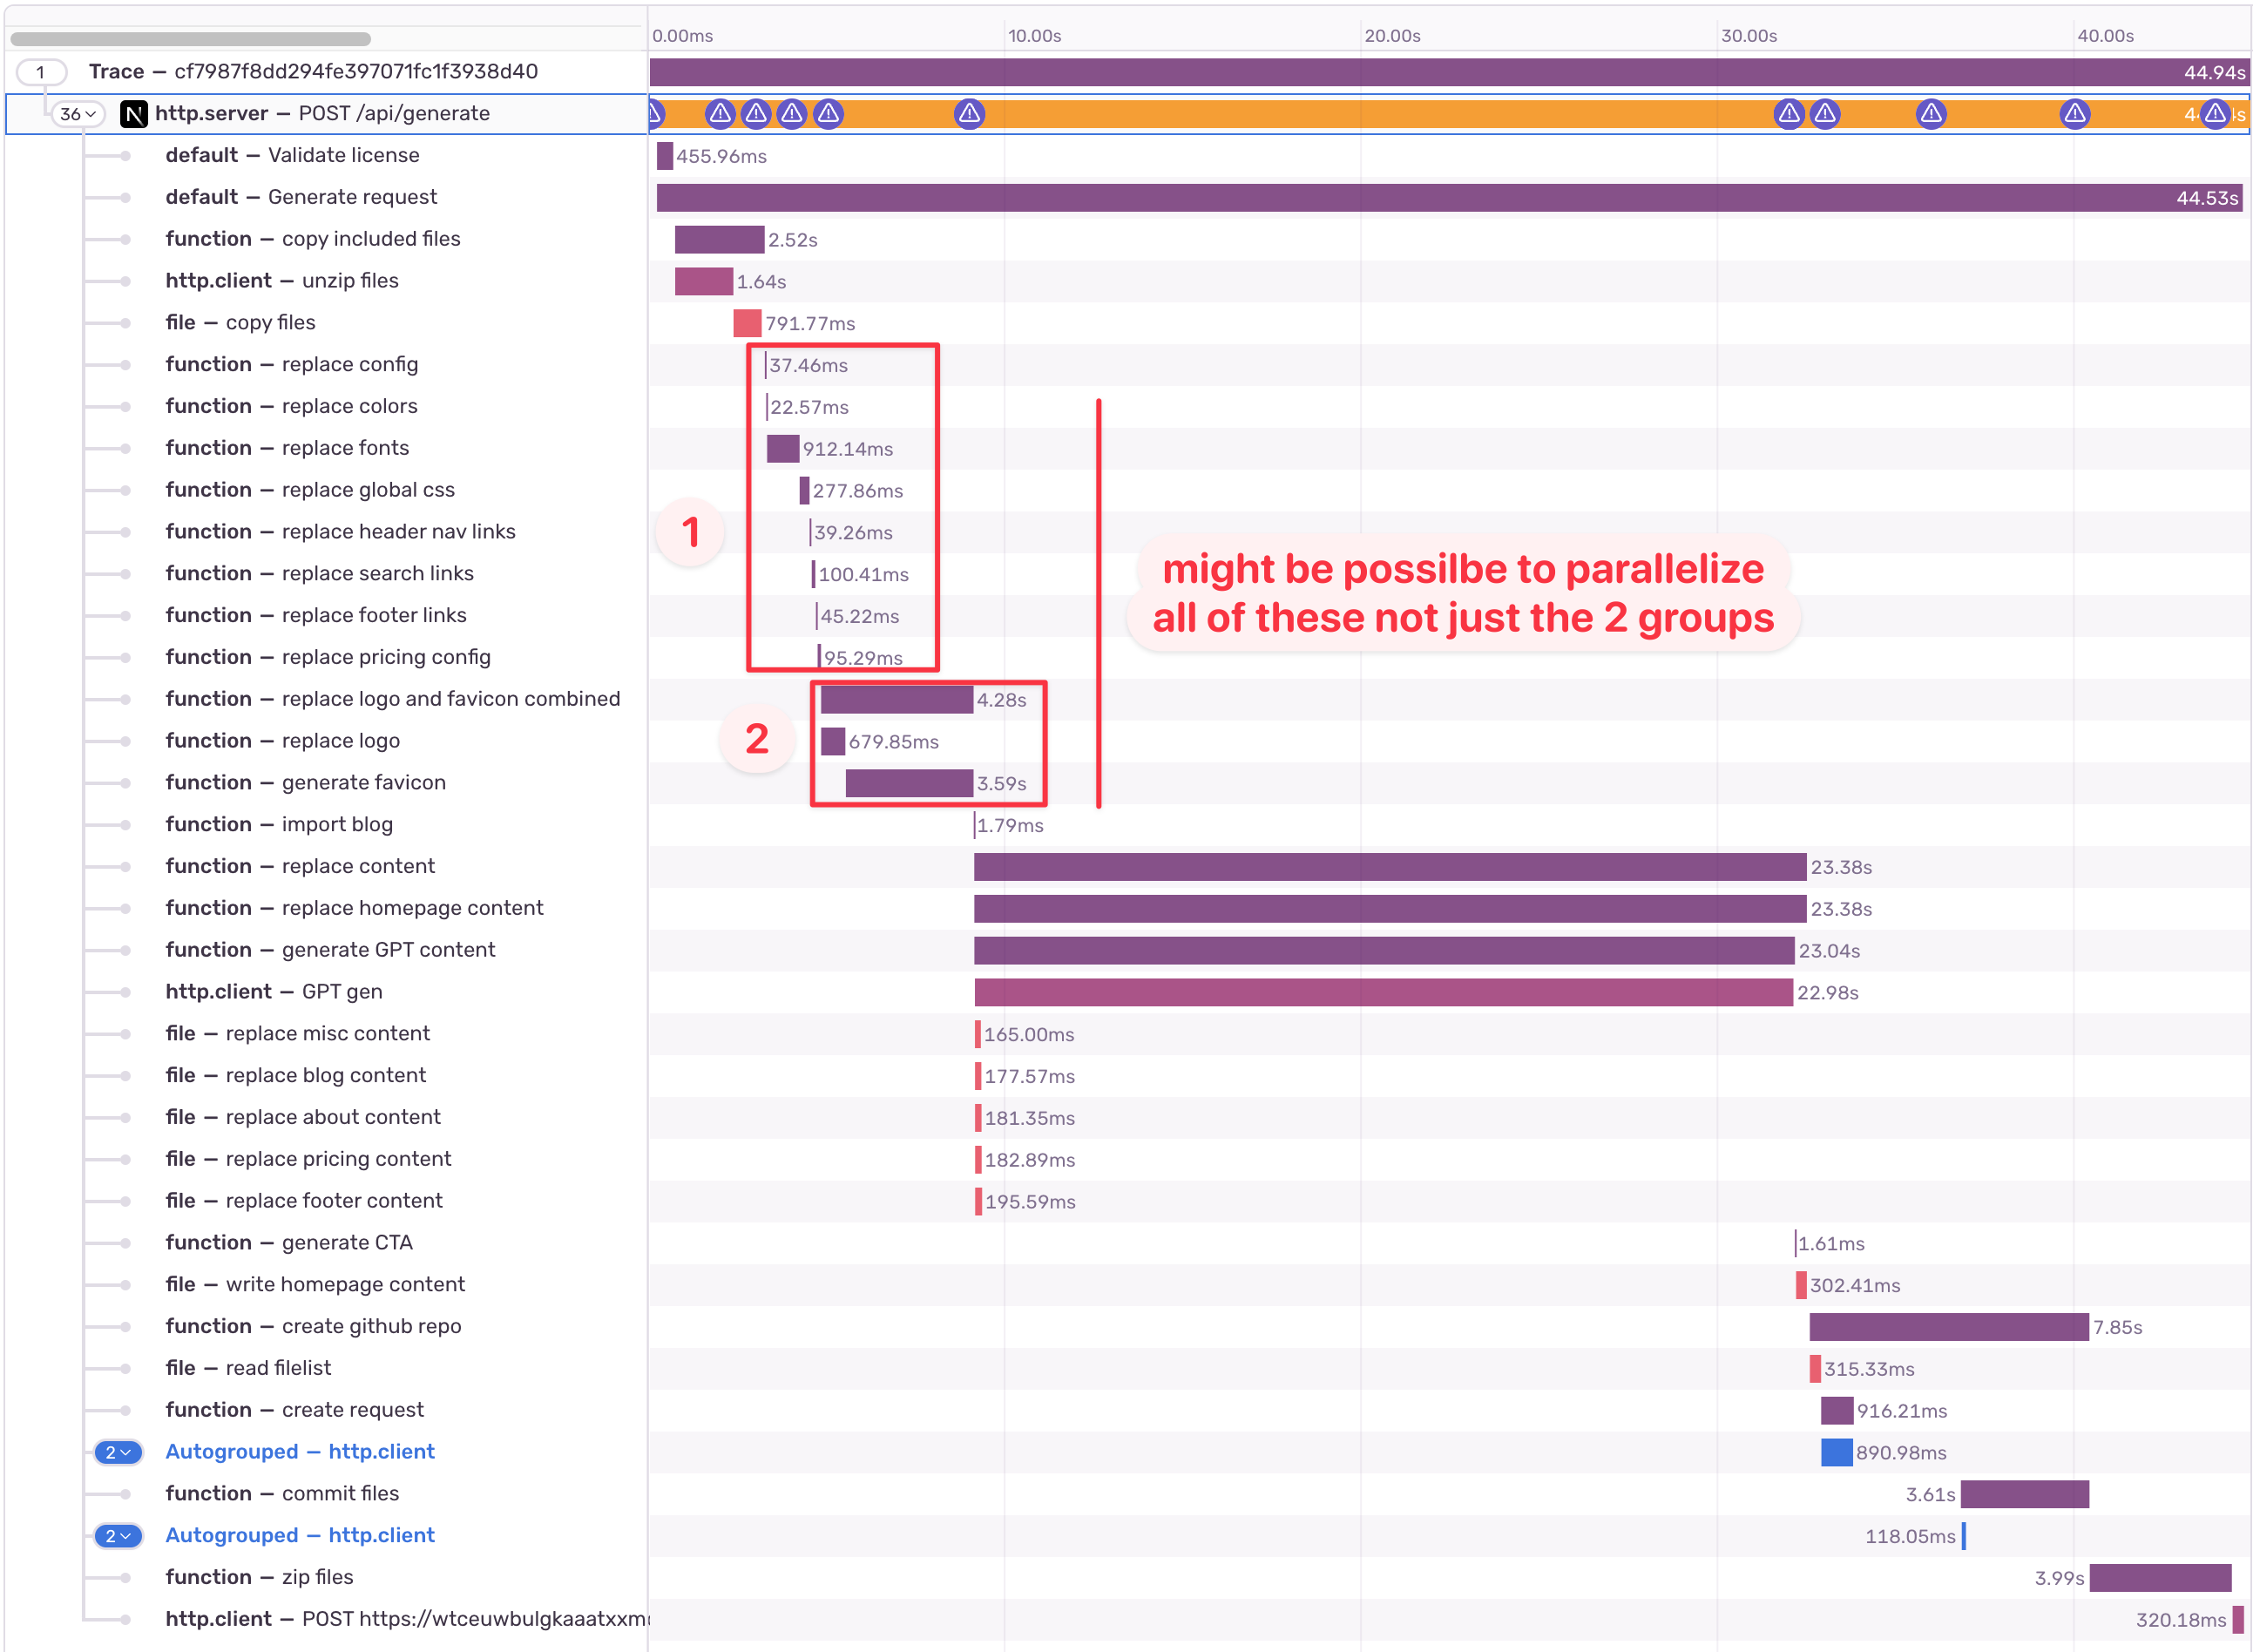
2. Waterfall spans that wait for each other (that could be parallelized)
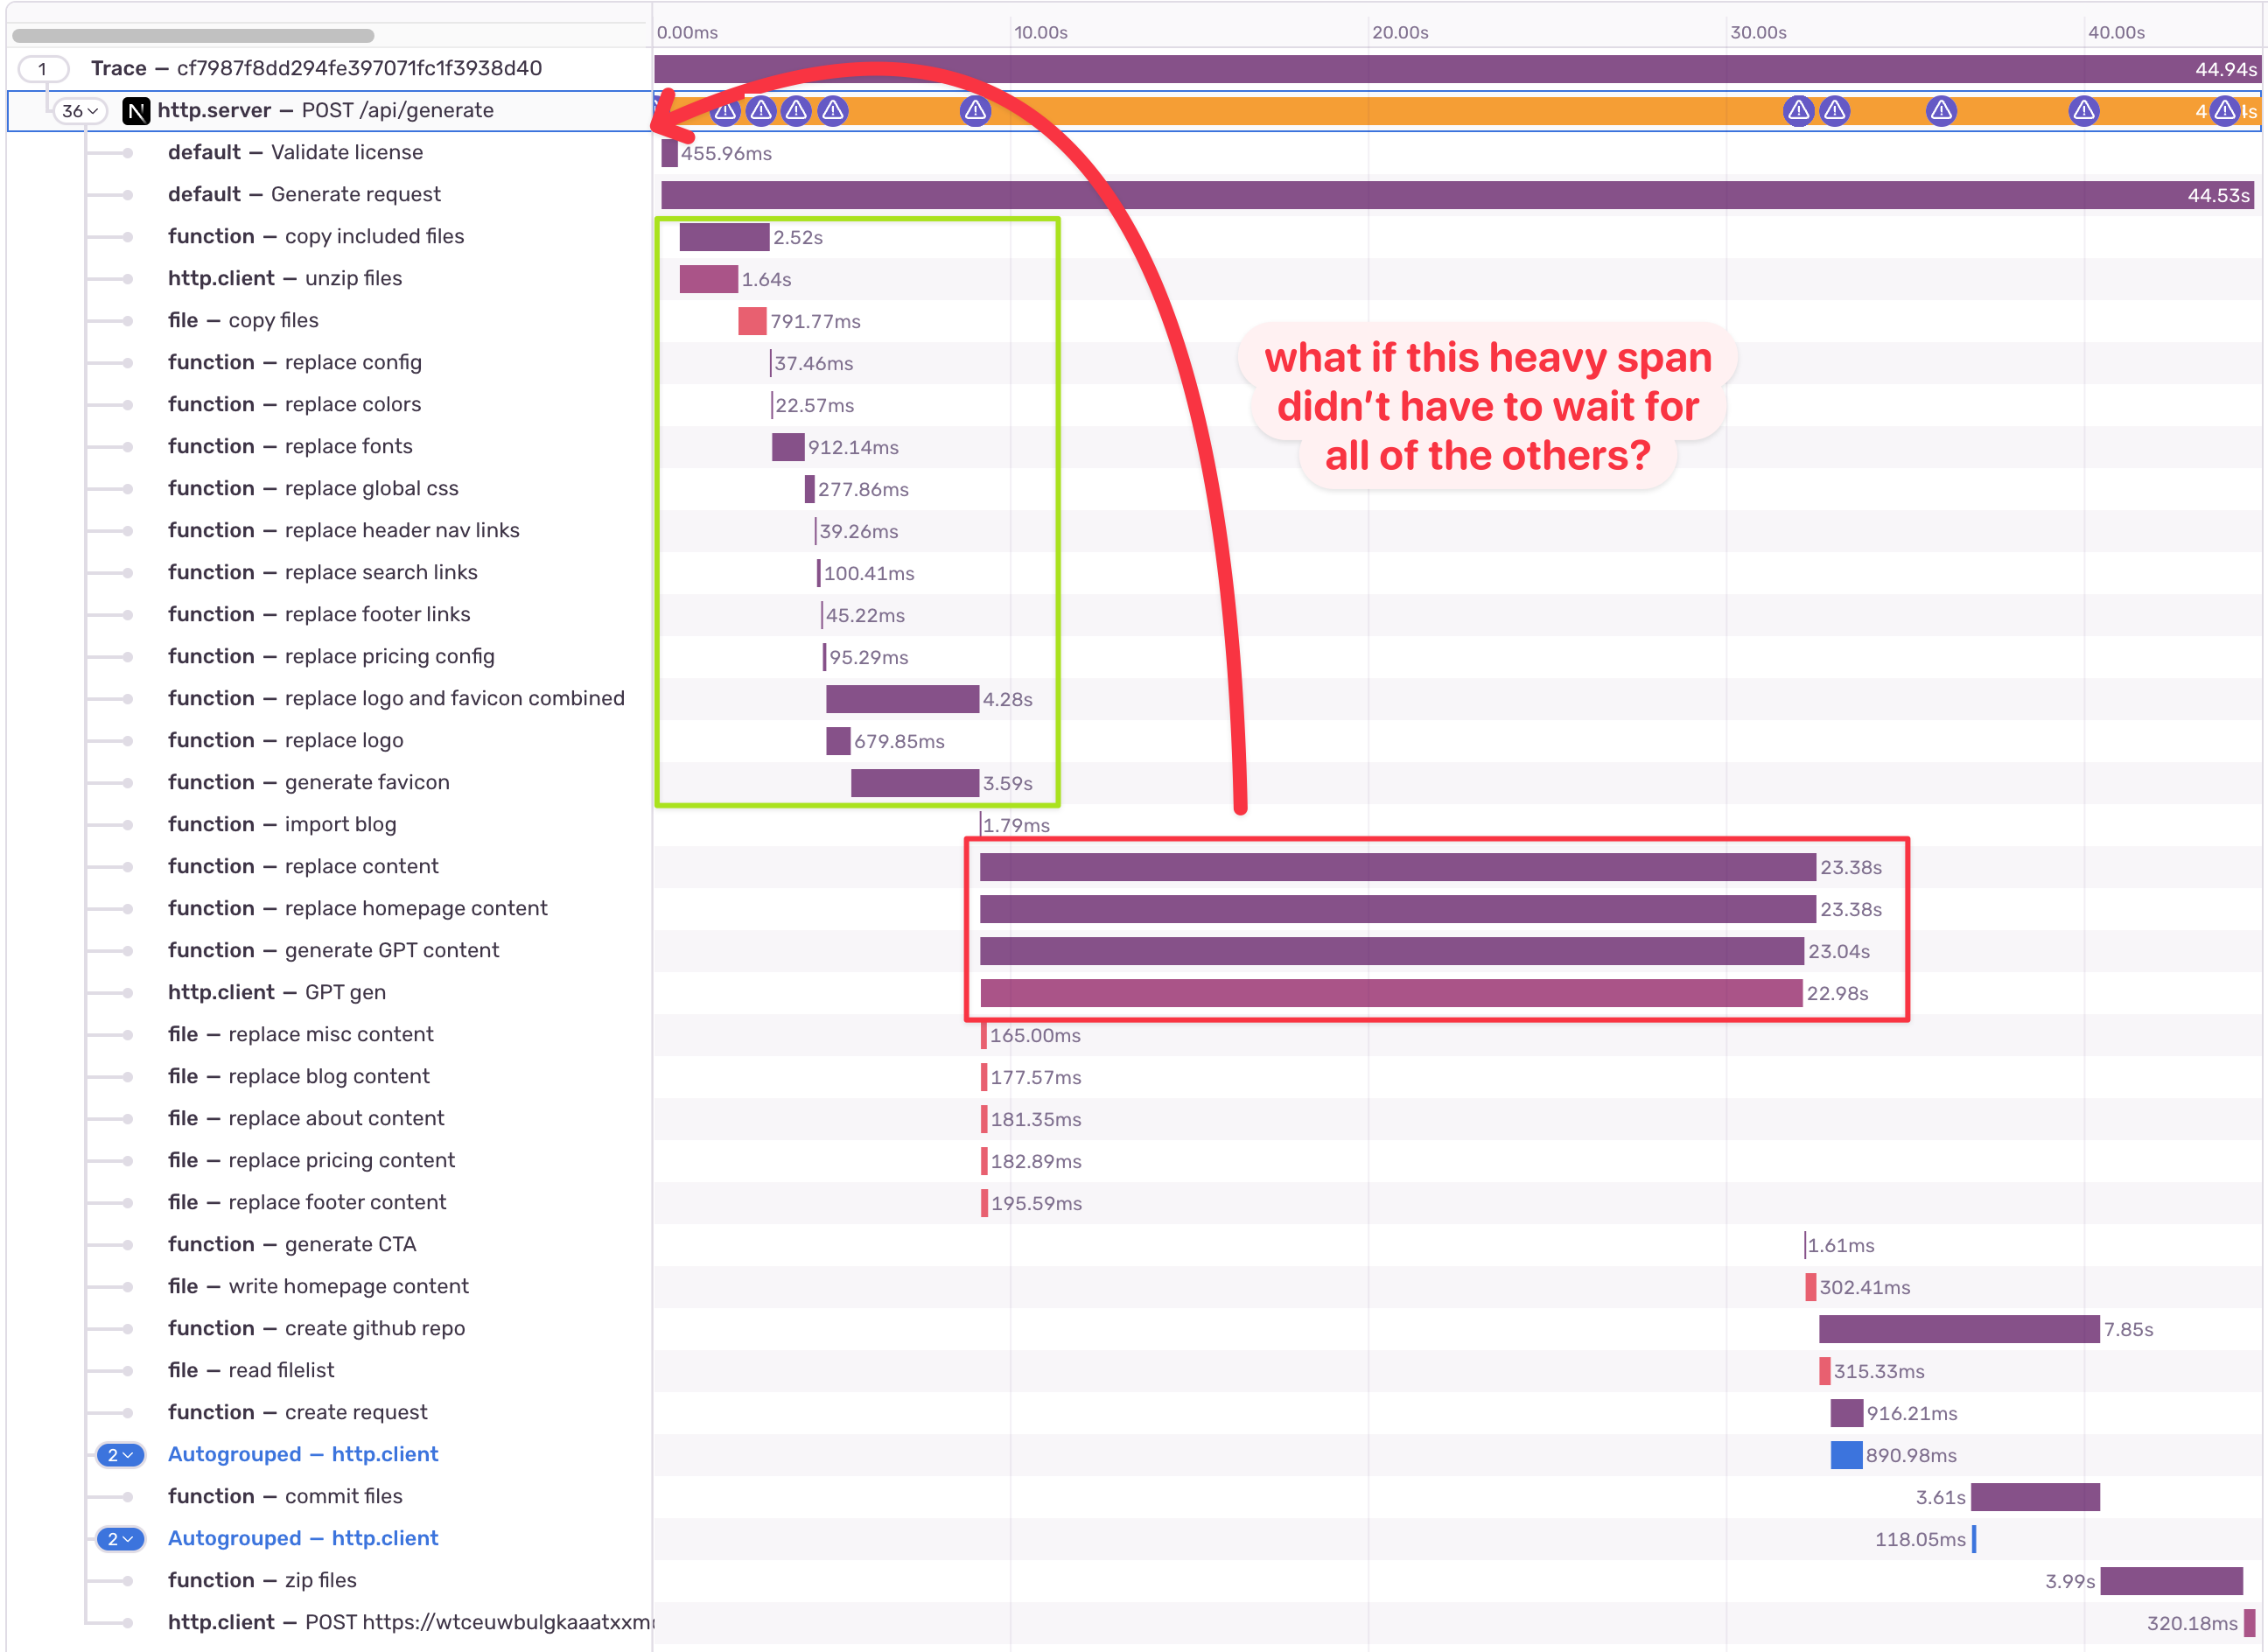
It’s easy to spot a couple groups of spans that clearly wait on each other for no reason.
They can probably easily be parallelized, but this can get a bit tricky.
Sometimes because of resource bottlenecks it can be just as fast to do something in sequence (imagine CPU, memory, write/read speed caps). Still, worth a try.
3. Inefficient spans order that have to wait on each other
This usually requires a bit of out-of-the-box thinking. When you look at dependencies between tasks, is there something that can kick off at request start?
While it’s not always possible, I had a hunch here that the AI generation tasks can be kicked off from the get-go.
4. Dependencies between spans (usually code smells)
Of course, my code doesn’t have any spaghetti and/or smells. But hypothetically, looking out for strange dependencies can reveal there’s some sloppy code that should be rewritten.
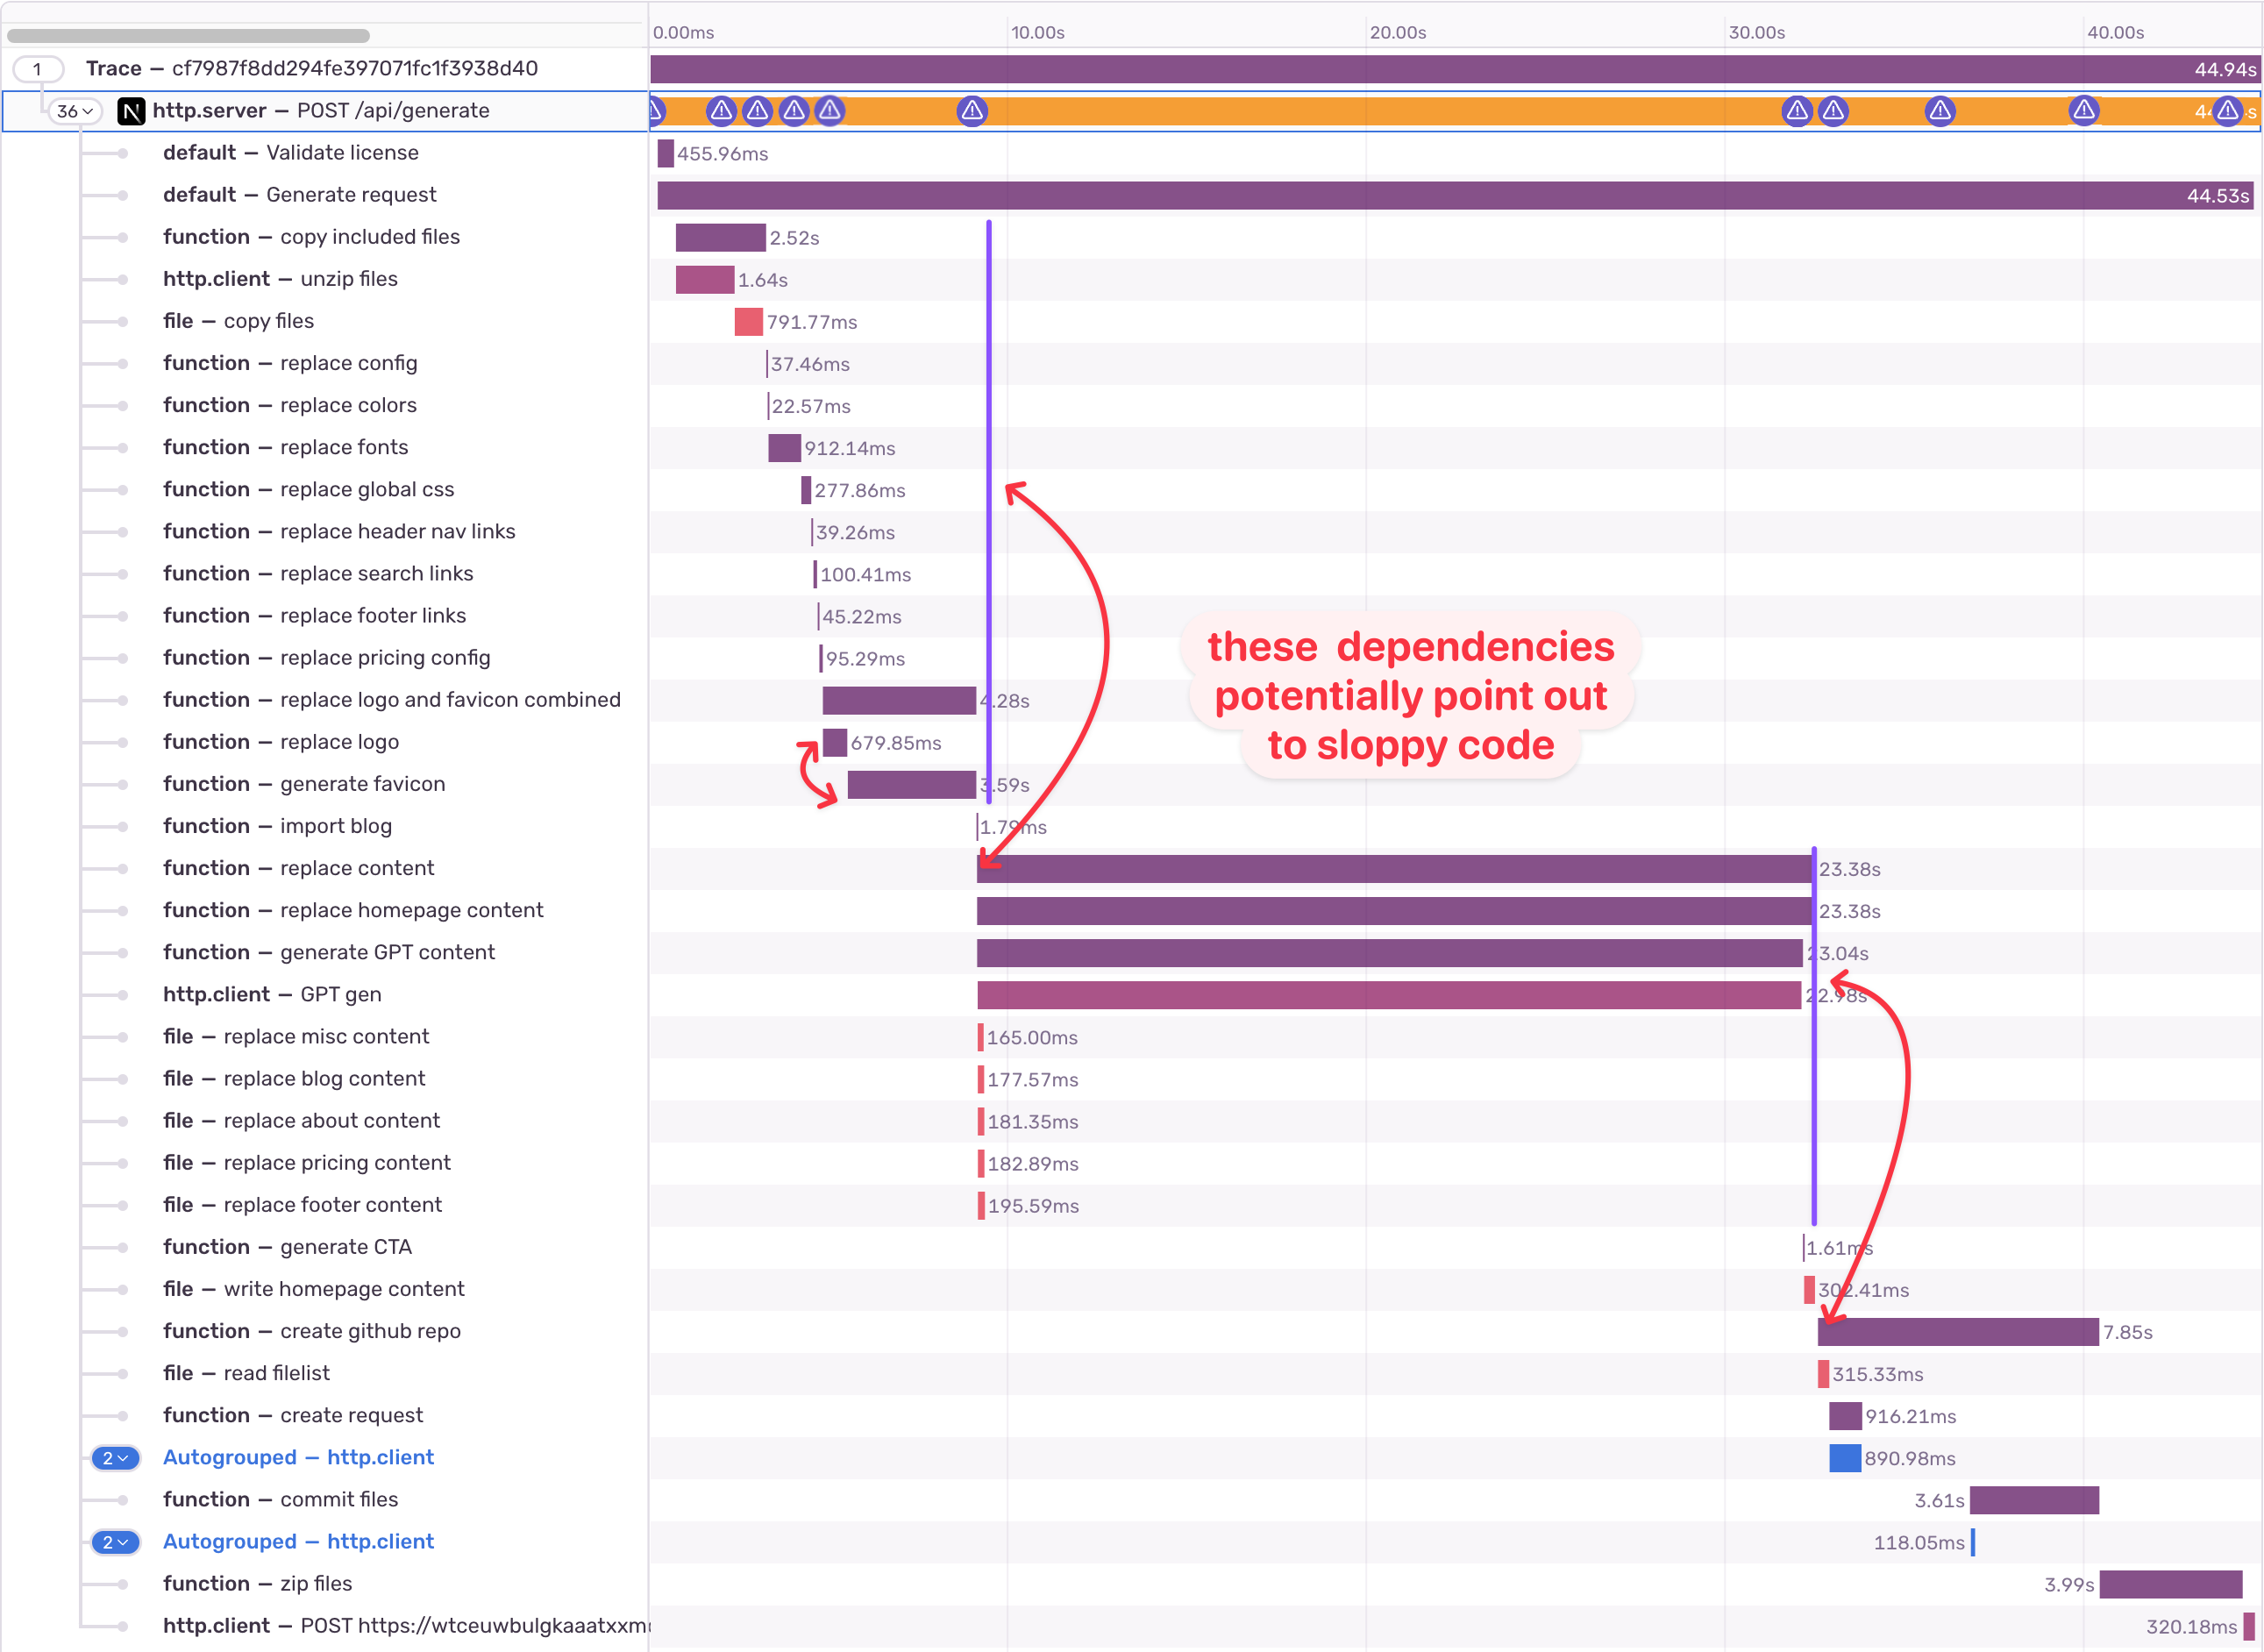
In general, performance optimizations can be a good way to clean up the code and refactor it for the future.
5. Slow time to first byte / cold starts on network dependencies
If you are calling a few microservices this could be a problem and you might want to have an instance on for some of the critical ones. Luckily, I don't seem to have this issue, and coincidentally, it's the only issue I don't have…
Applying performance optimization
Here’s the recipe in a nutshell:
take a baseline measurement
set up a reproducible(ish) example
only apply 1 thing at a time
I won’t take you through all the small steps, but let’s dive into some of the meaningful ones.
Parallelizing decoupled spans [42.48s]
Looking at the code, it was easy to say the initial spans that ran in sequence don’t have any dependencies on each other, except for the image processing part.
It was a relatively small change, and it netted me -5% in speed. Not the worst start.
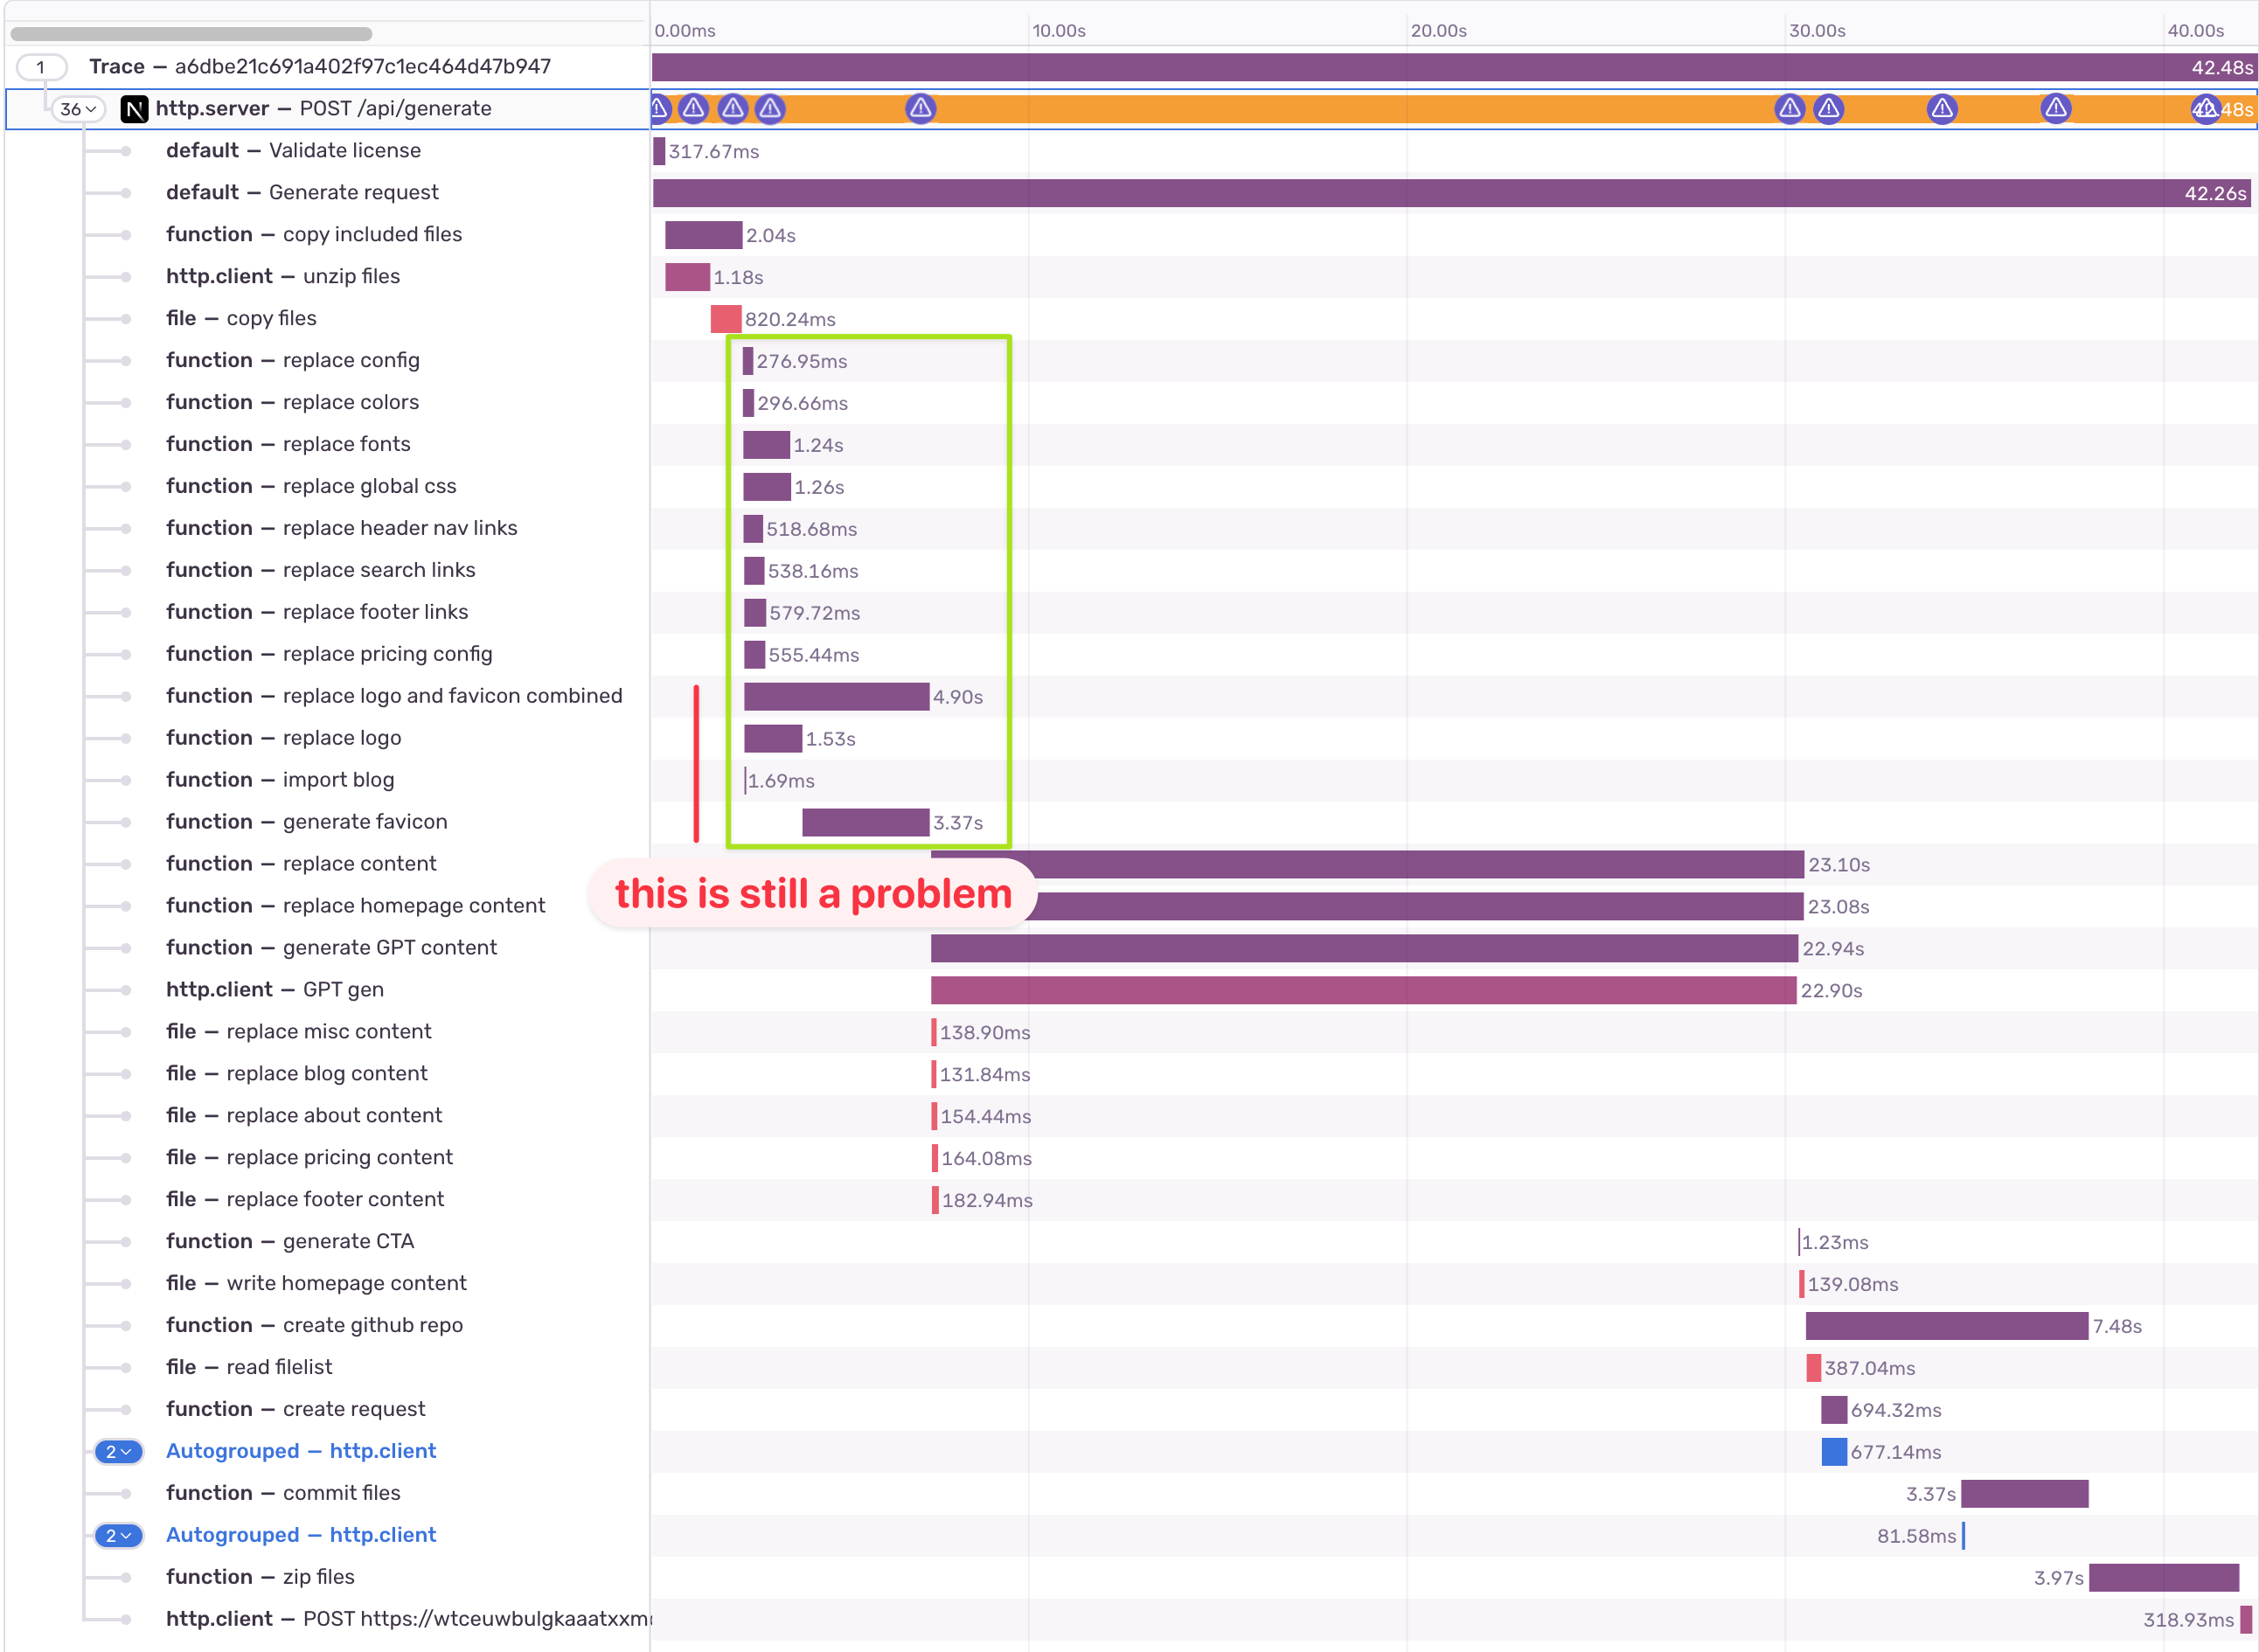
One thing to note is the image processing step has 2 child spans that are not running in parallel. That bothered me, because it seems odd that those 2 are coupled, so it seemed like another easy win.
Parallelizing image processing [41.98s]
This is the point where I realize that the dependency was deeper than I originally thought. So it failed spectacularly, but it also revealed a code smell.

This prompted me to do a tiny refactoring, and split up the task into multiple independent steps.
The performance gain was minor (3.8s vs 4.28s), but I was thrilled to have cleaned up a sketchy part of the code.

Changing Gen AI model [35.87s]
As mentioned before, it’s always good to re-evaluate your 3rd party https calls. Sometimes there’s a new version of the API, a new model, or a new API altogether. Earlier in the year I swapped from Github’s REST API to GraphQL and that reduce the number of calls considerably for committing files.
I experimented with a few OpenAI models and it seemed like the most recent (just announced that week!), gpt-4o-mini, performs a lot faster for this task (about 6s quicker).

However, I've noticed it was not as stable, thank goodness we have Sentry, really.
One out of three generations would fail. I think it somehow did not manage to produce a complete JSON structure that was required for the task as soon as reliably as gpt-3.5-turbo.
I wanted this improvement though, so I came up with a plan. For the same input, I can split this one OpenAI call into 4 separate ones. That way it should be more reliable at producing JSON (there are some other techniques available, but this was me burning money to solve a problem quickly).
That didn’t exactly work, but it did speed the process even further. I then pulled out Thor’s hammer and did something you shouldn’t do. If there are any children around, please send them to their room.
I parsed the JSON and should it fail, I would make another API call so the friendly AI can fix it.
Now, I don’t recommend that you do this. The correct approach is probably to use JSON Mode, however that would require changing yet another part in the content processing pipeline. The decision was that it wasn’t worth the risk, but I’ll be sure to revise this soon (will you really, Dan?).
Here’s how it looked in the end:

(The difference between 9.96s and 6.25s is the time it takes to fix the JSON, if need be)
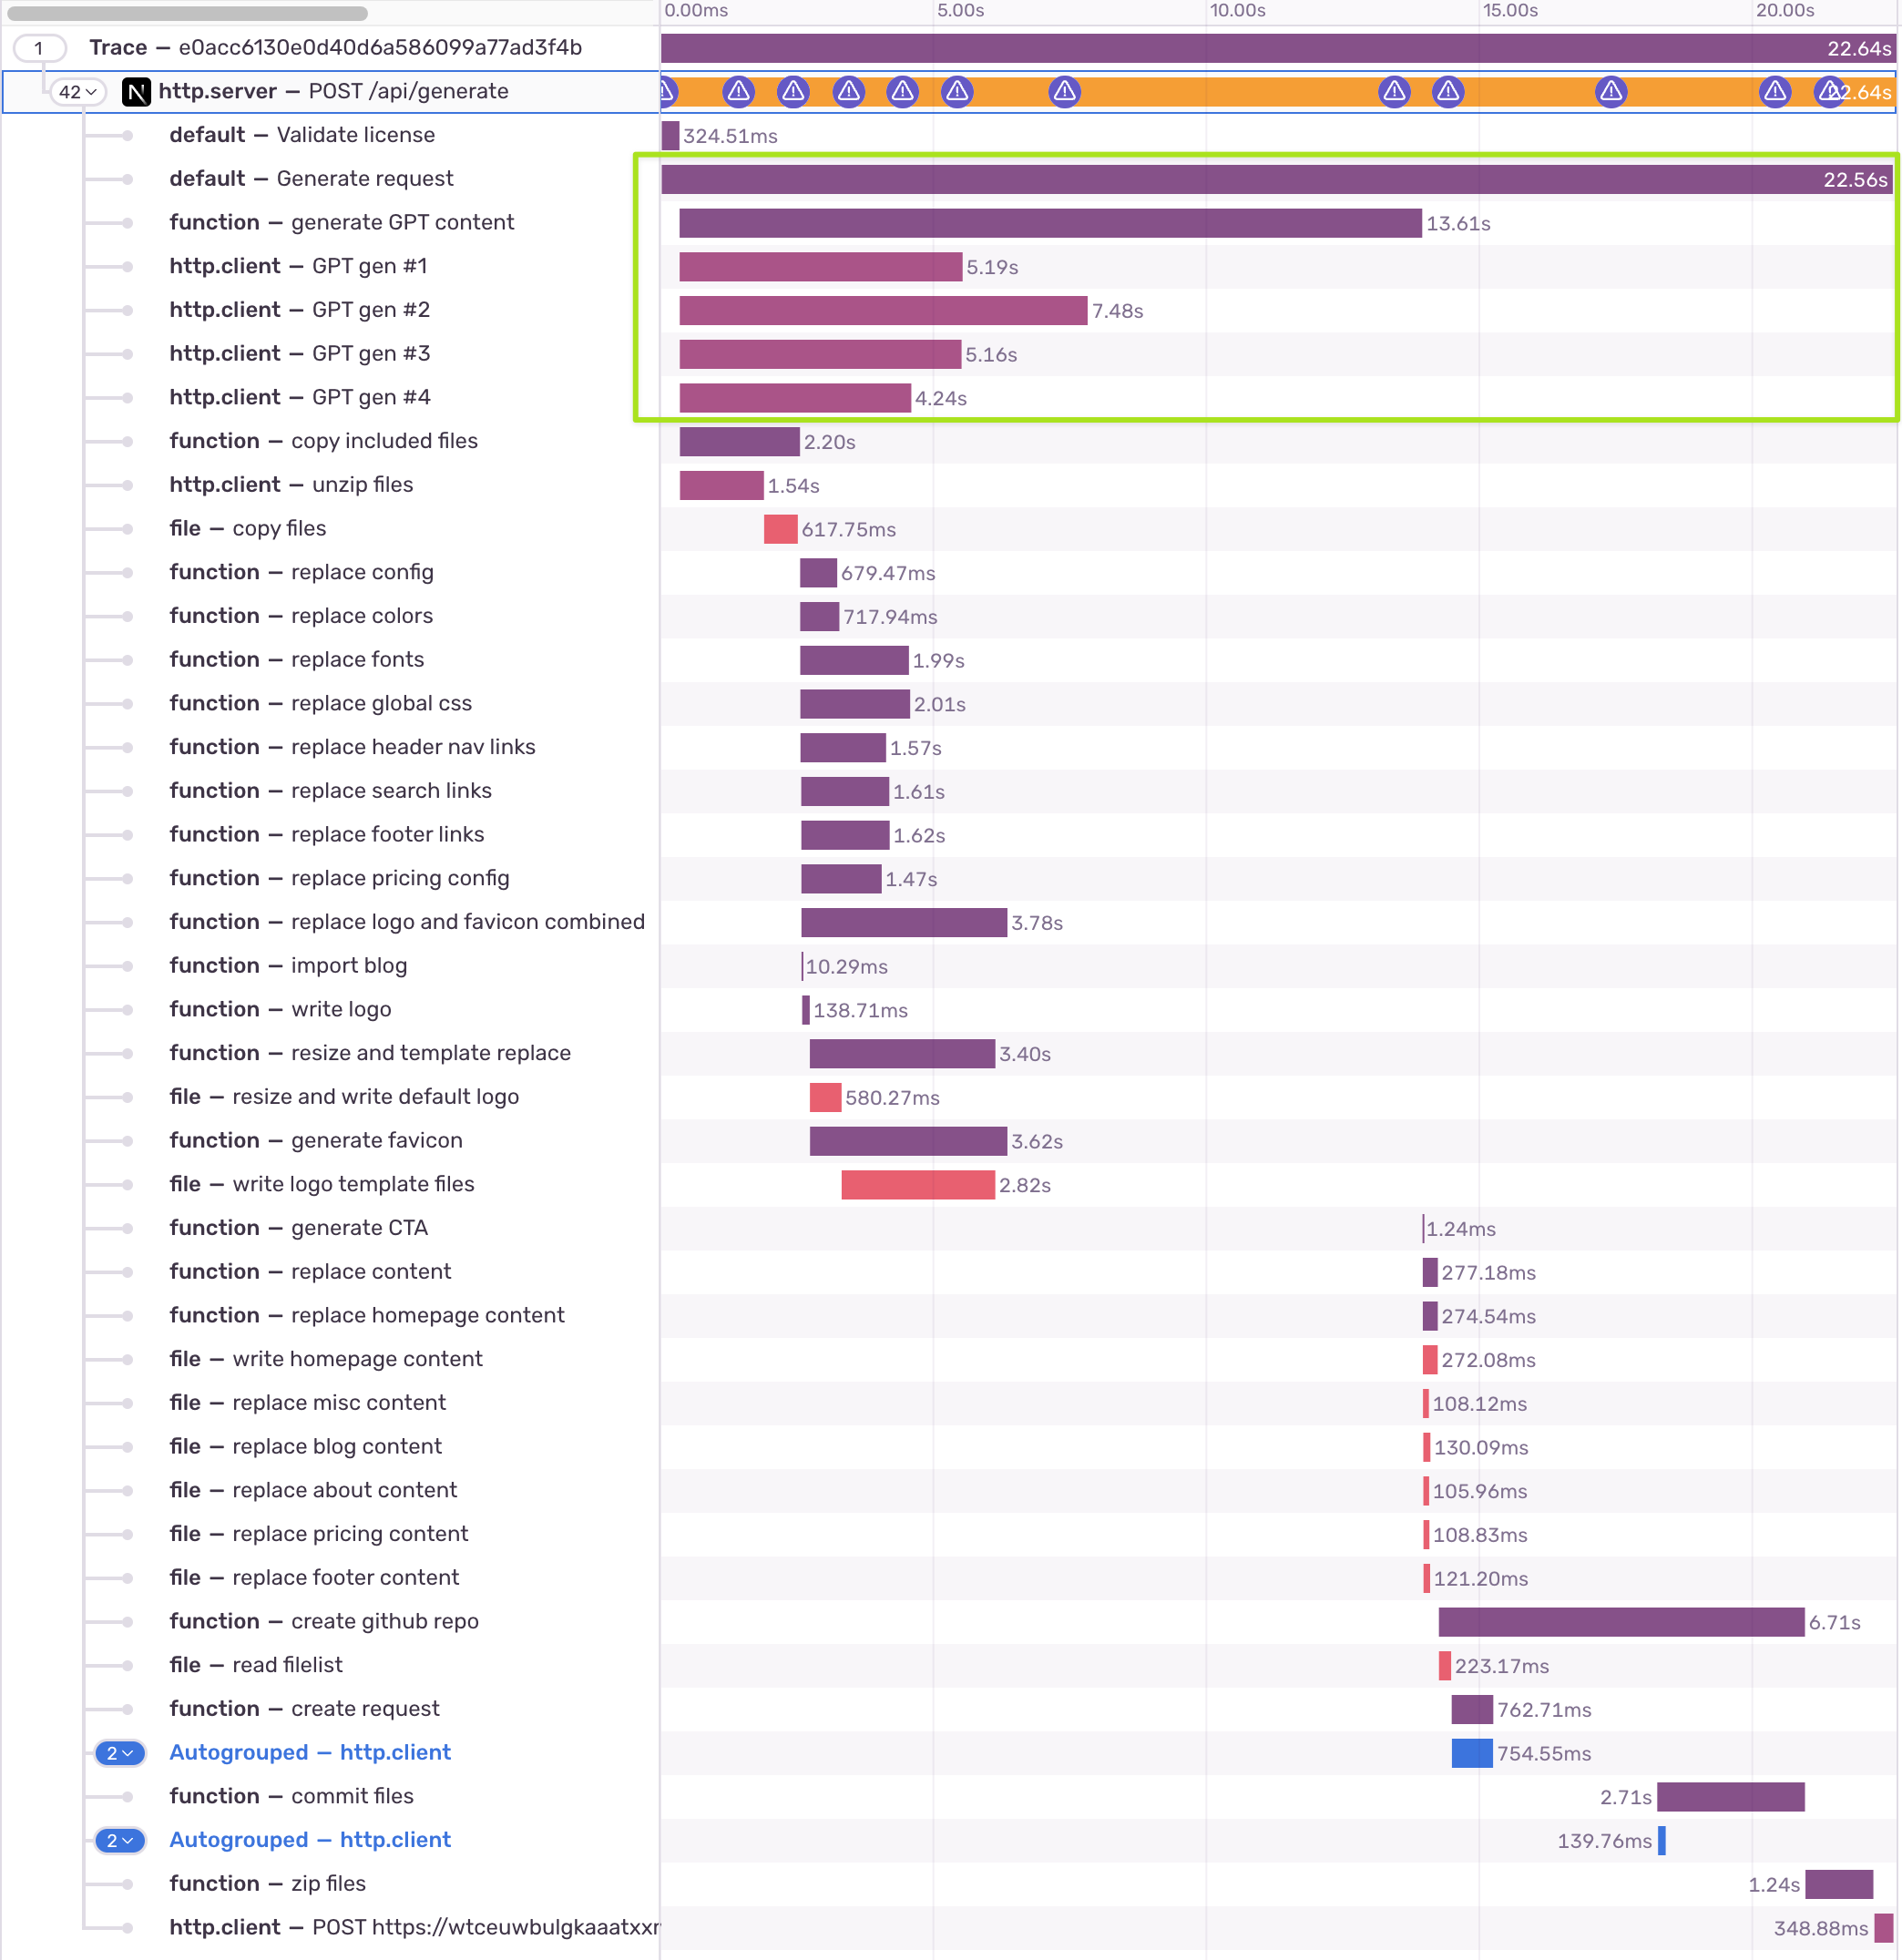
Changing the Order of Independent Spans [22.64s]
The last easy win that I could apply is changing the order of spans that don’t have dependencies.
In theory, the AI gen span can run from the beginning and only the span that needs to replace content (file I/O) needs to wait for it. All other spans can run in parallel.
As with the images, I discovered there were unnecessary dependencies with this task, too. After a quick refactor, I managed to move it to the very top. And wouldn’t you know it, this has turned out to be a massive gain (roughly 23% faster vs the previous step!).
Reflections and overview
At the end of this, I am left with quite a few ideas on what to optimize further.
3-5s Using Open AI’s JSON mode
1-2s Zipping/Unzipping I/O
0.5-1s Optimizing images on the client
All in all, that means that with further optimization I could get the response time to be up to 69% faster 🤯.
But let’s not get ahead of ourselves. For now, here’s what I achieved:
Step | Response Time | Total Change | Relative Change |
|---|---|---|---|
Baseline | 44.94s | - | - |
Parallelize Spans | 42.48s | -5.47% | -5.47% |
Optimize image processing | 41.98s | -6.59% | -1.18% |
Change Gen AI model | 35.87s | -20.18% | -14.56% |
Move Gen AI span to start | 22.64s | -49.62% | -22.64% |
The eagle-eyed viewer should notice that 3s are lost somewhere around the commit files span. Can you guess why?
What I like about Sentry’s Trace View
The fact that the Trace View presented each change in this easy-to-digest waterfall view was a huge time saver for me. I could easily see how each iteration impacted the overall performance and rollback or double down.
There were a few steps in between that I didn’t mention. The waterfall view made it very easy to pursue an optimization path or not. I dig it.
Keep an eye on bottlenecks
One thing to notice is that some spans that were relatively quick have gotten considerably slower. As mentioned before, parallelizing too much might push the system to the limit (RAM, CPU, FS, etc), so it will have diminishing returns. On a serverless/lamba environment, this might be a hard limitation.
The waterfall view also makes this easy to see at a glance.
Conclusion
This was a fantastic exercise and beyond the performance optimizations, resulted in considerable improvements to the codebase. It made the code more maintainable and scalable, which is often just as important as performance.
The final result was a 22.64 second decrease in response time, which is roughly a 50% improvement!
On top of that, I was left with a lot of ideas to optimize further. It can likely be reduced by 15-20% more which was also clear to see from the Trace View.
I definitely recommend setting some time aside and going through this exercise.
Over time we add features that slowly but surely decrease the performance of our endpoints, so one of the most important things you can do now is to set up tracking so you know what your baseline is.
Do you have any slow endpoints? I bet you’ll have just as much fun as I did optimizing them!
