How Clever.fm Monitors and Fixes Real Issues
How Clever.fm Monitors and Fixes Real Issues
Clever.fm is developing a platform to connect podcast listeners with community and content to make podcasting financially sustainable for creators. Our application provides features such as capturing moments, sharing snippets, and having discussions on podcast episodes.
How (and why) we use Sentry
A year ago we launched our application for beta testers and hooked up Firebase Crashlytics since it was part of the Firebase offering. In developing a consumer application, it was very important for us to pay close attention to the user’s experience. We have a feedback feature in our application that lets users write 1-2 lines of feedback alongside a screenshot. When we started getting more users, we noticed weird and unpredictable behavior from Crashlytics. We would try to cross-reference crashes with the feedback the user was leaving us and realized that Crashlytics wasn’t capturing all errors.
Another huge downside of Crashlytics was a significant delay, sometimes hours, in viewing the crash data in the console. In the case we were able to reproduce an error locally, this delay still made development quite challenging.
We needed a more reliable solution to monitor our application and so we decided to try a Crashlytics alternative: Sentry, as one of the members of the development team had used it before and recommended it.
Setup was easy
We followed the Flutter-specific documentation on Sentry and in a few simple steps we were able to get started. Being an early stage startup, it was a huge benefit that we were able to configure this quickly and get back to building the product.
Sign up for a Sentry account
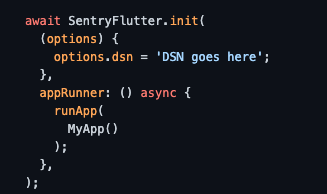
Add
sentry_flutterin your pubspec.yaml
Wrap
runApp()withSentryFlutterto initialize it
Voila. We were now able to see issues, stacktraces, and breadcrumbs to show what screens the user had visited leading up to the error.
Tracking and fixing real issues for our application
Let me tell you how we were able to track down and fix an issue that was hard to reproduce locally by the dev team.
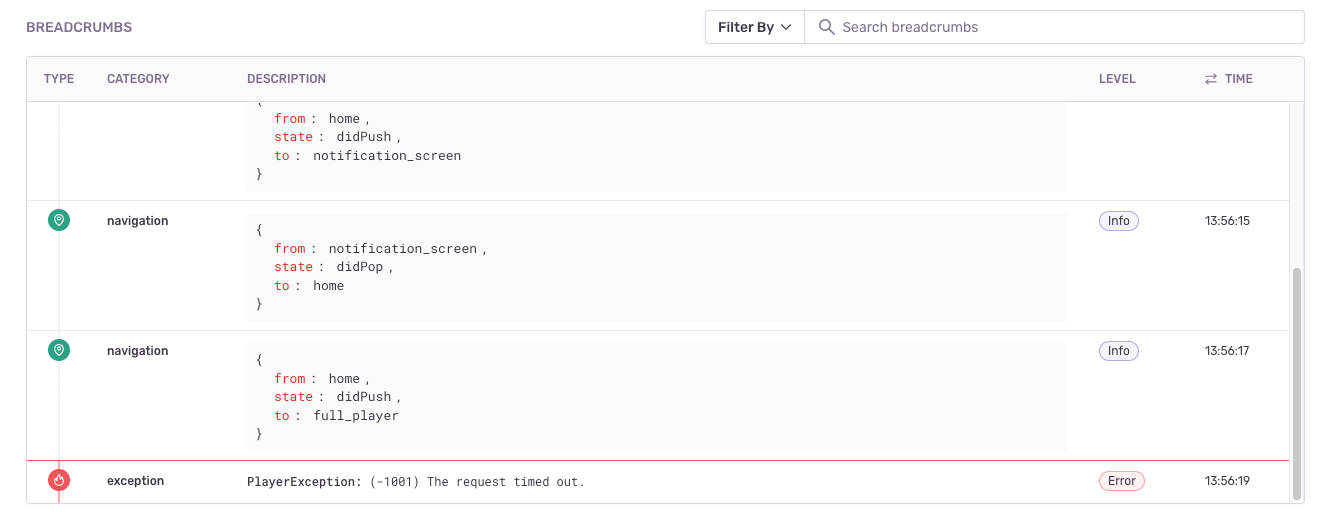
Sentry automatically logs “breadcrumbs”, which is a timeline view of a user’s navigation through the application, leading up to a crash. This data is typically very useful to reproduce an error as it tells the exact steps the user took. Here’s an example:
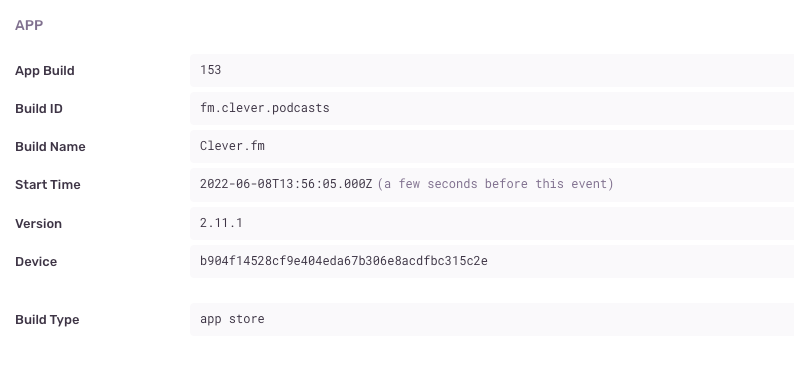
In this particular case, despite having the breadcrumbs in front of us, we were unable to reproduce the issue. However, Sentry allowed us to dig deeper and look at the exact Events. From there we noticed the error was only happening on one specific Android device type with an older OS version. We were then able to create an emulator with this OS version, reproduce the issue, and eventually resolve it.
Other Sentry capabilities we've been using
Some of our leading developers suggested Sentry because it provides close to real-time tracking of issues, device info, logs, events and detailed stacktraces which makes it easy to narrow down bugs and fix them.
We even used it to filter and sort issues based on environment, timestamp and even with the smallest detail regarding the origin device like OS, name, version, company, etc. Another core capability that we found most helpful was the ability to group similar issues, making it easier for our team to find high-impact issues while allowing access to individual events when we need to dig deeper. One last thing to note is that Sentry captures a LOT of information out of the box without any additional setup. This makes our developers’ lives easier without sacrificing error tracking.
In conclusion, our lean team of backend and flutter developers have been able to track errors more closely and solve issues more quickly, a critical need for our team.


