Handling GraphQL Errors Using Sentry
Handling GraphQL Errors Using Sentry
As the adoption of GraphQL is rising steadily, teams often come across the natural question of how to deal with errors that pass service boundaries and propagate from API endpoints to clients and consumers.
As GraphQL was intentionally built around taking care of the validation and resolution of requests fetching and modifying data, when we think about error handling, it naturally focuses on the format of returned exceptions: To adhere to the specification, server responses containing errors should be structured to help clients understand what went wrong and whether parts of the response can still be used, which is fundamental for client-side tooling. This means, that you have to find out what works best for your team.
As with many things, the difficult truth is, there's no right way. There's no one solution to rule them all in the same way as there's no one GraphQL client or server implementation used by everyone. There are, however, numerous useful practices that have helped companies building error handling in production systems.
To get started, errors in GraphQL can often be attributed to one specific phase of the request lifecycle, for example distinguishing between validation and execution errors. Validation errors are typically user-facing, to inform a user why their query was invalid, whereas some execution errors might contain only little information by design, imagine an internal error that shouldn't be exposed. This will largely depend on your situation, though.
Furthermore, you're able to determine which part of a query failed, in cases where a nested resource could not be resolved, take this query as an example:
query loadAccountDetails {
user {
id
followers {
count
}
}
}{
"errors": [
{
"message": "Follower count could not be fetched.",
"locations": [{ "line": 5, "column": 6 }],
"path": ["user", "followers", "count"]
}
],
"data": {
"user": {
"id": 1,
"followers": {
"count": null
}
}
}
}Here we can see that resolving the follower count failed on the server (this is just for demonstration purposes, it could have occurred when calling a third-party API, for example), and that our client may still be able to work with the response, as other details, such as the user identifier, were resolved without further problems. For reporting however, this error by itself is a bit sparse.
When reporting an error on the server side, we've got a lot of information to work with: Most importantly, we know whether a user attempted to modify or purely retrieve (or stream) data, based on the request being a GraphQL query, mutation, or subscription.
In addition to that, we can add detailed information about the query itself, be it the field that failed to resolve (e.g. the follower count), or the complete query, as well as user input supplied as variables.
This is where GraphQL really helps us out, as we can leverage the strict API schema to be able to reconstruct a failing case relatively quickly, based on the request and response details we added to our report.
Reporting Errors to Sentry with Apollo Server (Node.js, TypeScript)
Let's check out a very simple error handling implementation using Apollo Server and Node.js, connected to Sentry. You can check out the complete source in the CodeSandbox I created for this purpose.
When configuring our Apollo Server, we can add plugins that allow us to hook into the request lifecycle, at the point where errors were encountered. In this case, we'll hook into the didEncounterErrors event our GraphQL server exposes and discard all errors right away that do not contain an operation definition. This means, that validation errors will be ignored completely as the document's operation (i.e. your current query) can only be parsed if valid.
We'll also use a couple of techniques the Sentry SDK offers to enhance the context of any errors we're about to report.
didEncounterErrors(ctx) {
  // If we couldn't parse the operation, don't
  // do anything here
  if (!ctx.operation) {
    return;
  }
  for (const err of ctx.errors) {
    // Only report internal server errors,
    // all errors extending ApolloError should be user-facing
    if (err instanceof ApolloError) {
      continue;
    }
    // Add scoped report details and send to Sentry
    Sentry.withScope(scope => {
      // Annotate whether failing operation was query/mutation/subscription
      scope.setTag("kind", ctx.operation.operation);
      // Log query and variables as extras
      // (make sure to strip out sensitive data!)
      scope.setExtra("query", ctx.request.query);
      scope.setExtra("variables", ctx.request.variables);
      if (err.path) {
        // We can also add the path as breadcrumb
        scope.addBreadcrumb({
          category: "query-path",
          message: err.path.join(" > "),
          level: Sentry.Severity.Debug
        });
      }
      Sentry.captureException(err);
    });
  }
}
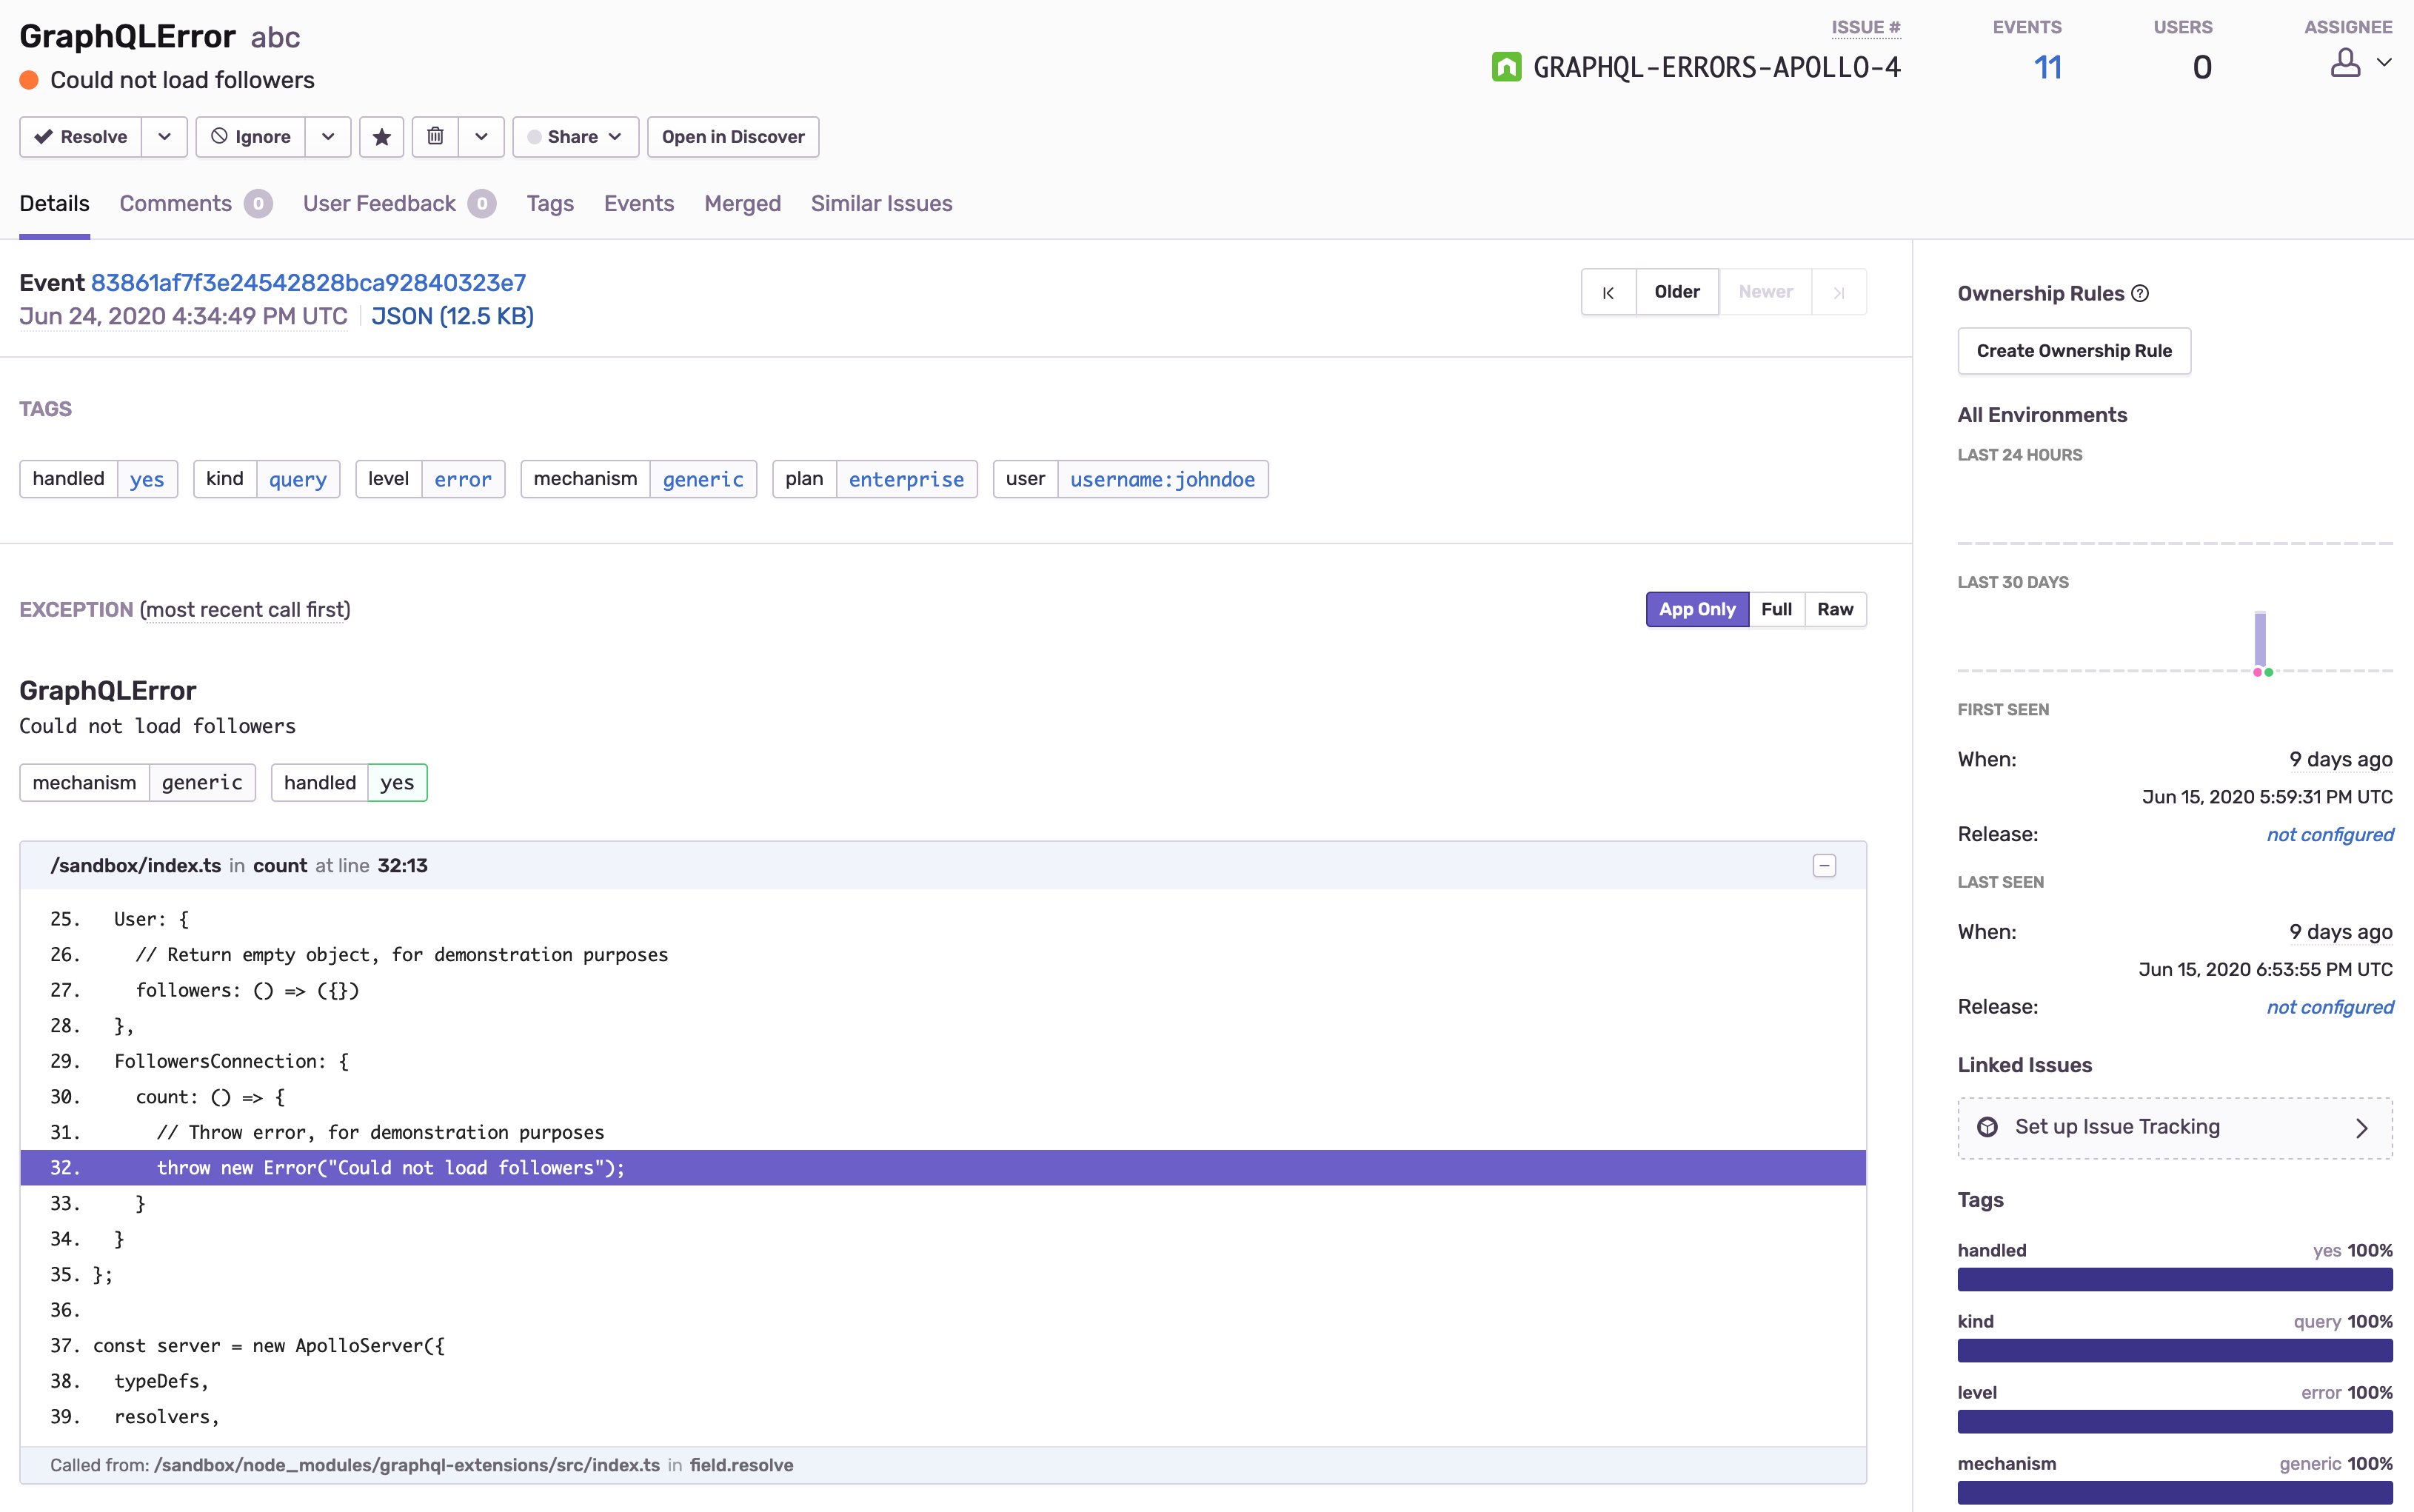
If we send a few requests and head over to Sentry, we can see that our reported events contain all the data we supplied: We're able to filter based on the operation kind, and inspect request details like the query and variables.
You can go ahead and enhance this even further, adding more important request details like connecting the current user, and other relevant information. Below, you can see the event in Sentry, with the user, subscription tier and operation type set as tags.
The Extra information will appear on the bottom of the page
Tracing Errors, End-To-End
Sometimes, we encounter errors with little information attached, especially on the client side. When it's too sensitive to expose, we often go for the Internal Server Error, or a similarly vague message.
Without a way of linking the opaque request failure from the client side to the more detailed report our backend sent, there's little we can do to investigate or get any further details out of it, as might have been the intention.
Luckily, it's easy to attach a unique transaction identifier to our client request, so that it is passed along to the backend for Sentry to tag events with the same transaction identifier as was used on the frontend, effectively grouping both events. If we go back to our previous example, we can add the following inside of our withScope function:
// Retrieve the transaction ID from our request headers
const transactionId = ctx.request.http.headers.get('x-transaction-id');
if (transactionId) {
  scope.setTransaction(transactionId);
}
// ...
Sentry.captureException(err);
Add searchable details as tags, otherwise use extras
As we're working with different types of data, we'll have to differentiate between the attributes we want to filter and search on (tags), and additional data (extras) that can be important to include in our individual event, but may be not as meaningful in metrics and reports, which we can create out of tags.
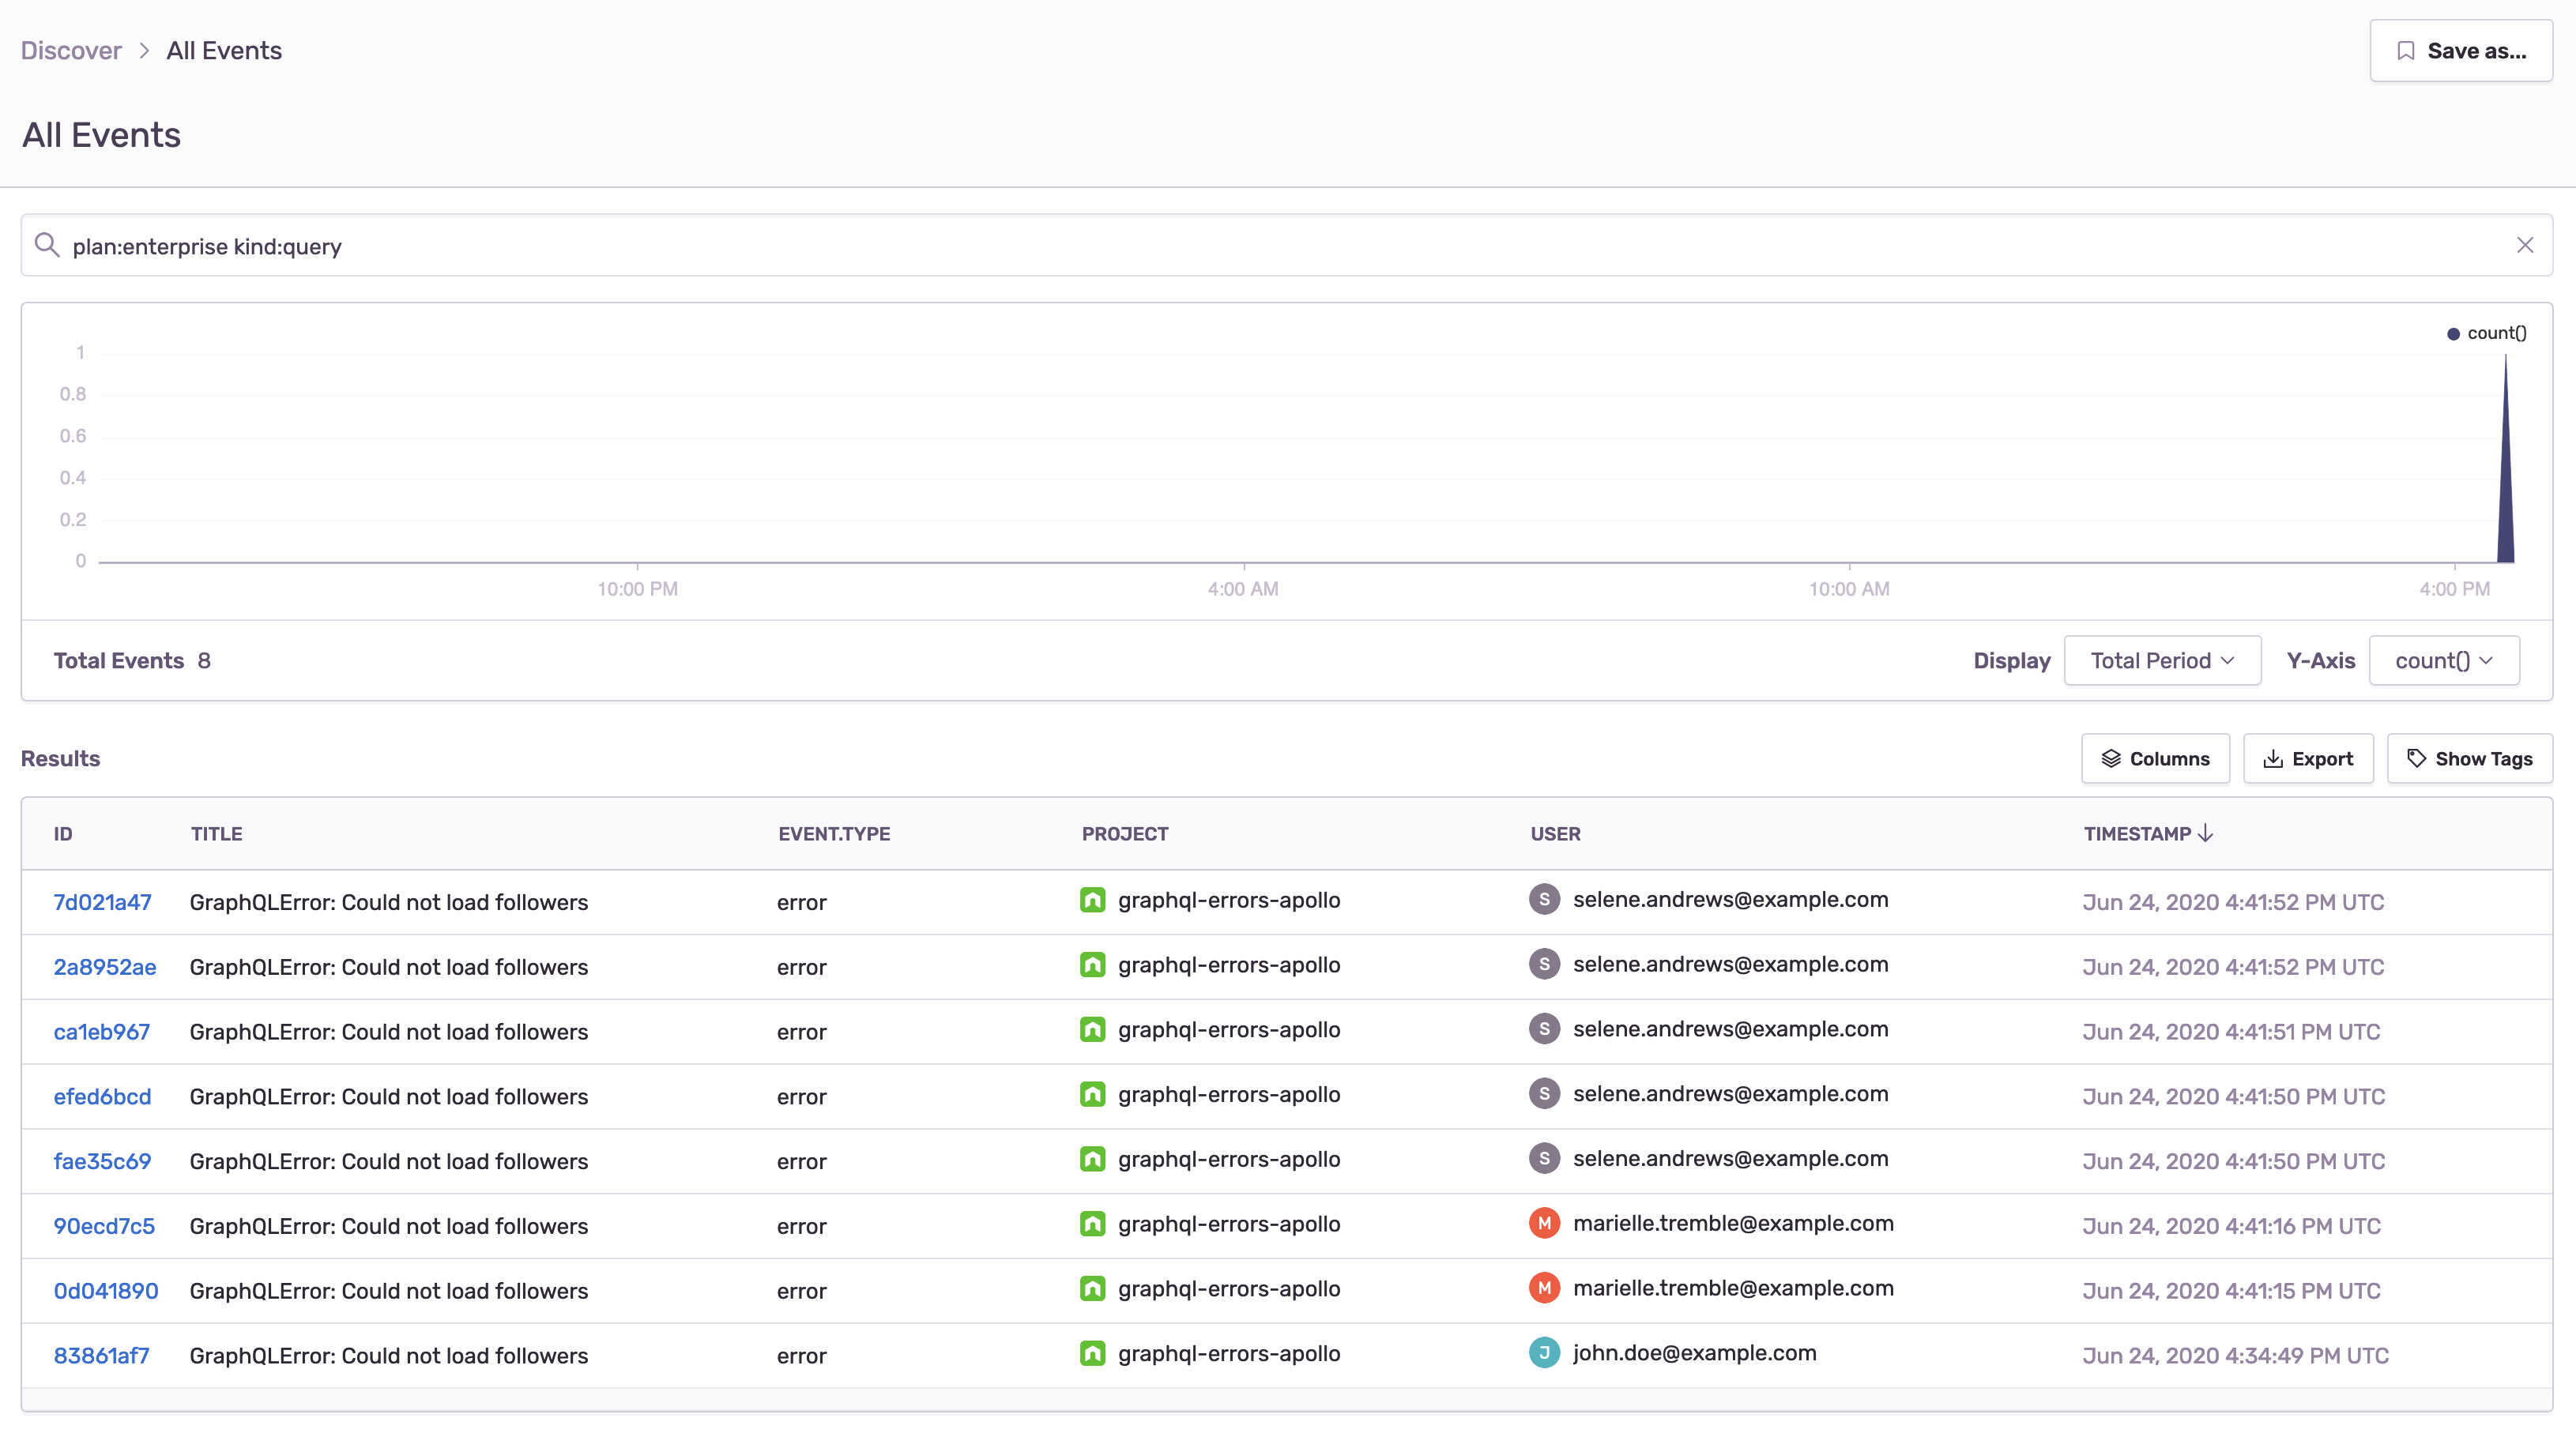
An example Sentry Discover report utilizing additional user information such as the subscription tier can be seen here in the search field.
With that said, go ahead and try to implement some error handling and reporting for your server to have peace of mind, knowing that whenever something fails, you'll know how to act on it, supplied with all the details you need!
Bruno is a full-stack web engineer from Germany. He is currently building backend infrastructure at GraphCMS. He enjoys working with cutting edge technologies around the web, including containerization and cloud-native infrastructure. He likes to collaborate on open source software and writes blog posts about software development.


