Full Stack Visibility to Find the Root Cause of Slow


An app that works as expected is great, but if expected means a beachball for 10 seconds before the page loads, that’s… not so great. Customers want it all; an application that is stable and fast... Luckily, Sentry does more than tell you when something is broken in your code, it also tells you what’s slow and how to fix it.
Getting the Most out of Performance MonitoringGetting the Most out of Performance Monitoring
Performance monitoring can be complex because our developer ecosystems are complex. It’s not often that you’re building an entire application within a single project. That means that slowdowns happening in one project can be the performance bottleneck in a different project.
The more complex our ecosystems become, the more critical it is to monitor your entire stack, that way when Sentry gives you tips on how to fix the slowdown, you can actually identify the code responsible. Following the trace from the frontend request to the slow API call on the backend has never been easier.
Service-to-Service ChatterService-to-Service Chatter
Frontend technologies, or clients, communicate with backend services, and those services talk to database servers or third-party services. Take an ecommerce company for example. This storefront could have a website and a mobile app, both of which talk to an API Gateway that routes information to the inventory service, and finally to the payment service.
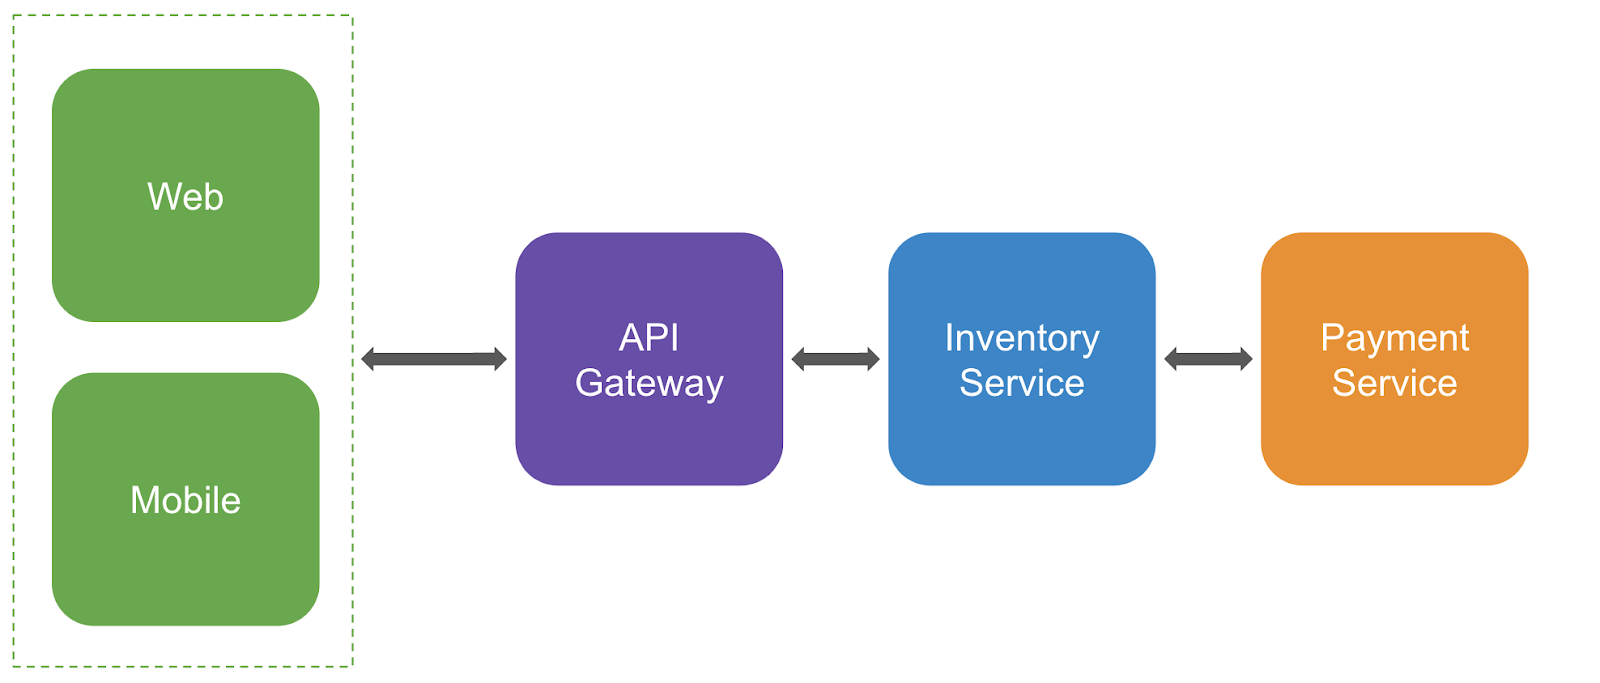
Each transaction within the trace starting from the client, all the way to payment service, is a chain of calls that could have a cascading impact on each transaction. But, without telemetry on all your services and projects, your teams don’t have full visibility into end-to-end traces — so in theory your Web Vitals might be good which is a big thumbs up for the web team, but your inventory services and checkout flows could be taking forever to process — leaving all teams scratching their heads.
Understanding how your services are communicating with each other matters because if one service is waiting on another to respond, application performance will degrade and your users may see the infamous spinning wheel of death. By instrumenting Sentry for your frontend and backend projects, you can look across projects to see how an operation in one project is slowing down an operation in another.
Cross-Project VisibilityCross-Project Visibility
“Sounds cool, how’s it work?” Sentry’s SDK monitors changes in your code and measures metrics like throughput, Apdex, User Misery, and transaction duration and displays the impact of errors across multiple systems. Sentry captures distributed traces consisting of transactions and spans, which measure individual services and individual operations within those services.
A transaction represents a single instance of a service being called to support an operation you want to measure or track (e.g. page load, page navigation, an API call or asynchronous task). Individual operations are called spans. Poor-performing spans can impact latency resulting in a poor user experience or throughput issues impacting your site during peak times. Sentry’s distributed tracing capabilities allow you to see how a slow span in one project is holding up a transaction in another project.
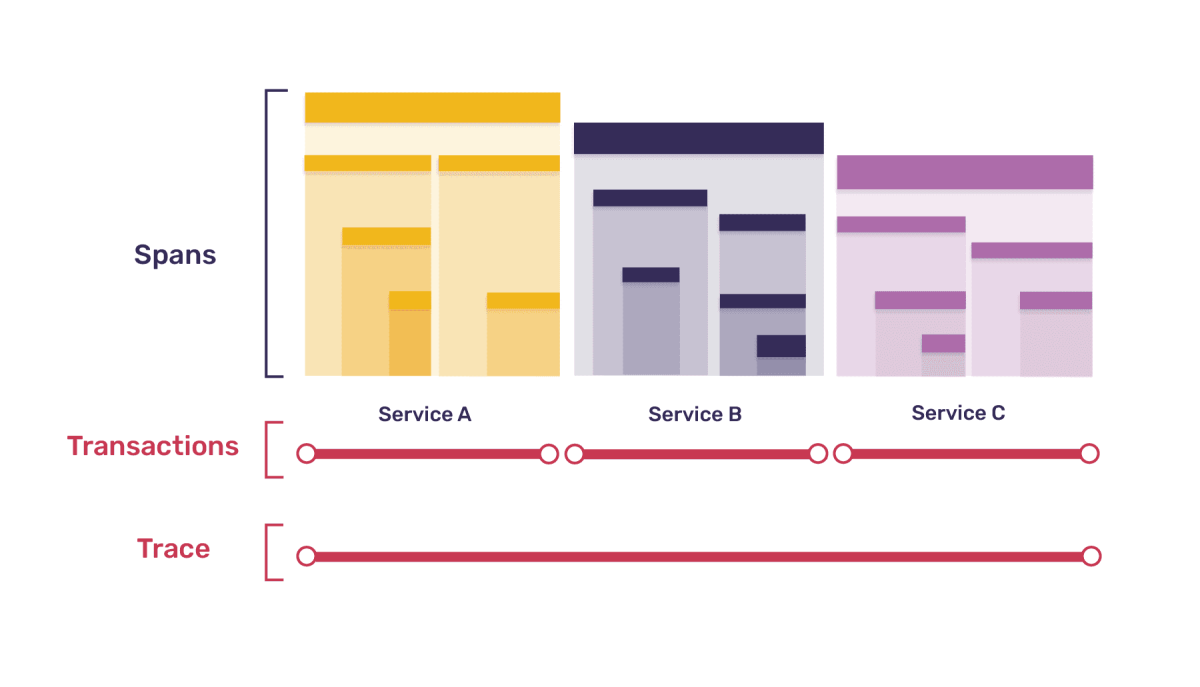
Distributed tracing will not only tell you what’s slow in your code but also identifies third-party dependencies. Distributed tracing is the backbone of Trace View and Trace Navigator which provides a minimap showing you how spans interact with each other across projects.
Finding What’s SlowFinding What’s Slow
Let’s go back to that ecommerce example, turns out the frontend is built in React and the backend is using the Flask framework in Python. One day you notice that the product pages are loading slowly. You go to the Performance tab in Sentry and see the p50 for the /products page is over 7 seconds (yikes!).
The slow page load time is associated with my React project, but is this where the real problem is?
Let’s find out:
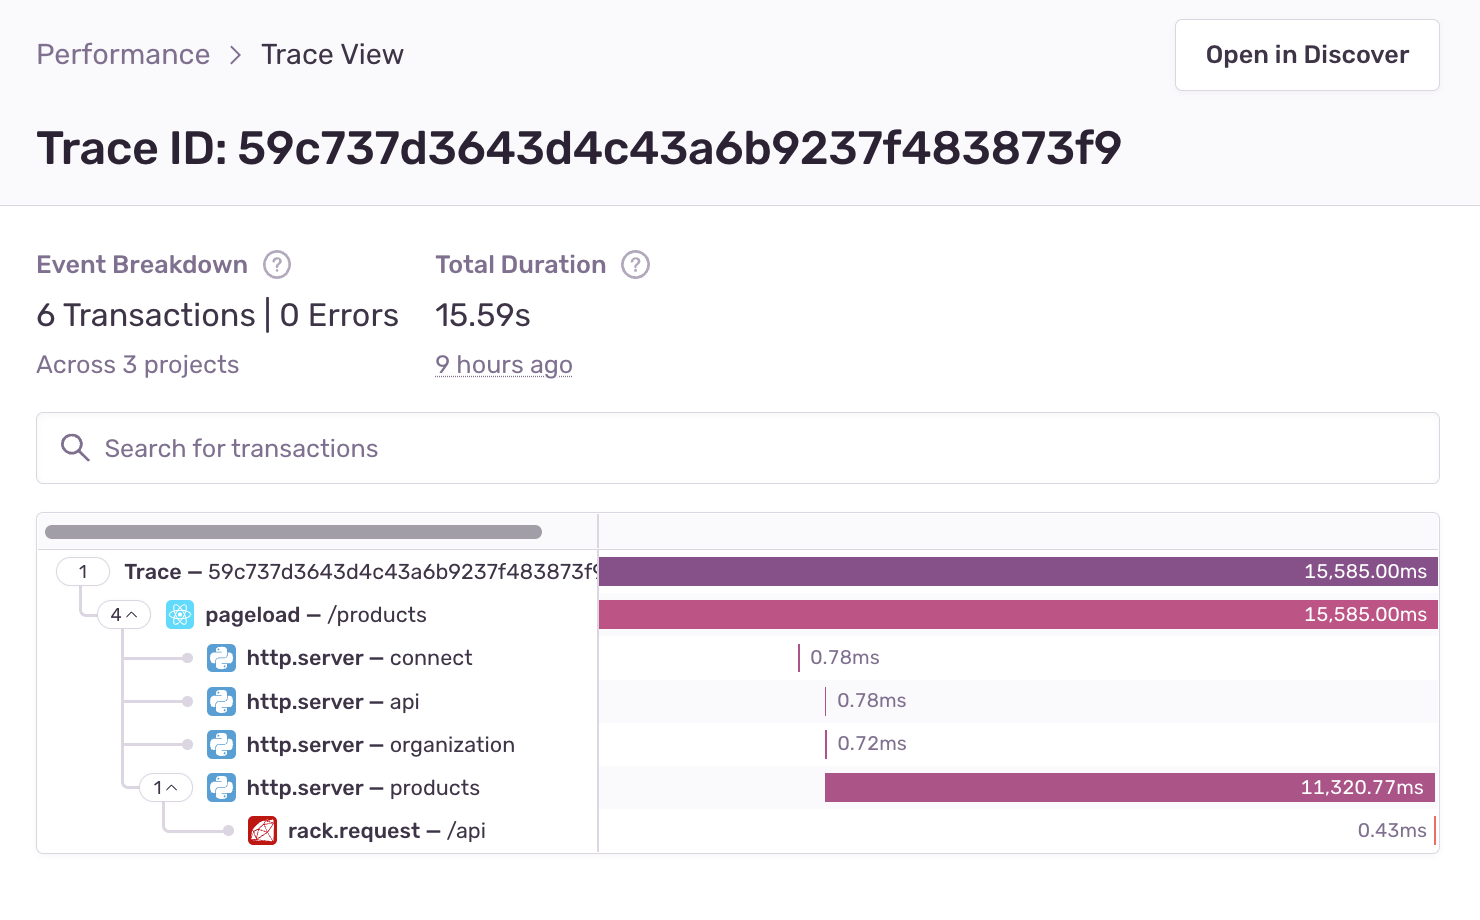
I select the /products transaction to land on the Transaction Summary page. On this page, I can see transaction duration over time, events associated with the slow transaction, Suspect Spans and Tags, and more.
Next, I select an Event ID associated with this transaction. Now I see that the page load for this example Event ID is taking over 11 seconds and has a number of associated spans across my React and Flask projects.
From here I can see the duration of each span and the span causing the slow transaction. I can see that a span is taking over 10 seconds. Surprise, surprise… it’s not a span in my React project, it’s in my Flask project.
After identifying the slow span, I select Transaction Summary to see the operations within the span. This is where the magic of distributed tracing shines. On the Transaction Summary page, I see that a slow n+1 database query is causing the hold-up.
Why Full-Stack Observability MattersWhy Full-Stack Observability Matters
Being able to pick slow spans out of a lineup is the fastest way to see a performance issue’s root cause and know how to solve it. Suspect Spans point you to the transactions with spans that are likely responsible for slowing down your application. However, if you are only monitoring your frontend, you may focus on trying to fix the wrong span when it’s slow due to a dependency in a backend project.
By monitoring your entire stack, you have visibility into how services across your stack communicate with each other, making it easier to find interdependencies causing the slow-down. Installing Sentry for your frontend and backend helps you save time by not trying to “fix” something in one project that doesn’t address the root cause.
For questions or feedback, drop us a line on GitHub, Twitter, or our Discord. And if you’re new to Sentry, you can try it for free today or request a demo to get started.