Fixing Sentry with Sentry: Lock-Contention Edition
Fixing Sentry with Sentry: Lock-Contention EditionSentry recently experienced two minor outages related to database lock-contention: a situation where a process stops executing as it waits on another to release a shared resource they each depend on. It's kind of like [insert comical metaphor intended to inspire a light-hearted chuckle here].
Database locks are notoriously tricky to debug since it's difficult to replicate a concurrent system with all of the unexpected side effects in an often single-threaded test suite. We know from past experience how painful a long-running transaction can be when running Postgres.
Symptoms
Sentry experienced brief moments of unavailability at the end of January and again at the end of February. As a side-effect of a long-running query, our production database began to grind to a halt, and our billing system was left in an incomplete state. In other words, pending changes to a paid subscription couldn't be applied without manual intervention.
To identify the root cause, we had to look deeper. So, we asked ourselves if any other issues could be traced back to the organization affected by this odd billing state?
Looking deeper
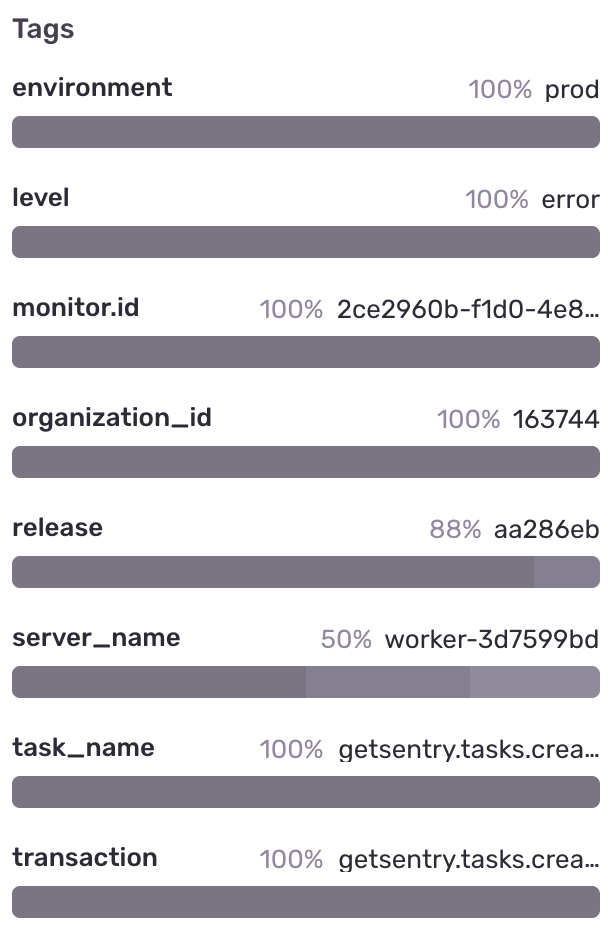
Thanks to Sentry's incredibly robust tagging and search infrastructure (Have you heard of our new query-builder, Discover? we found the original exception that caused the inconsistent state. Here, the plot thickens.

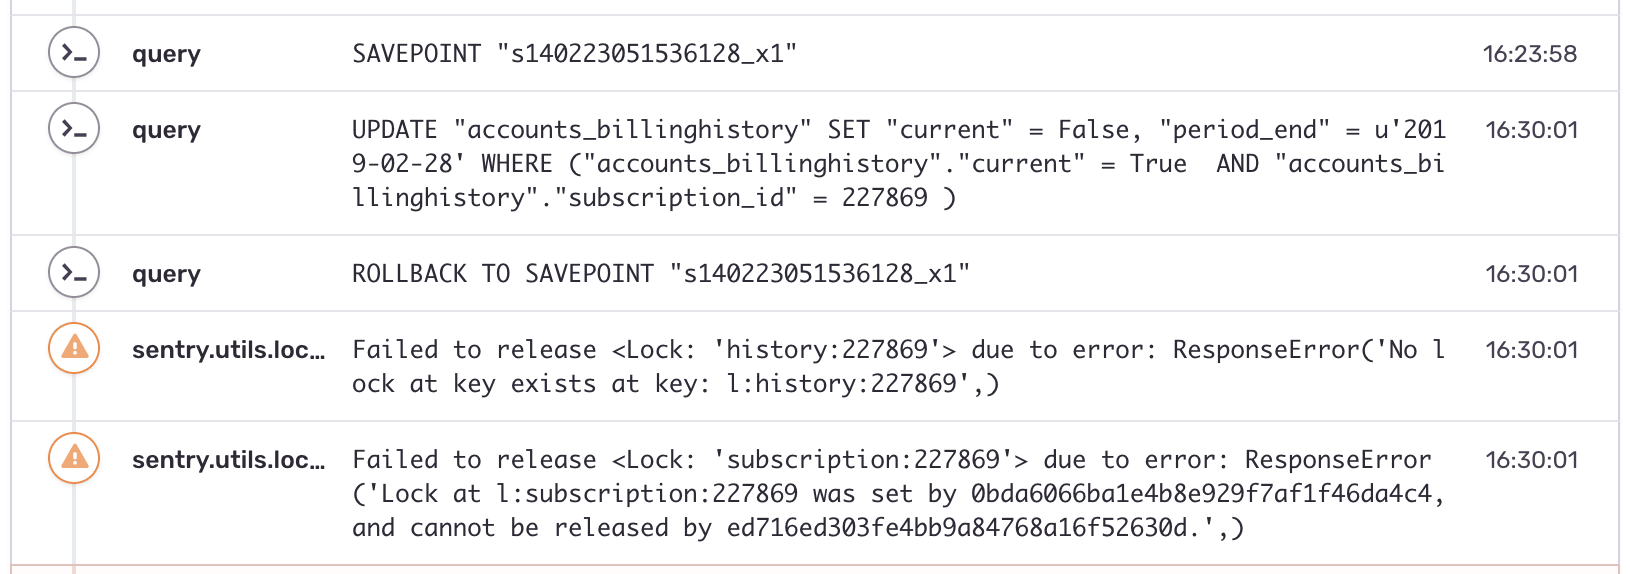
With the original exception identified, we used Breadcrumbs — another world-class Sentry feature — to understand the sequence of SQL statements that led up to the fateful lock contention:
This is where things get... strange. This code path is supposed to be the one taking out this lock. Also, why do 7 minutes elapse before the UPDATE is issued after the SAVEPOINT is taken?
The “Ah-Ha!” moment
Thanks to these Breadcrumbs, we realized that while most of our code paths use our default database connection, our billing code relies on a special dedicated database connection.
The dedicated connection gives us additional flexibility when making sensitive mutations in transactions isolated from transactions used throughout the rest of our codebase. Once we recognized that the lock was being held far longer than it should have (minutes, rather than seconds), we realized this could have a cascading impact and ultimately cause the outages experienced twice before.
The fix was to simply use the correct database connection in this critical code path.
Takeaways
Test coverage is great. That said, any time your production environment differs from your test environment (e.g., running tests in a transaction vs. across multiple transactions) is a risk that must be managed or mitigated in other ways. We added test coverage to ensure this mistake won't be made again.
One error often causes data to enter a bad state, and other exceptions are triggered later when the unexpected data is encountered. Log lines ordered sequentially in time can be difficult to triangulate back to the root cause. Without resolving the fundamental issue, the bandaid of fixing bad state is only temporary.
Breadcrumbs give you the critical context necessary to understand the steps leading up to a bad outcome. The arrival of distributed systems and microservices further underscore the importance of tracing what happened when in the context of a single request, task, or transaction as the case might be.
Wouldn't you feel more confident tackling production issues with the tools laid out here? Start a Sentry trial, and check out these tools with your own application.


