Dogfooding Chronicles: Weekly Report Emails
Dogfooding Chronicles: Weekly Report Emails
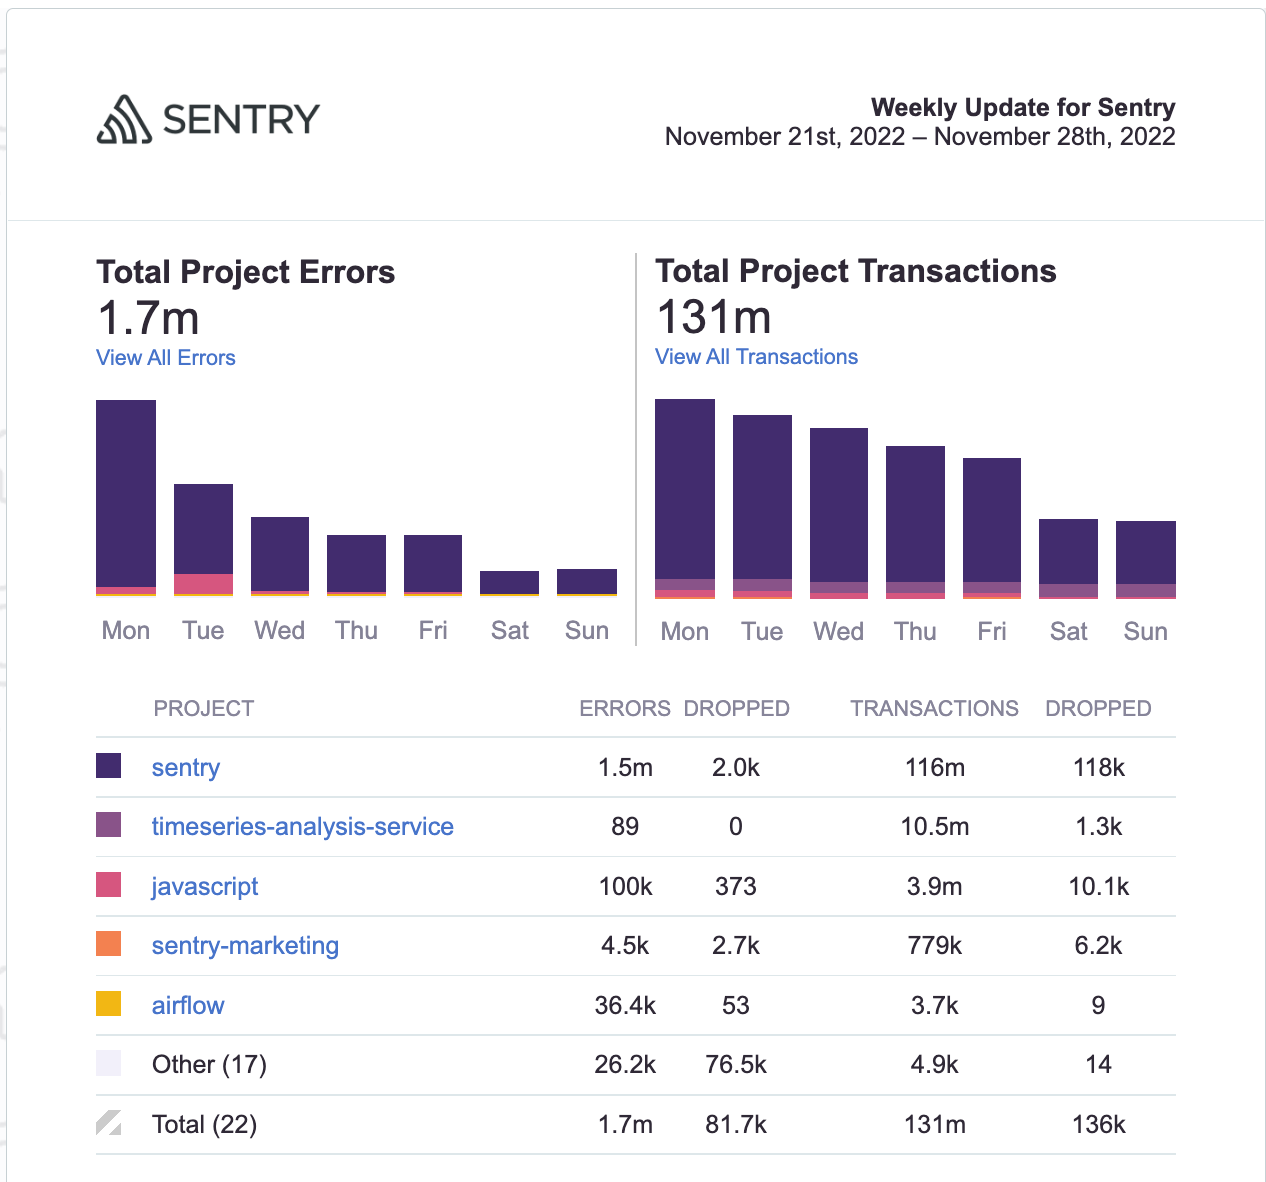
If you’re a Sentry user, you’ve probably seen those weekly emails we send out at the start of the week. They give a weekly recap to users of what happened in Sentry in the past week:
They’re a great way to get a snapshot view of what’s going on with your code without even logging into the Sentry. We start sending out the emails at midnight UTC each Monday in the hopes they land before you check your inbox in the morning.
The Problem
Shortly after we launched N+1 query detection, we saw a performance issue with the weekly report. Looking at the span, we saw a lot of duplicate queries which led us to investigate the problem with … well… Performance. Turns out it took almost 16 hours to send out all the emails! So if you’re located in Europe and in the CEST time zone, there’s a chance you wouldn’t receive the email until 5 pm Monday, which is way too late.
We have almost over 85,000 organizations and each organization can have many members (some have over 1000), so even though the average time spent per organization was just 1690ms, it was too slow.
Architecture
Here is the simplified code for how we used to send the weekly email:
def prepare_organization_report(organization):
projects = Project.objects.filter(organization=organization)
for project in projects:
prepare_project_report(project)The big problem was that we had to call prepare_project_report individually for each project. That function makes a number of queries where we look at data for individual projects. This was a bad case of N+1 queries because some organizations have over 1000 projects! In the new architecture, we use a query where we pass in all the projects at once.
Results
By making this architectural change, we were able to reduce the amount of time needed to send all around 8 hours. Over the course of a year, that’s over 27 days of computer time saved!
For our CEST customers, now the latest you’ll get the email is 9 AM, just in time for the work day to start. The average time of the prepare_organization_report task is now 635 ms, over a 60% decrease.
In case you missed it, we introduced a new issue type, Performance Issues. Now every weekly email you’ll see a section for Error Issues like you’re used to and a new section called “Most frequent performance issues”, so you too can easily see the most critical latency problems and improve them quickly.
In the rare case, you’re not monitoring your application’s performance, check out our docs on how to get started. It’s a one-line code change and is included in every plan.


