Debugging Python with VS Code and Sentry

David Y. -

Sentry is committed to helping developers fix broken code quickly and effectively. In this article, we’ll cover a range of intermediate to advanced techniques for debugging Python code using VS Code and the Sentry Python SDK.
Example for Python debugging
In order to debug, we need some buggy code. So we've prepared a short Python script. This script contains user data from an external JSON file into an internal data structure. Similar code could be used to import user accounts into an email newsletter manager.
python from dataclasses import dataclass from typing import List, Optional import json, sys, pprint @dataclass class User: id: int name: str email: str preferences: dict class UserProcessor: def __init__(self, data_file: str): self.data_file = data_file self.users: List[User] = [] def load_users(self) -> None: with open(self.data_file) as f: data = json.load(f) for user_data in data["users"]: user = User( id=user_data["id"], name=user_data["name"], email=user_data["email"], preferences=user_data.get("preferences", {}), ) self.users.append(user) def process_user(self, user_id: int) -> Optional[dict]: user = next((u for u in self.users if u.id == user_id), None) if not user: return None result = { "first_name": user.name.split()[0].title(), "last_name": user.name.split()[1].upper(), "email_domain": user.email.split("@")[1], "preference_count": len(user.preferences), "has_newsletter": user.preferences.get("newsletter", {}).get( "subscribed", False ), } return result def process_all_users(self) -> List[dict]: results = [] for user in self.users: result = self.process_user(user.id) if result: results.append(result) return results processor = UserProcessor("users.json") processor.load_users() results = processor.process_all_users() pprint.pprint(results)
This code will work for initial, simple test cases involving small, perfectly formatted users.json files, but will throw exceptions outside of a perfectly controlled testing environment. Some failure cases:
What if
users.jsondoes not exist?What if
users.jsoncontains invalid JSON?What if some users are missing fields?
What if some fields are different types from what we expect?
In the sections below, we'll use different debugging environments to investigate each of these cases. To follow along, copy-paste the above code to a file named users.py in an empty directory on your system (you will create users.json as part of the steps below).
How to debug Python in VS Code
VS Code provides a graphical debugging interface that can be used with a variety of programming languages, including Python. If you don't already have VS Code on your system, you can find installation files and instructions here.
Below, we'll set up VS Code's debugging functionality and use it to debug our Python script.
Set up VS Code for Python debugging
To set VS Code up for debugging, follow these steps:
1. Install Microsoft's Python and Python Debugger extensions. Open the command palette with cmd+p on mac or ctrl+p Windows and run these two commands:
ext install ms-python
ext install ms-python.debugpy
2. Install the debugpy Python library. Run the following command in the VS Code terminal:
bash pip install debugpy
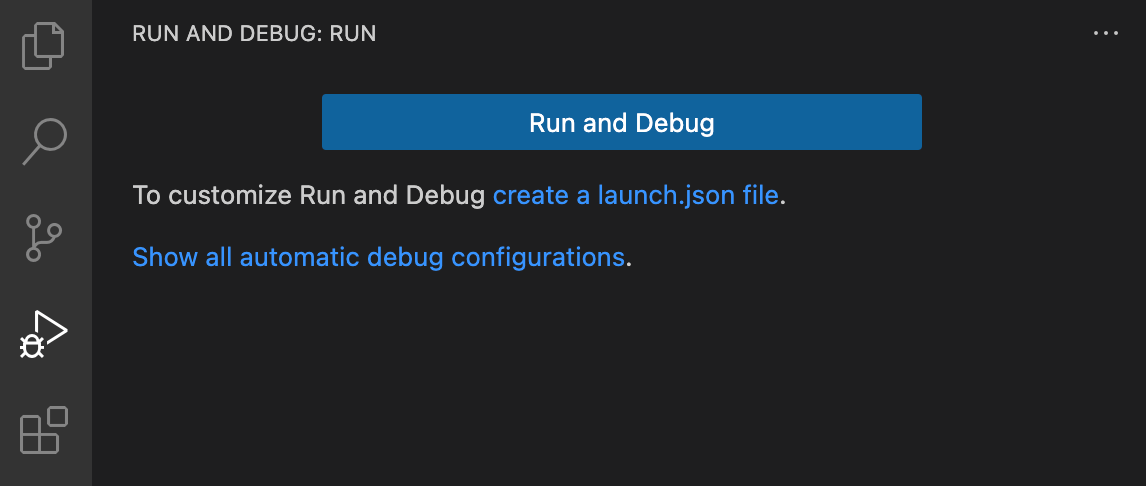
3. With the Python project open, navigate to the Run and Debug tab on the sidebar and click create a launch.json file.
4. In the debugger options menu that appears, select Python Debugger.
5. A menu of debug configurations will appear next. This has a variety of options for debugging different Python scripts and applications. For this exercise, choose the first option, Python File.
6. A file will now be created in the project directory at .vscode/launch.json. Save and exit this file.
VS Code is now set up to debug the Python script.
Debugging FileNotFound exceptions in Python in VS Code
FileNotFound exceptions in Python in VS Code To launch the script in debugging mode, click the green arrow at the top of the Run and Debug sidebar or press F5 on your keyboard.
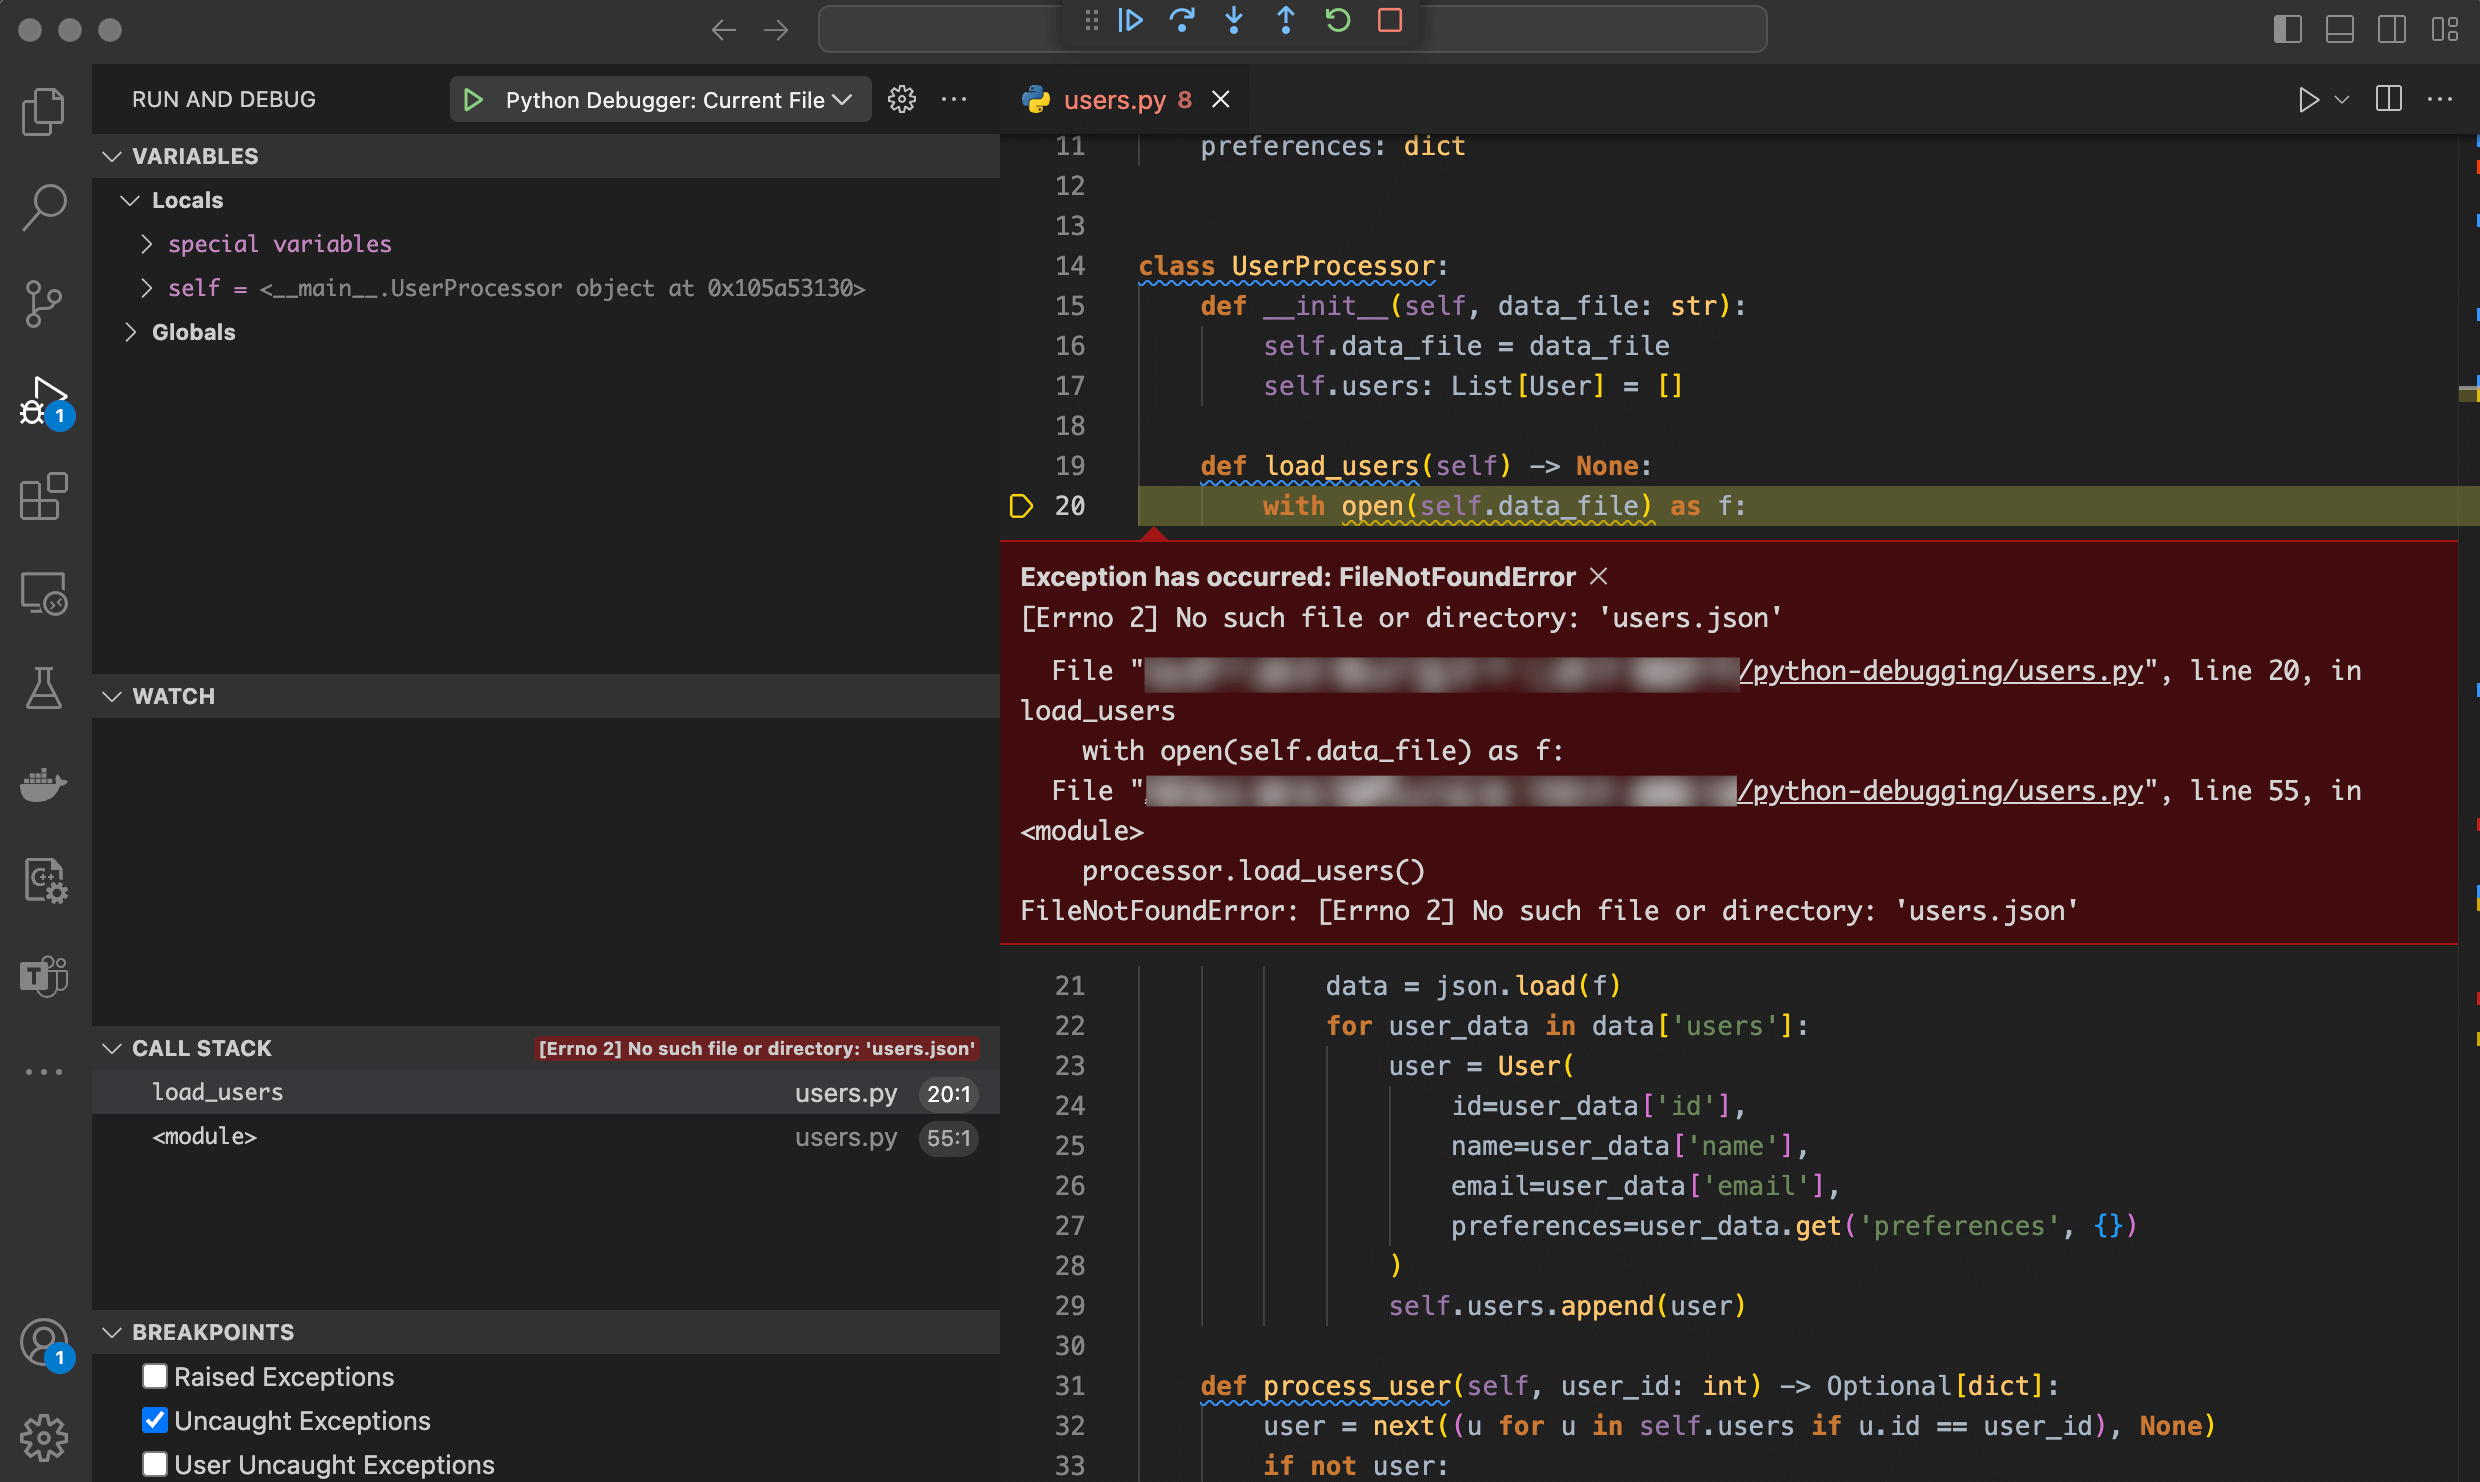
The users.py script will now run until it encounters an error, at which point the VS Code window should look something like this:
Here, the VS Code debugger shows a FileNotFound exception, and helpfully highlights the line where it was raised. From this context and the error message, we can see that the error occurs because users.json does not exist. To resolve this issue, we will do two things: Add exception handling and create the missing file.
First, let's add some code to the load_users function to display a friendly error message to the user and exit gracefully. Change the function to resemble the following:
def load_users(self) -> None:
    try:
        with open(self.data_file) as f:
            data = json.load(f)

            for user_data in data['users']:
                user = User(
                    id=user_data['id'],
                    name=user_data['name'],
                    email=user_data['email'],
                    preferences=user_data.get('preferences', {})
                )
                self.users.append(user)
    except FileNotFoundError:
        print("[!] The file 'users.json' was not found. Exiting...")
        sys.exit()
Restart the debugger by clicking the green circular arrow near the top of the screen or pressing cmd+shift+F5 on Mac or ctrl+shift+F5 on Windows.
With the addition of the exception handling code, the script will now display a message in the terminal and exit.
Debugging JSONDecodeError exceptions in Python in VS Code
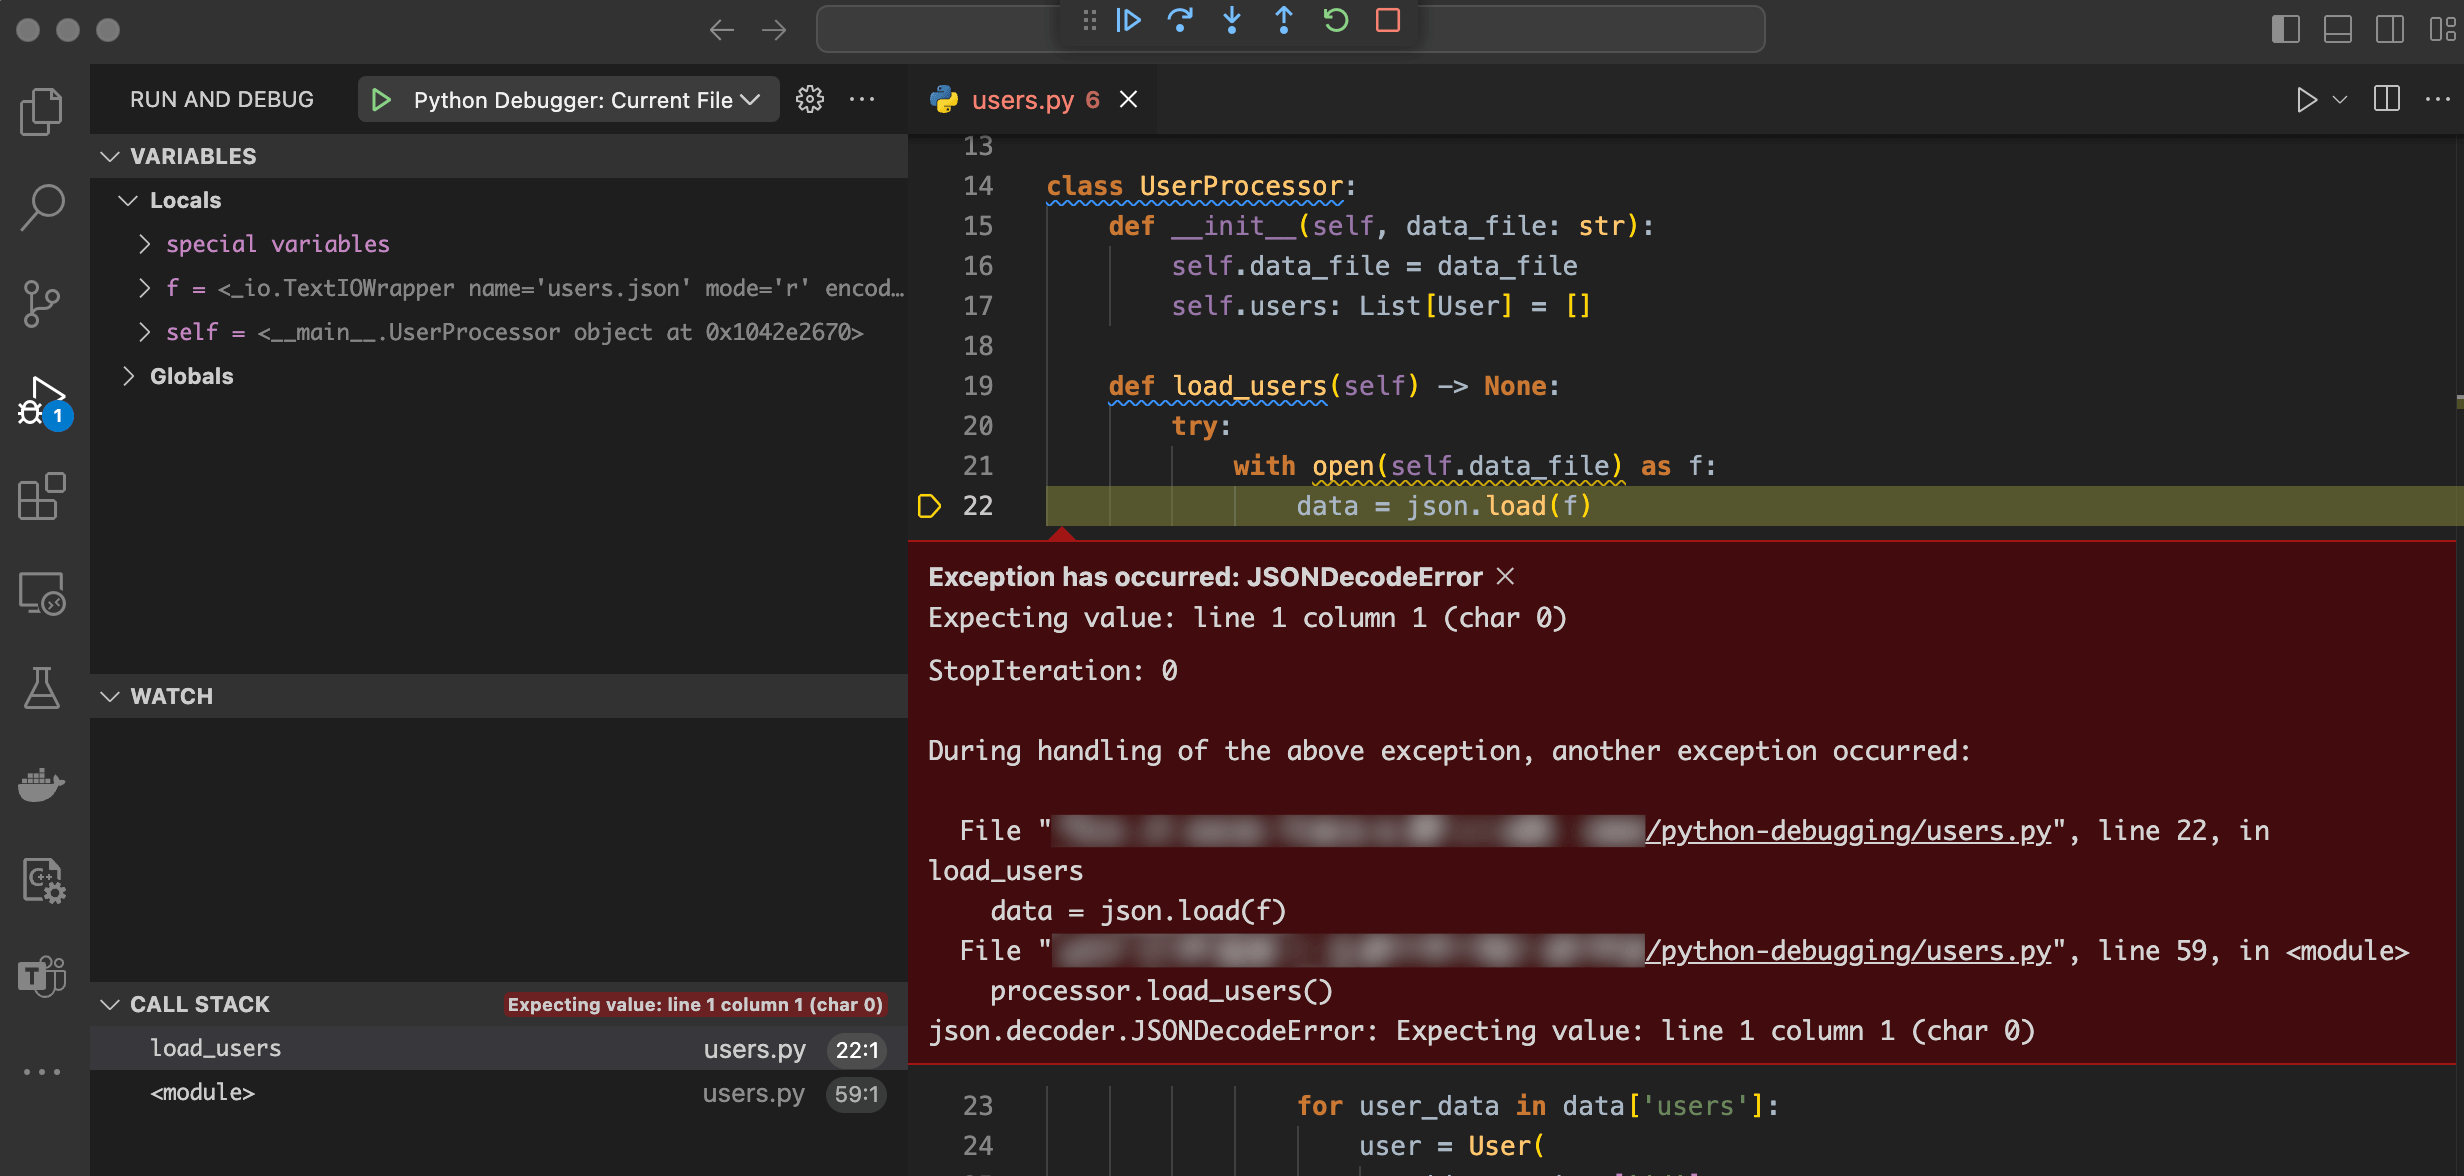
JSONDecodeError exceptions in Python in VS Code Now, we can move on. Create a file named users.json in the project directory and start the debugger. You should soon see the following error:
This time, we're getting an error when we attempt to parse the contents of the users.json file. This is likely because it's an empty file. We can handle this by adding another except block to the load_users function, as below:
def load_users(self) -> None:
    try:
        with open(self.data_file) as f:
            data = json.load(f)

            for user_data in data['users']:
                user = User(
                    id=user_data['id'],
                    name=user_data['name'],
                    email=user_data['email'],
                    preferences=user_data.get('preferences', {})
                )
                self.users.append(user)
    except FileNotFoundError:
        print("[!] The file 'users.json' was not found. Exiting...")
        sys.exit()
    except json.decoder.JSONDecodeError: # NEW EXCEPT BLOCK
        print("[!] The file 'users.json' contains invalid JSON. Exiting...")
        sys.exit()
Now our program will exit gracefully, but we still need the data in users.json.
Tracking variables while debugging in VS Code
So far, we've used VS Code to debug relatively simple exceptions. In this next example, we'll increase the complexity slightly. Populate the users.json file as follows:
json
{
  "users": [
    {
      "id": 1,
      "name": "alice smith",
      "email": "alice.smith@example.com",
      "preferences": {
        "newsletter": {
          "subscribed": true
        }
      }
    },
    {
      "id": 2,
      "name": "Bob Jones",
      "preferences": {
        "newsletter": {
          "subscribed": false
        }
      }
    },
    {
      "id": 3,
      "email": "carol.wilson@example.com"
    },
    {
      "id": 4,
      "name": "daisy johnson",
      "email": "daisy.johnsonexample.com"
    }
  ]
}
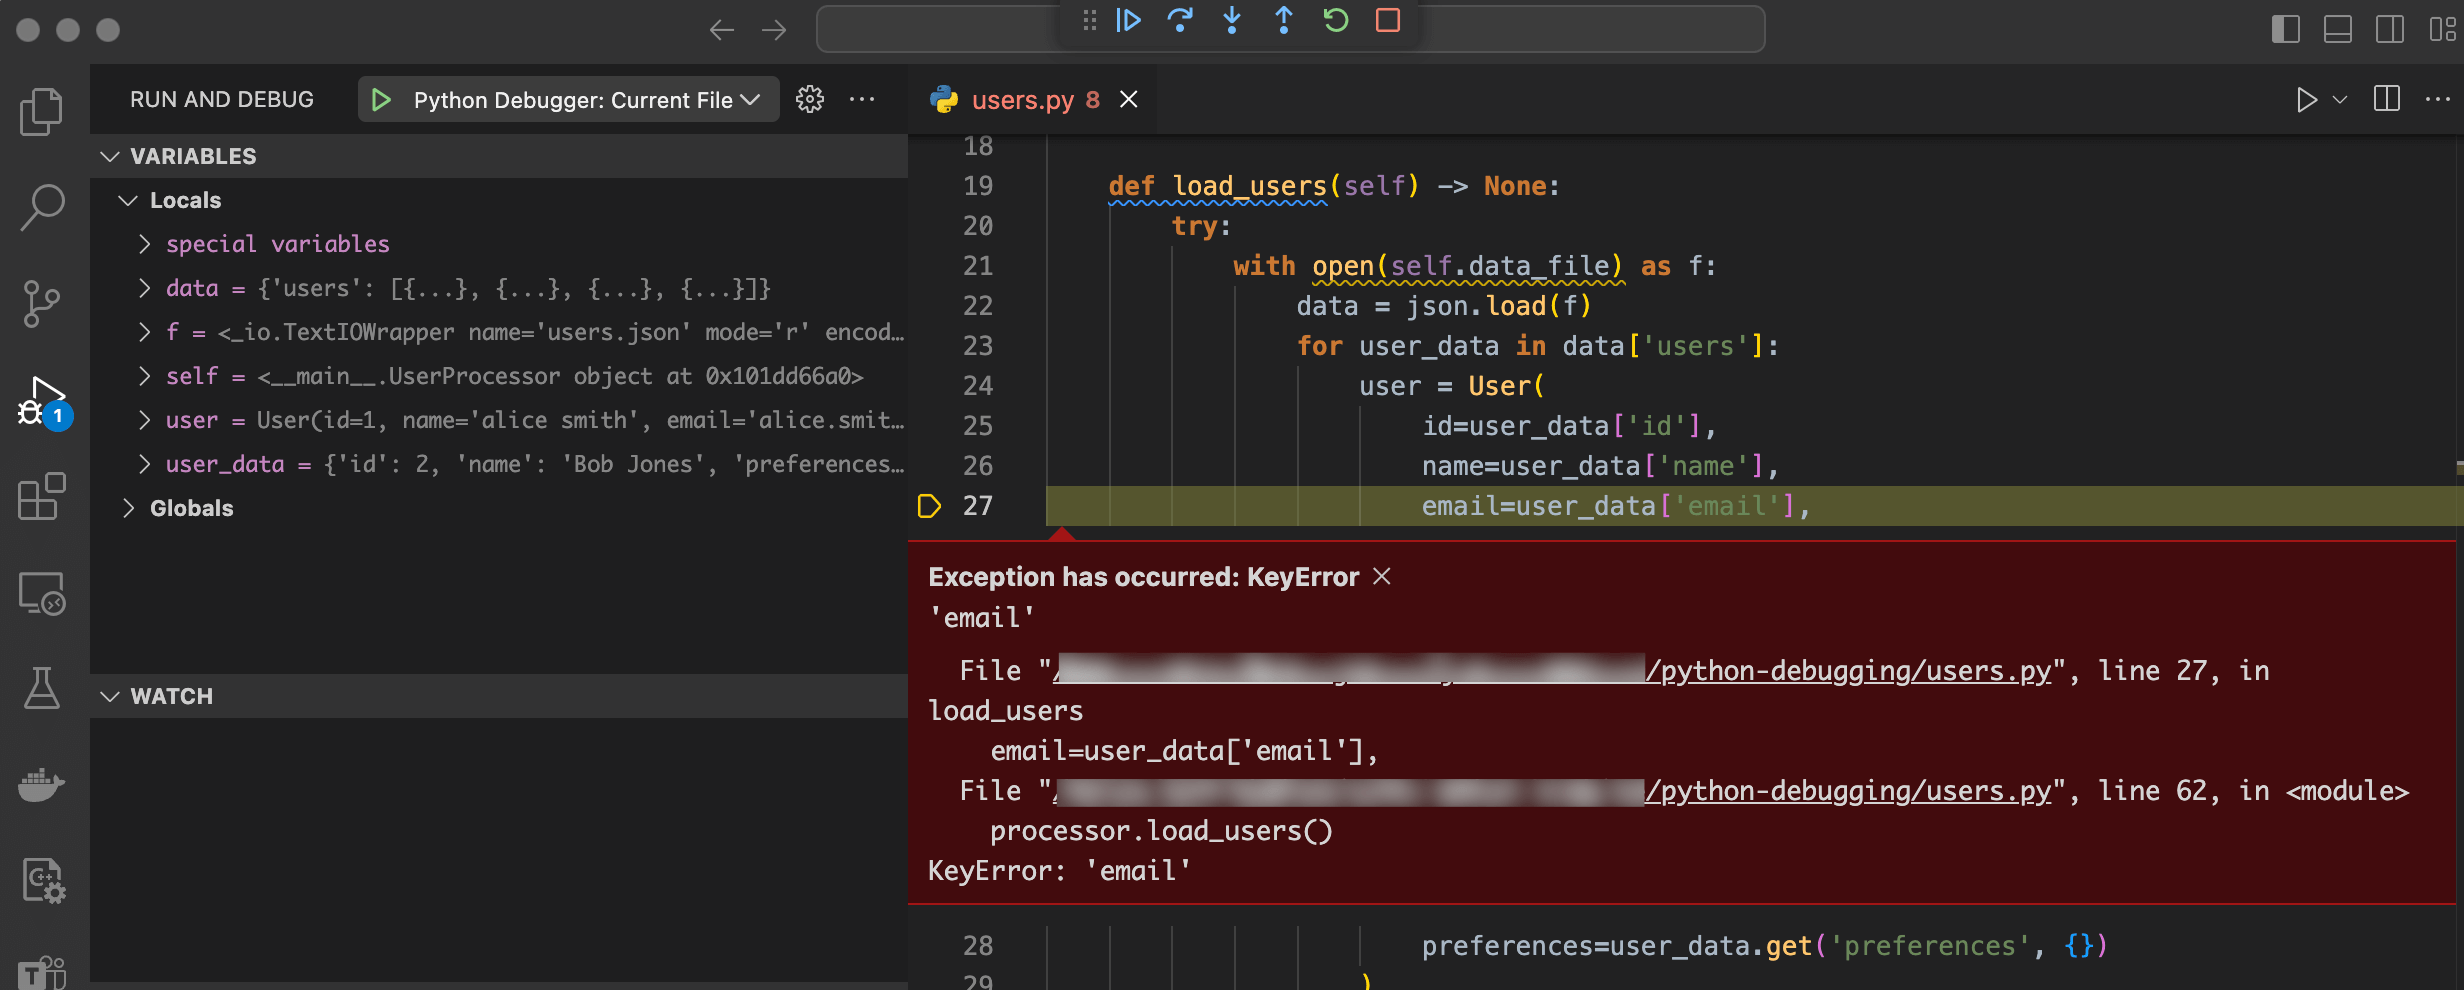
Debugging the code should now produce the following KeyError exception:
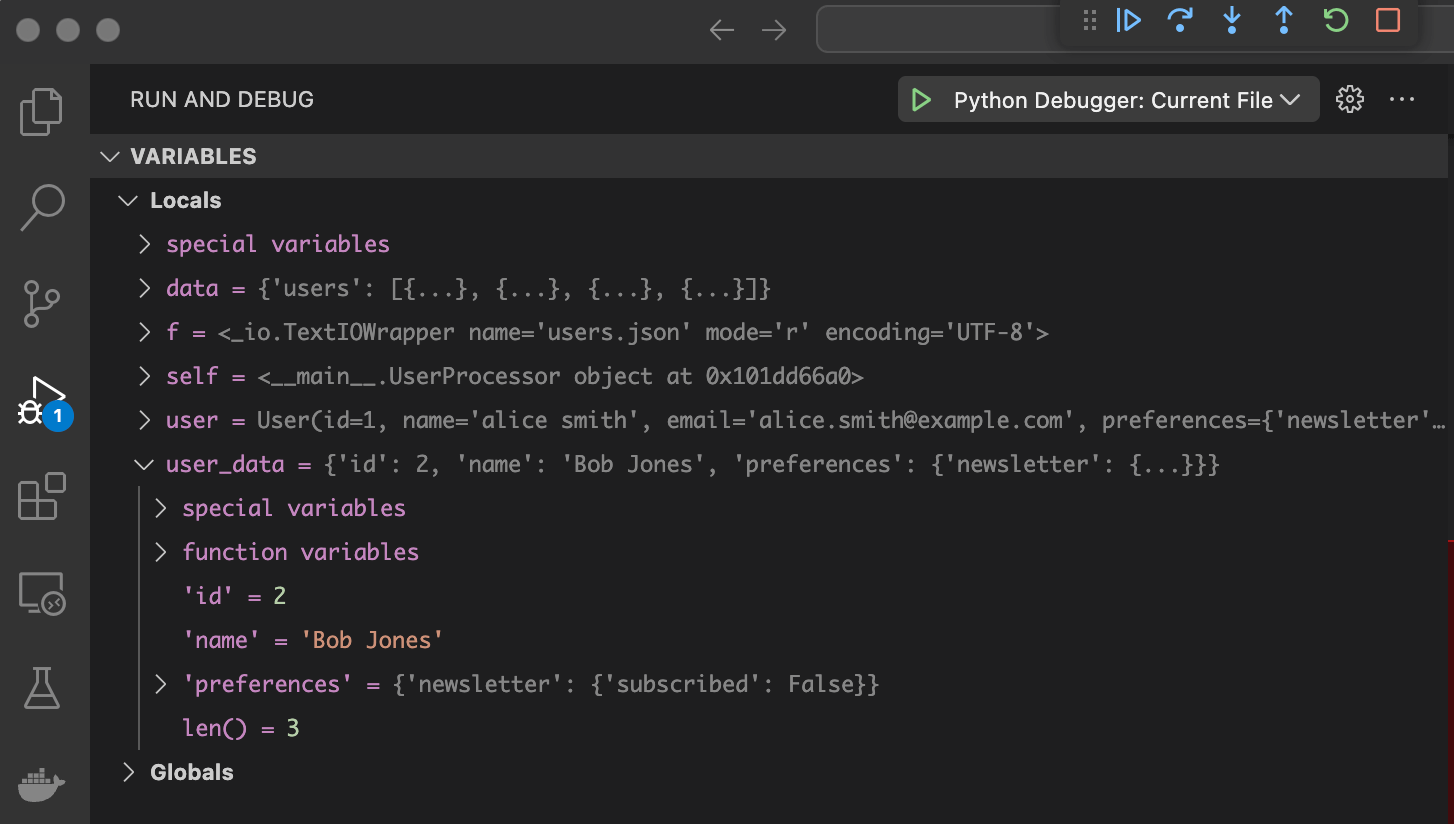
This error tells us that the email key is missing from the user_data dictionary in the current iteration of the for loop. As users.json only contains four entries, you've probably already noticed which is causing the error. But imagine that instead of the four entries, user.json contained thousands of entries. Manually searching for the entry that caused the error could become quite tedious. We could get there quicker by adding print() statements to the code, but there's a better way: the Variables pane.
The topmost pane of the Run and Debug sidebar lists the local and global variables and their values that are in use by the running script. If we expand the user_data variable in Locals, we can see that the KeyError excepted was caused by the users.json item with 'id' = 2 and 'name' = 'Bob Jones'.
Returning to users.json, we can see the problem – this user does not have an email field.
json
{
  "id": 2,
  "name": "Bob Jones",
  "preferences": {
    "newsletter": {
      "subscribed": false
    }
  }
}
How you solve this issue will depend on the nature and requirements of the application. You could do any of the following:
Reject the entire
users.jsonfile as invalid and exit.Skip users with missing fields.
Set the values of missing fields to
Noneor a sensible default value.
In most instances, a mixture of options 2 and 3 is probably best, depending on the field that's missing. Let's rewrite load_users() to do the following:
Skip users with missing
'id'or'name'values.Set missing
'email'values toNone.Set missing
'preferences'values to{ "newsletter": { "subscribed": False }}.
def load_users(self) -> None:
    try:
        with open(self.data_file) as f:
            data = json.load(f)
            for user_data in data['users']:
                uid = user_data.get('id', None)
                name = user_data.get('name', None)

                if not uid:
                    print("[-] Skipping user without ID")
                    continue

                if not name:
                    print("[-] Skipping user without name")
                    continue

                user = User(
                    id=uid,
                    name=name,
                    email=user_data.get('email', None), # email defaults to None
                    preferences=user_data.get('preferences', { "newsletter": { "subscribed": False }}) # preferences default to no newsletter subscription
                )
                self.users.append(user)
    except FileNotFoundError:
        print("[!] The file 'users.json' was not found. Exiting...")
        sys.exit()
    except json.decoder.JSONDecodeError: # NEW EXCEPT BLOCK
        print("[!] The file 'users.json' contains invalid JSON. Exiting...")
        sys.exit()
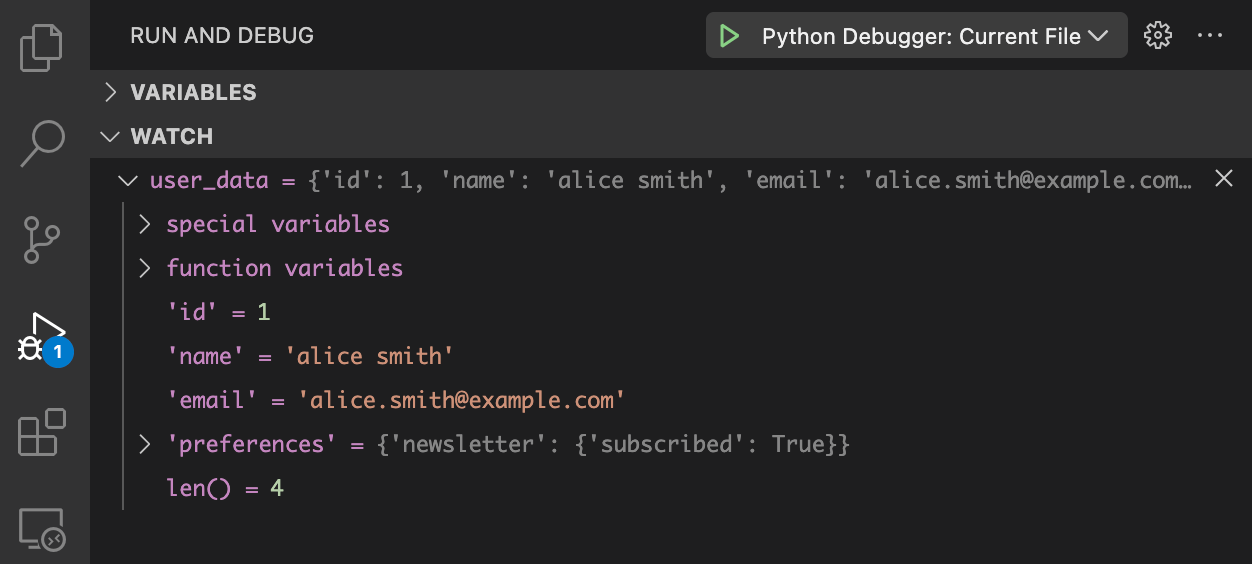
While the Variables pane provides a list of all global and local variables, you may not always want to browse through it, especially in larger and more complicated programs. To this end, the Watch pane allows you to monitor specific expressions.
For example, you can add user_data to the Watch pane by clicking the + button in its top-right corner and typing user_data. Then, whenever a local variable named user_data is in scope, it will be displayed in Watch, as below:
Tracing program flow in VS Code
Before we move on to debugging the next error, let's take a moment to follow the program's execution with the debugger. We'll do this using breakpoints. To set a breakpoint in VS Code, hover the cursor over a line number in the left margin of a Python file. A red dot should appear along with the tooltip Click to add a breakpoint. Clicking will set the breakpoint, leaving a red dot next to the line number. To unset the breakpoint, click the dot again.
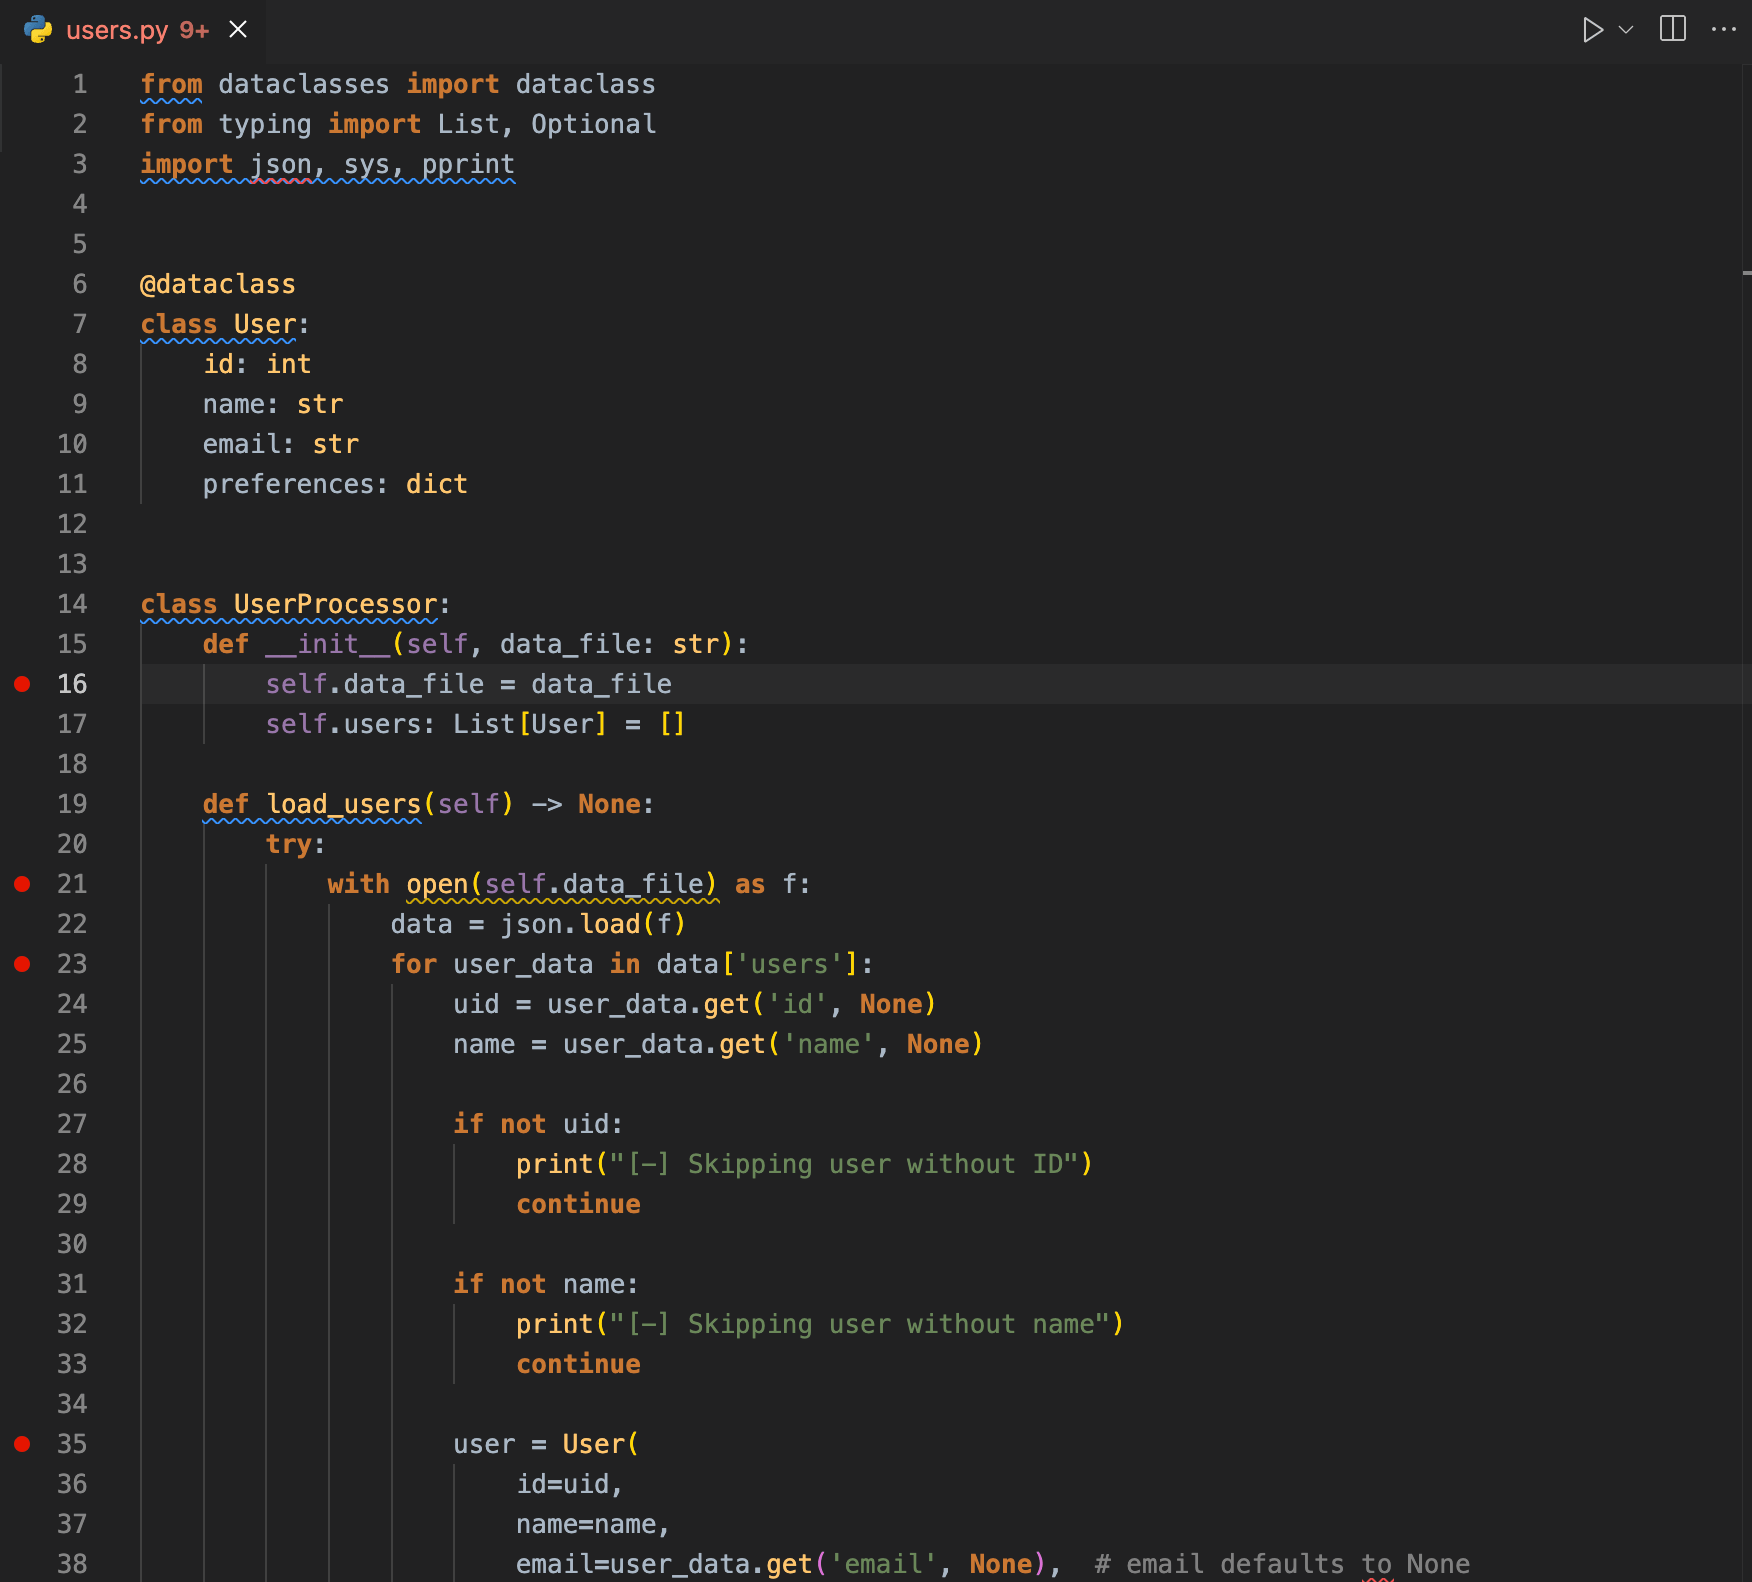
Set breakpoints as shown in the image below so that we can step through the program execution:
Breakpoint 1 on line 16: This will pause the execution of the program at the beginning of the
__init__function.Breakpoint 2 on line 21: This will pause execution on the
withstatement near the top ofload_users.Breakpoint 3 on line 23: This will pause execution at every iteration of the
forloop inload_users.Breakpoint 4 on line 35: This will pause execution when we go to actually create a new user in
load_users.
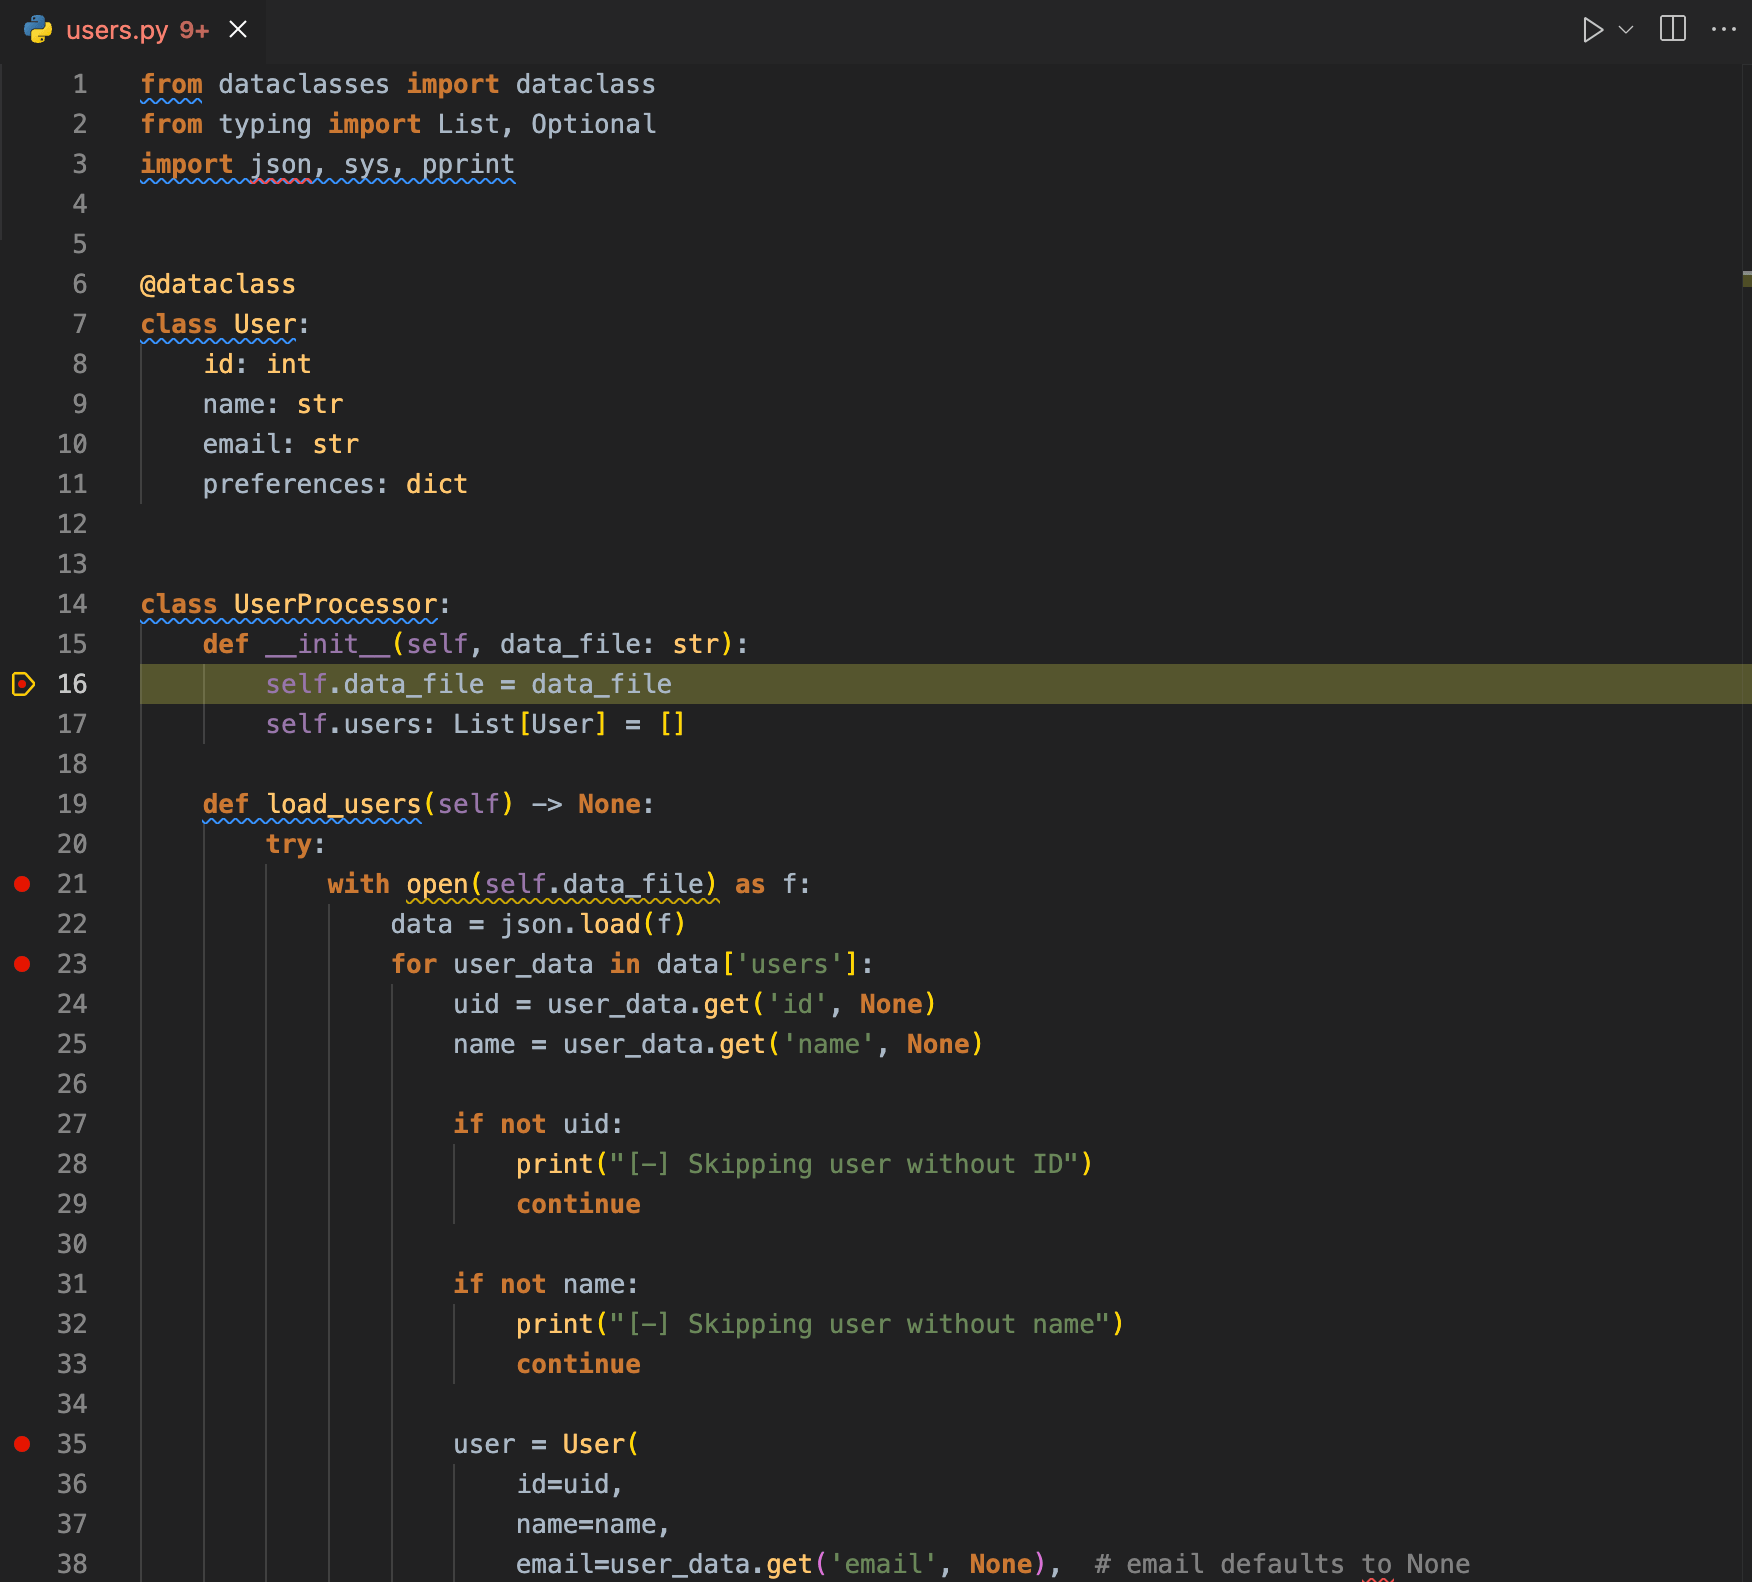
Run and debug the script. Execution will pause at the first breakpoint on line 16:
self.data_file = data_file
Click the Continue button in the debugging controls at the top of the screen to proceed to the next breakpoint on line 21:
with open(self.data_file) as f:
From this breakpoint, press Step Into to proceed into the body of the with block. This will take you to the next line inside the with block on line 22:
data = json.load(f)
Note: If you had pressed Continue or Step Over you would have moved on to the breakpoint on line 23. You can find a fairly simple overview of these functions in this article.
Press Step Into again, you'll arrive at the next breakpoint on line 23:
for user_data in data['users']:
From here, use Step Into to move through the code line by line until you reach the next breakpoint. Watch the Variables and Call Stack panes in the sidebar and note how they change as you move through the program's flow.
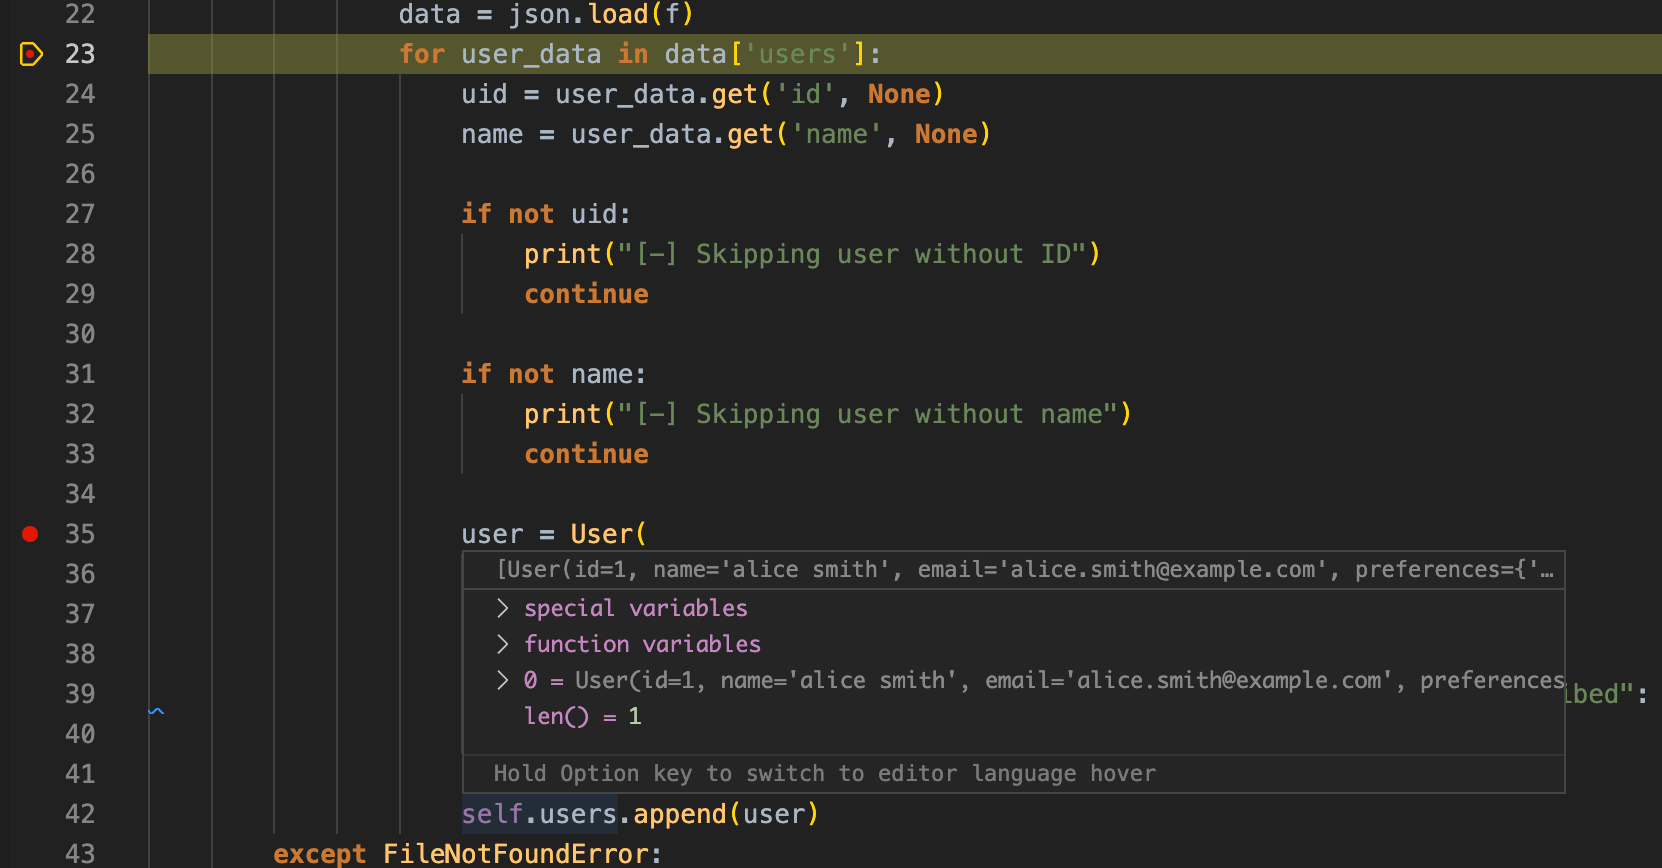
At the final breakpoint on line 35, take a moment to hover the cursor over self.users. A popup will appear showing the current value of self.users – it's empty.
Now click Continue to jump to the breakpoint at the start of the next loop iteration. Before continuing or stepping into the next loop iteration, hover over self.users again. You should see that it now contains a single entry.
During debugging, you can view the live values of variables in the Watch pane or by hovering over places where they're used in the code.
Step through the code until you pass all the breakpoints and encounter the next exception.
Reminder: Once you've resolved all of your exceptions, remove the breakpoints by clicking on each of the red dots.
Setting Logpoints to debug AttributeError exceptions in VS Code
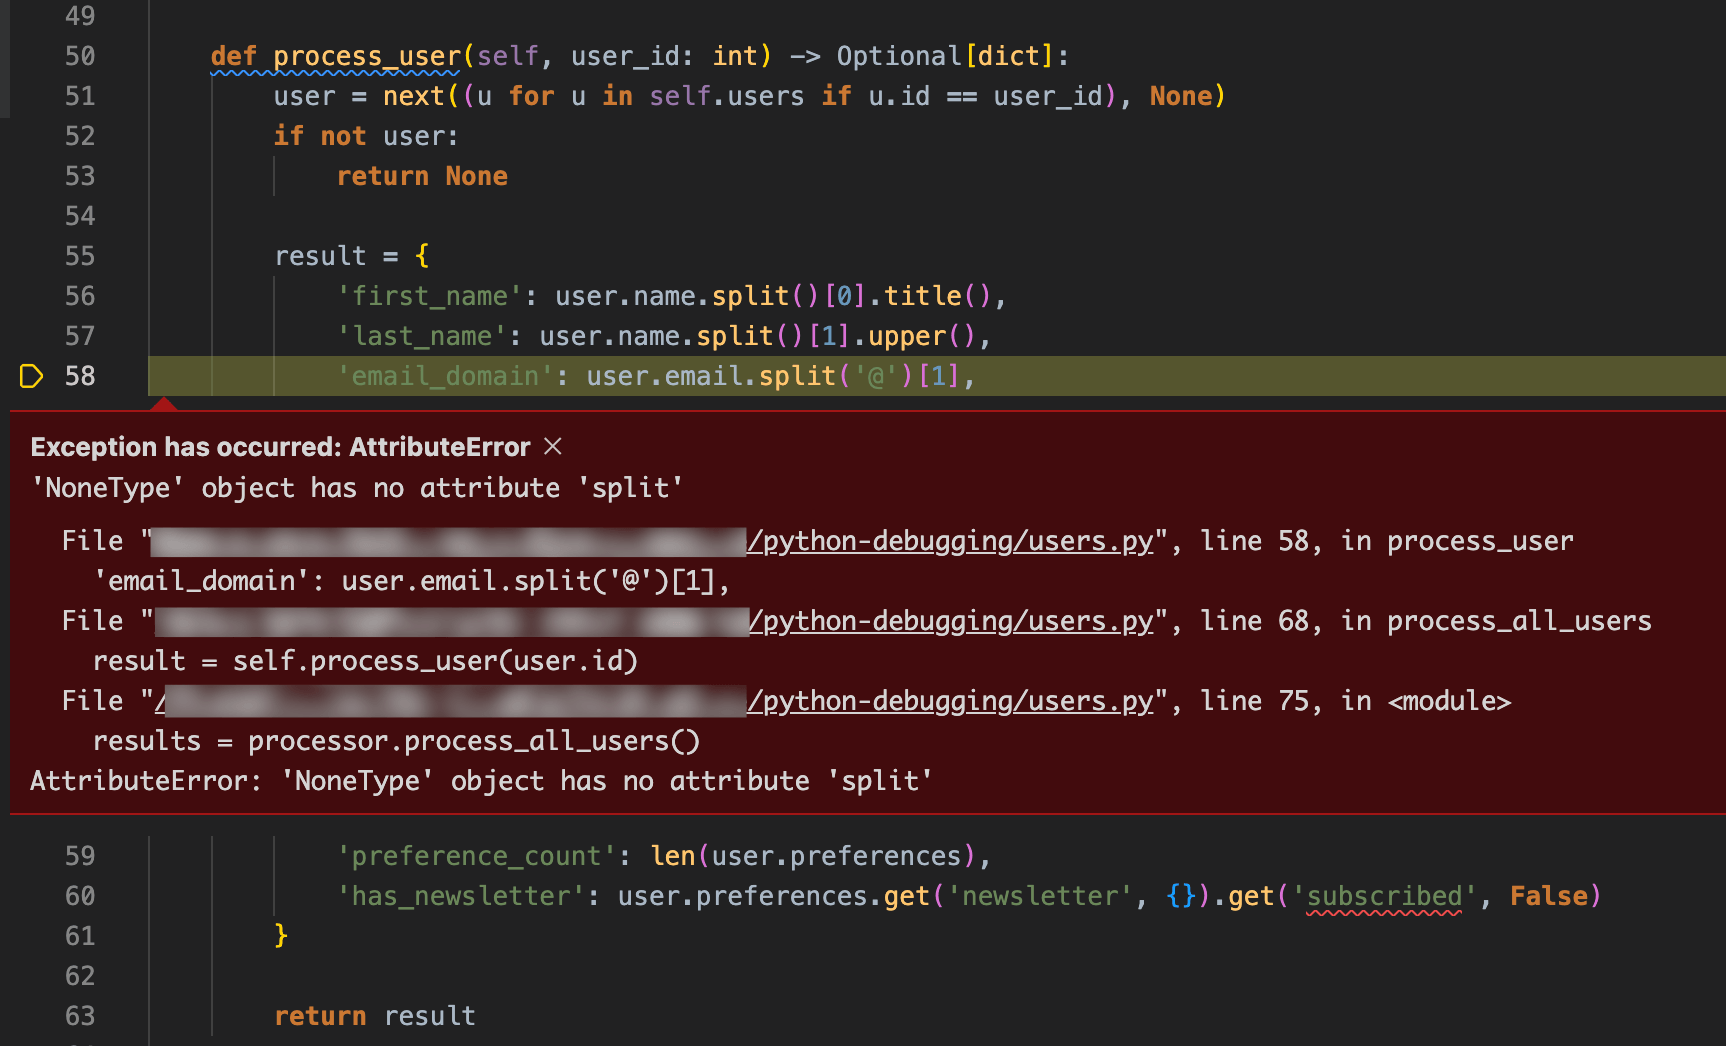
AttributeError exceptions in VS Code With our load_users function debugged and our breakpoints removed, re-run the program to see if we have any other errors. The next bug we encounter an AttributeError exception in the process_user function on line 58:
'email_domain': user.email.split('@')[1],
An AttributeError exception occurred because we are attempting to use the split method on a NoneType variable. By hovering over user or looking at the Variables pane, you can see that the user causing the error is again "Bob Jones", with the ID "2".
Another, more explicit way to see this information is to set a Logpoint. This is a type of breakpoint that outputs a message when it's hit, kind of like a temporary print statement. This message can contain code within {} symbols, similar to formatted string literals.
Right-click line 58 (which starts with 'email_domain:' and choose Add Logpoint... from the menu. Then type the following into the text box that appears:
Extracting domain from email: {user.email}
Restart debugging. The script will run until it hits the AttributeError. The logs from the new Logpoint will be displayed in the Debug Console, which is one of the tabs of VS Code's embedded terminal. The Debug Console should look something like this:
We'll fix this error by adding some logic to check whether user.email is "None" before attempting to extract a domain from it. Make the following change to process_user:
def process_user(self, user_id: int) -> Optional[dict]:
    user = next((u for u in self.users if u.id == user_id), None)

    if not user:
        return None

    result = {
        'first_name': user.name.split()[0].title(),
        'last_name': user.name.split()[1].upper(),
        'email_domain': user.email.split('@')[1] if user.email else None,
        'preference_count': len(user.preferences),
        'has_newsletter': user.preferences.get('newsletter', {}).get('subscribed', False)
    }

    return result
Use conditional breakpoints while stepping through code execution in VS Code
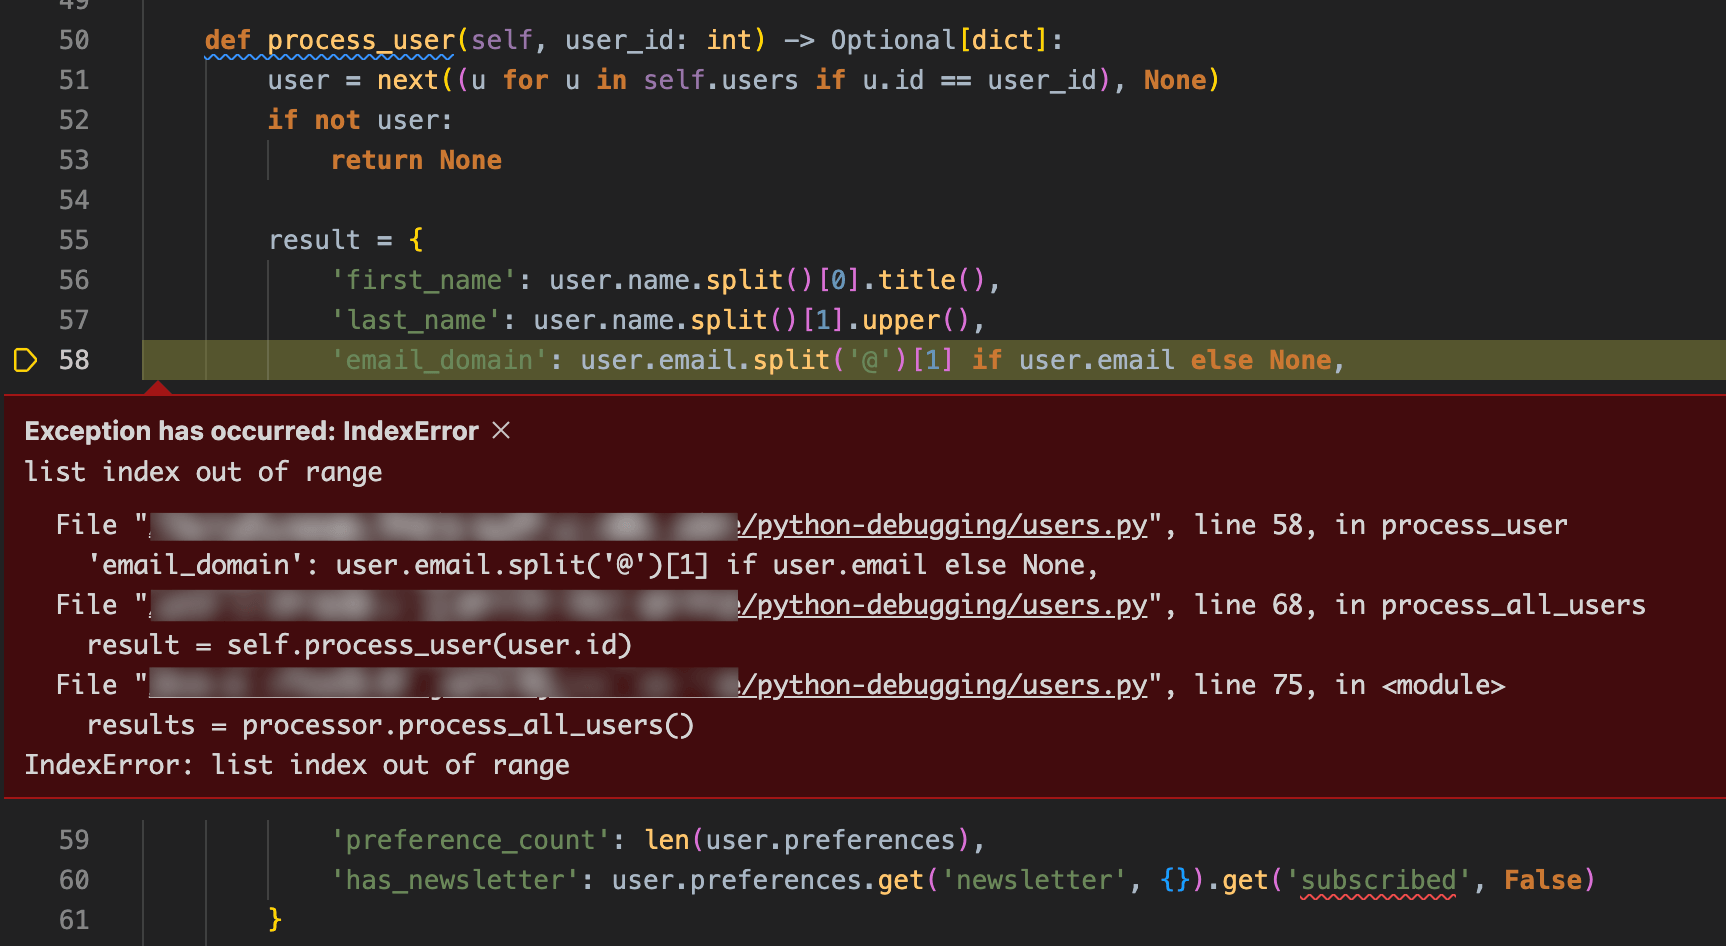
The next time we run our script, we should run into a different exception, still on line 58, the line starting with 'email_domain':. This time, it's an IndexError exception. We will assume that this occurs because the email address we've attempted to split is missing an @ sign.
To investigate this bug further, you need to set a breakpoint on line 57, just before the email address gets processed. However, this breakpoint will pause execution on each user and we're only interested in the processing of the user with the ID "4". To this end, you can set a conditional breakpoint, which will only pause execution if a given expression evaluates to true (e.g. only if user.id == 4). Set a conditional breakpoint:
Right-click on the left margin on line 57 (the one that starts with
'last_name':).Select Add Conditional Breakpoint from the menu.
Type the following expression into the text box that appears and press enter:
user.id == 4
Run and debug the script, and execution will pause on line 57, but only during the processing of the fourth user.
We already know that the next line (line 58) will throw an IndexError exception, and we assume this happens because the user's email address is missing an @ sign. We can test that assumption quickly and without changing any code, as the debug console allows us to run arbitrary Python code. Let's use this functionality to fix the faulty email address.
Open the Debug Console tab in VS Code's integrated terminal near the bottom of the screen.
Enter the following code into the Debug Console and press enter:
user.email = "daisy.johnson@example.com"
3. Hover over user.email somewhere in the code to confirm that the change has been applied. 4. Continue execution. The script should now be complete without errors, and the following output should be printed to the Terminal tab.
[-] Skipping user without name [{'email_domain': 'example.com', 'first_name': 'Alice', 'has_newsletter': True, 'last_name': 'SMITH', 'preference_count': 1}, {'email_domain': None, 'first_name': 'Bob', 'has_newsletter': False, 'last_name': 'JONES', 'preference_count': 1}, {'email_domain': 'example.com', 'first_name': 'Daisy', 'has_newsletter': False, 'last_name': 'JOHNSON', 'preference_count': 1}]
Now that we've confirmed the source of the error, we'll fix it by editing users.json to fix Daisy's email address, as below.
json
{
  "users": [
    {
      "id": 1,
      "name": "alice smith",
      "email": "alice.smith@example.com",
      "preferences": { "newsletter": { "subscribed": true } }
    },
    {
      "id": 2,
      "name": "Bob Jones",
      "preferences": { "newsletter": { "subscribed": false } }
    },
    { "id": 3, "email": "carol.wilson@example.com" },
    { "id": 4, "name": "daisy johnson", "email": "daisy.johnson@example.com" }
  ]
}
Alternatively, we could alter the code to attempt to fix the malformed address or reject it entirely.
Debugging Python with Sentry
We've now fixed all of the bugs that revealed themselves through our testing data and learned a lot about VS Code's powerful debugging features in the process. However, the code may still contain further bugs. While we can find a lot of these by doing additional testing with different data, some bugs will only become apparent with exposure to real-world data and real users. This will likely happen once the code has been deployed to production.
We can integrate Sentry into our Python script to give us powerful tools for continuous debugging outside the local development environment. To demonstrate this, we'll add the Python sentry_sdk module to the script, along with some breadcrumbs and error capturing in the process_user function.
First, install the Sentry Python SDK:
pip install sentry_sdk
Login to Sentry (or create an account) and set up a Python project.
Now we will modify our Python script so that Sentry can capture our errors:
Import the
sentry_sdkand add thesentry_sdk.initfunction to the top of your Python scriptReplace the text
YOUR-DSN-HEREwith your Sentry project's DSN.
At the top of your
process_userfunction, make sure you're adding a Sentry breadcrumb. This will help us create a trail of events that happen prior to an error. Make sure you're including information, such asuser_id.In key places throughout your process_user function, make sure to include other breadcrumbs. For example, if the user doesn't exist, add a breadcrumb.
Where you would raise an exception, ask the Sentry SDK to capture that exception before you raise it.
Your Python script should now look like this:
from dataclasses import dataclass
from typing import List, Optional
import json, sys, pprint

import sentry_sdk

sentry_sdk.init(
    dsn="YOUR-DSN-HERE", # <-- REPLACE WITH YOUR SENTRY DSN
    # Set traces_sample_rate to 1.0 to capture 100%
    # of transactions for tracing.
    traces_sample_rate=1.0,
    # Set profiles_sample_rate to 1.0 to profile 100%
    # of sampled transactions.
    # We recommend adjusting this value in production.
    profiles_sample_rate=1.0,
)

@dataclass
class User:
    id: int
    name: str
    email: str
    preferences: dict

class UserProcessor:
    def __init__(self, data_file: str):
        self.data_file = data_file
        self.users: List[User] = []

    def load_users(self) -> None:
        try:
            with open(self.data_file) as f:
                data = json.load(f)
                for user_data in data['users']:
                    uid = user_data.get('id', None)
                    name = user_data.get('name', None)
                    if not uid:
                        print("[-] Skipping user without ID")
                        continue

                    if not name:
                        print("[-] Skipping user without name")
                        continue

                    user = User(
                        id=uid,
                        name=name,
                        email=user_data.get('email', None), # email defaults to None
                        preferences=user_data.get('preferences', { "newsletter": { "subscribed": False }}) # preferences default to no newsletter subscription
                    )
                    self.users.append(user)
        except FileNotFoundError:
            print("[!] The file 'users.json' was not found. Exiting...")
            sys.exit()
        except json.decoder.JSONDecodeError: # NEW EXCEPT BLOCK
            print("[!] The file 'users.json' contains invalid JSON. Exiting...")
            sys.exit()

    def process_user(self, user_id: int) -> Optional[dict]: # Sentry breadcrumb
        sentry_sdk.add_breadcrumb(
            category='user_processing',
            message=f'Processing user {user_id}',
            level='info'
        )

        user = next((u for u in self.users if u.id == user_id), None)
        if not user: # Sentry breadcrumb
            sentry_sdk.add_breadcrumb(
                category='user_processing',
                message=f'User {user_id} not found',
                level='warning'
            )
            return None

        try:
            result = {
                'first_name': user.name.split()[0].title(),
                'last_name': user.name.split()[1].upper(),
                'email_domain': user.email.split('@')[1] if user.email else None,
                'preference_count': len(user.preferences),
                'has_newsletter': user.preferences.get('newsletter', {}).get('subscribed', False)
            }
        except Exception as e:
            # Sentry breadcrumb
            sentry_sdk.add_breadcrumb(
                category='user_processing',
                message='Error processing user data',
                level='error',
                data={
                    'user_id': user_id,
                    'user_data': {
                        'name': user.name,
                        'email': user.email,
                        'preferences': user.preferences
                    }
                }
            )
            # Sentry error capture
            sentry_sdk.capture_exception(e)
            raise e
        return result

        def process_all_users(self) -> List[dict]:
            results = [] for user in self.users:
                result = self.process_user(user.id)

                if result:
                    results.append(result)

            return results

processor = UserProcessor('users.json')
processor.load_users()
results = processor.process_all_users()
pprint.pprint(results)
The script is now ready to report errors to Sentry. So let's see this in action by adding another malformed user to users.json, as follows:
```
json {
  "users": [
    {
      "id": 1,
      "name": "Alice Smith",
      "email": "alice.smith@example.com",
      "preferences": { "newsletter": { "subscribed": true } }
    },
    {
      "id": 2,
      "name": "Bob Jones",
      "preferences": { "newsletter": { "subscribed": false } }
    },
    { "id": 3, "email": "carol.wilson@example.com" },
    { "id": 4, "name": "Daisy Johnson", "email": "daisy.johnson@example.com" },
    { "id": 5, "name": "Eve", "email": "eve@example.com" }
  ]
}
```
As this user has only a first name, the code should encounter an error when trying to extract and format their last name. Test to make sure an exception is thrown by running the code now.
After the code runs, a new issue will appear on the Sentry dashboard, complete with the exception details and the breadcrumbs leading up to it. Sentry also provides us with the values of relevant local variables such as user and user_id, which can be used to debug this issue in a similar way to how we've debugged other issues with VS Code above.
Other debugging tools Sentry offers
In addition to error and exception monitoring, Sentry offers a number of other monitoring and debugging tools that are useful for Python developers. For example, if you have a larger application than the example we have in this post, you might have considered adding logging. Sentry can integrate with your logging module and help you fix issues faster by avoiding digging through those logs because you can leverage them as part of a richer Sentry debugging experience.
Additionally, Sentry is not only useful for when something breaks. Sentry's performance support for Python is extensive and the performance of your application is critical to your users' experience and something every developer should prioritize.
Quickly debug and confidently deploy your Python application
In this tutorial, you’ve learned how to debug Python while developing with VS Code and after it's been deployed with Sentry. Using these methods, you can quickly identify, understand, and resolve issues, reducing application downtime and leveling up your debugging skills. Whether you're debugging simple errors or tackling more complex application issues, Sentry and VS Code are key to maintaining high-quality code. If you haven't yet, set up Sentry for free to start monitoring your Python application and join our discord.
