Debug Front-End Errors with Sentry
Debug Front-End Errors with SentryOut of the box, Sentry notifies you about crashes in your JavaScript apps and gives you useful tools to help you debug what your app was doing when it broke. If Sentry stopped there, it would still be a valuable application monitoring tool, but it’s possible to maximize your front-end debugging potential with just a few manual optimizations.
In this post, I’ll explain how to use fingerprints, breadcrumbs, tags, and flags to make Sentry a truly invaluable debugging tool for front-end engineers.
Group errors your way with fingerprints
One of Sentry’s most useful features is that we aggregate similar error events to create groups of Issues. This grouping is determined by a fingerprint — a single string value that is derived per-event. By default, Sentry derives this fingerprint by concatenating and hashing the event’s stack trace content (ignoring frames from node_modules or known libraries). If there is no stack trace (it happens), Sentry derives a fingerprint solely from the error message string (e.g., "undefined is not a function").
Take a look at our Rollup and Grouping documentation for a more in-depth look at how Sentry groups errors.
This strategy provides a good out-of-the-box fingerprint for most errors, but not all of them. For example, if you’re using a custom error handler to catch errors, even if those errors are unique the stack trace generated by the handler might not be. And since the grouping fingerprint is derived by the stack trace, those errors may all get grouped into a single issue — which makes identifying and resolving the underlying problems challenging.
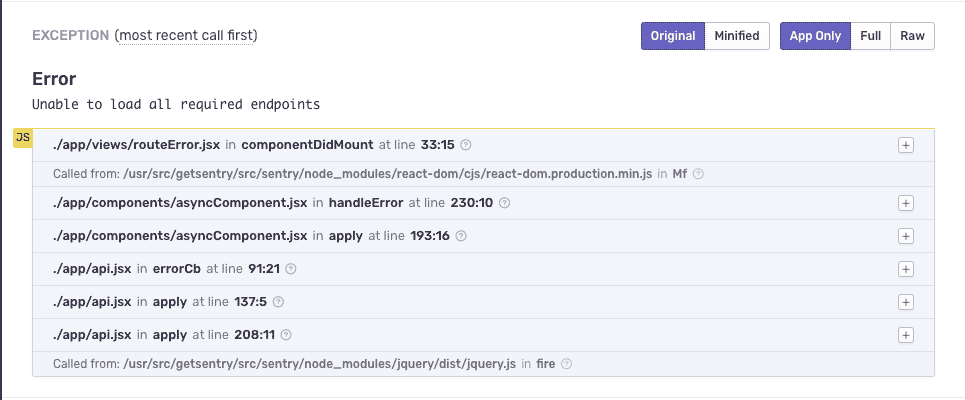
To illustrate, let’s use a real-world example. At Sentry, we use a React component named AsyncComponent that parallelizes any necessary API requests to the web server before rendering. If any of those requests fail, we create a new Error object that gets passed to a RouteError component which displays an error dialog. Below is a simplified version:
class AsyncComponent extends React.Component {
componentDidMount() {
fetch(this.props.endpoint).catch(() => {
this.setState({
error: new Error('Unable to load all required endpoints'),
});
});
}
render() {
if (this.state.error) {
return <RouteError error={this.state.error} />; // shows crash dialog
}
return this.props.children(this.state);
}
}AsyncComponent is a handy utility class that we use throughout our application, but it has a significant drawback: the generated stack trace will be the same for any API failures, regardless of what component or file is implementing AsyncComponent. In which case, this error will be grouped together in Sentry even if the requests are failing from different areas of your application.
To remedy this, you can set your own custom fingerprint. For example, we can derive a fingerprint from the URL that triggered the exception:
Sentry.withScope(scope => {
  scope.setFingerprint([window.location.pathname]);
  Sentry.captureException(error);
});
Doing this will ensure that distinct failures will be grouped separately, e.g., a failure triggered on one URL is treated distinctly from a failure treated on a different URL. You could optionally fingerprint the child component’s display name instead by passing it to RouteError as a prop.
Note that if you have dynamic values inside of those URLs (e.g., a username in the path), you need to parameterize those values when generating the fingerprint or you’ll create a unique fingerprint for each distinct value. For example, "/user/:username" likely provides a more helpful fingerprint than "/user/janedoe".
Custom fingerprints can be deployed in a number of ways. If you find yourself with a bunch of front-end errors that feel like they could be grouped differently, examine how you’re capturing those errors and if you can introduce a custom fingerprint to separate them.
See the whole picture with breadcrumbs
By default, the Sentry browser SDK automatically collects breadcrumbs, a trail of events that happened before the issue. If the stack trace tells you where in the code the error occurred, breadcrumbs uncover what the application was doing before that exception occurred.
Some example breadcrumbs that get collected include user navigation, HTTP requests via fetch and/or XHR API, DOM interactions (clicks), and messages logged via console (see a full list here). This information can be crucial in determining the cause of a bug, especially when the stack trace is particularly opaque (e.g., a bug occurring deep in your rendering library’s virtual DOM reconciler).
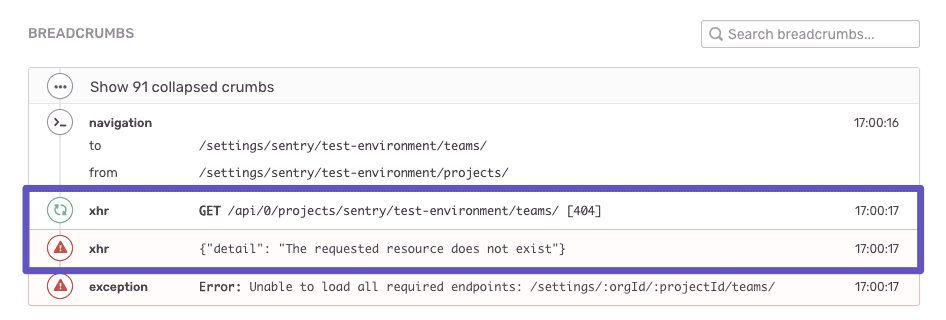
Take a look at the following example set of breadcrumbs, which reveal how a user’s actions triggered an exception. The user navigated from the “Projects” view to the “Teams” view, but they don’t have access to fetch a list of teams; the response from that endpoint returned 404.
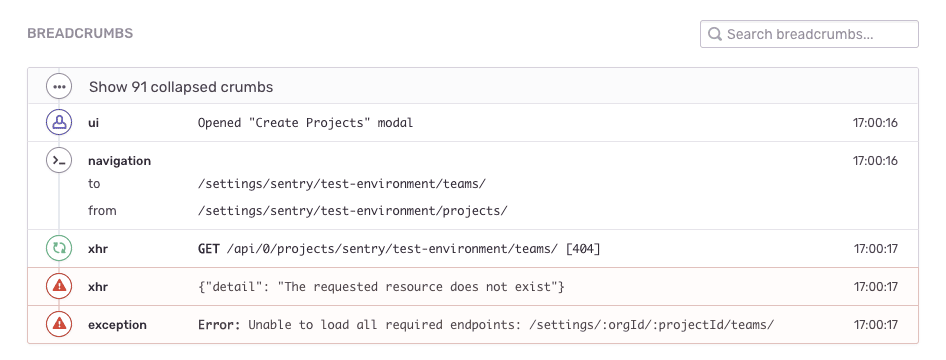
Sentry’s default breadcrumbs are helpful on their own, but you can also add breadcrumbs that are more specific to your application. For example, if you have a function to open a modal, you can add a Sentry breadcrumb every time a modal is opened.
export function openModal(renderer, options) {
  ModalActions.openModal(renderer, options);
  Sentry.addBreadcrumb({
    category: 'ui',
    message: `Opened "${options.title}" modal`,
    level: 'info',
    type: 'user',
  });
}
If an error occurs after opening a modal, the corresponding breadcrumb trail in Sentry looks something like this:
If you’re using a state management library, you might be able to hook into that library to automatically capture actions or state change as breadcrumbs. For instance, if you’re using Redux, you can add middleware to capture all redux actions as a breadcrumb, e.g., raven-for-redux.
Filter and segment errors with tags
Tags are key/value pairs that are assigned to each event that provide opportunities for quick search and observation on how errors impact your users.
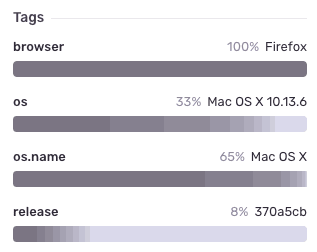
You can use Sentry’s search to identify issues that are tagged with a specific key/value pair (e.g., find every issue that was triggered by browser:Firefox), as well as understand the breakdown of tag values for a given issue (e.g., 100% of events in this issue were triggered by Firefox). Sentry client SDK’s automatically populate default tags like browser and os for you.
It’s also possible to attach your own custom tags to events. For example, you could set a custom tag that identifies what a logged-in customer’s subscription (or billing plan) they’re on. This could be helpful to identify errors that are occurring only for a specific customer segment.
Adding the tag is as simple as adding these three lines of code:
Sentry.configureScope((scope) => {
  scope.setTag("subscription", subscription.name);
});
Once events start coming in attached with this tag, you’ll be able to see their breakdown in Sentry’s UI. In the screenshot below, subscription is a captured as a custom tag and we see that all errors are coming from the “Enterprise” subscription.
Of course, subscription is just one potential key/value pair you could tag your events with. Take a look at your product, and see if there are other applications, environments, or user states you could be tagging. Doing so will give you invaluable additional context for searching and better understanding the scope of impact of your issues.
Record complex state as additional data
Tags are one way to record state, but they’re limited to simple string values. What happens when you have a more complex application state that could really help you understand what your application was doing at the time of a crash?
Sentry’s client SDKs allow you to record free-form complex objects as additional data (also known as “extra data”), and send them alongside your error events. They aren’t searchable like tags, but they can be crucial to understand complex application state when examining an event in Sentry’s UI.
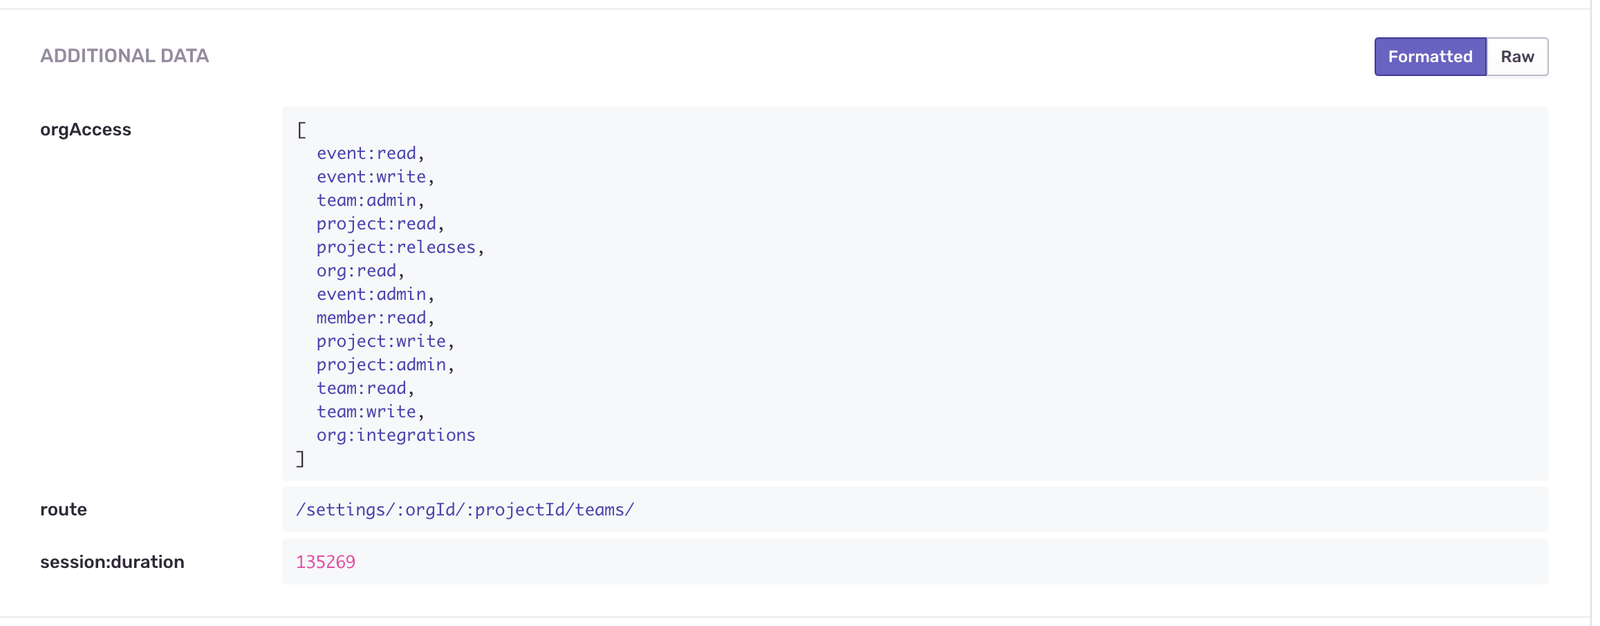
Consider this Sentry JavaScript SDK example which sets up a scope with an extra data property, orgAccess:
Sentry.withScope(scope => {
  scope.setExtra('orgAccess', access);
  Sentry.captureException(error);
});
Sentry engineers use different flags to determine user access to features, from member-level permissions to organization-level feature flags. We make these permissions available as an array of strings, named orgAccess, and send that array as extra data when we use captureException.
If the user is lacking write access to /organizations/:orgId/teams/ and they’re trying to add a Team object, it makes sense that they are receiving an HTTP 403 error.
Here’s what that extra data looks like rendered in Sentry’s UI:
Use extra data to your advantage whenever possible. The more you customize these properties, the more visibility you have into what is happening in your application.
If Sentry only notified you about errors and gave you basic debugging tools to help you fix those errors, you’d be set. But why stop there when you could do more with Sentry? Optimize Sentry’s JavaScript SDK with:
Fingerprints that help organize and declutter your Issues stream.
Breadcrumbs that uncover how and why an error happened, and if it even matters.
Tags that show error distribution.
Additional data that give additional visibility into the user’s environment where the error occurred.
Don’t hesitate to share feedback or ask questions about using fingerprints, breadcrumbs, tags, or extra data (or about anything else Sentry related).
Shout-out to Ben Vinegar for helping ensure this article was not a complete dumpster fire.

