Browser Profiling Learnings from Sentry.io
Browser Profiling Learnings from Sentry.io

Since enabling browser profiling on our Sentry.io dashboard a month ago, we have collected over 2M profiles and learned a lot about how our users experience our dashboard. The profiles collected gave us insight into how our dashboard performs in production and surfaced some issues causing UI jank. In this post, we will look at an example of an issue we discovered using Profiling.
What is Profiling?
Profiling is a method of collecting samples of a program's execution stack during runtime. When it comes to profiling client-side JavaScript code, you may be familiar with high-frequency profilers available through many of the popular browser developer tools, these are profilers that you can run locally and on-demand. JavaScript self-profiling is the same concept, except with a more limited stack sampling frequency, but collected over many different devices with the idea of aggregating data. This enables us to collect real-world production data from many of our users and learn how our code behaves on their system, which can tell us how they experience the product.
How profiling resolves performance issues
Profiling helps proactively identify performance issues, reducing time-to-resolution without relying on customers to report slow or janky behavior. This enables developers to get ahead of performance issues.
For example, before we enabled Profiling here at Sentry, we had a few rough ideas of what user experiences might be slow, but no data to back it up. Typically, a scenario unfolded like this:
Sales Engineer enters the room
Sales Engineer: “Customer x is complaining that their UI is slow when they click y”
Me: “Ok, we’ll take a look” (literally no idea what could be happening)
There are an infinite amount of factors that might be causing the slow experience, ranging from data input problems to browser extensions wreaking havoc, or just our code being inefficient. Even if we could reproduce the issue, we can’t tell if we really fixed the problem for our users. After all, how could we? Our debugging environment differs from that of our user experiencing the problem. So, we create a few hypotheses, sprinkle some performance optimizations, deploy a “fix” and pray that our changes fix the issue.
Me: “We deployed a fix; can you ask if they still have issues?”
Sales Engineer: “The customer says it’s better, but still feels slow”
This is a poor experience for everyone, which just adds frustration upon frustration to our users and undermines trust in our ability to deliver a high-quality service. We need to proactively fix these issues without relying on our users to complain - and this is where Profiling helps.
Let's look at an example performance issue
Sentry’s Performance product automatically collects span information during page-load events. A good place to start is by looking at the most commonly collected spans for our most visited page. It's all about prioritization — we want to find the optimizations that will benefit most of our users and tackle those first, instead of chasing smaller optimizations that will have a little impact.
So let's look at some of the most common spans happening during page load of the most commonly viewed page in Sentry's product interface: the Sentry issues stream page.
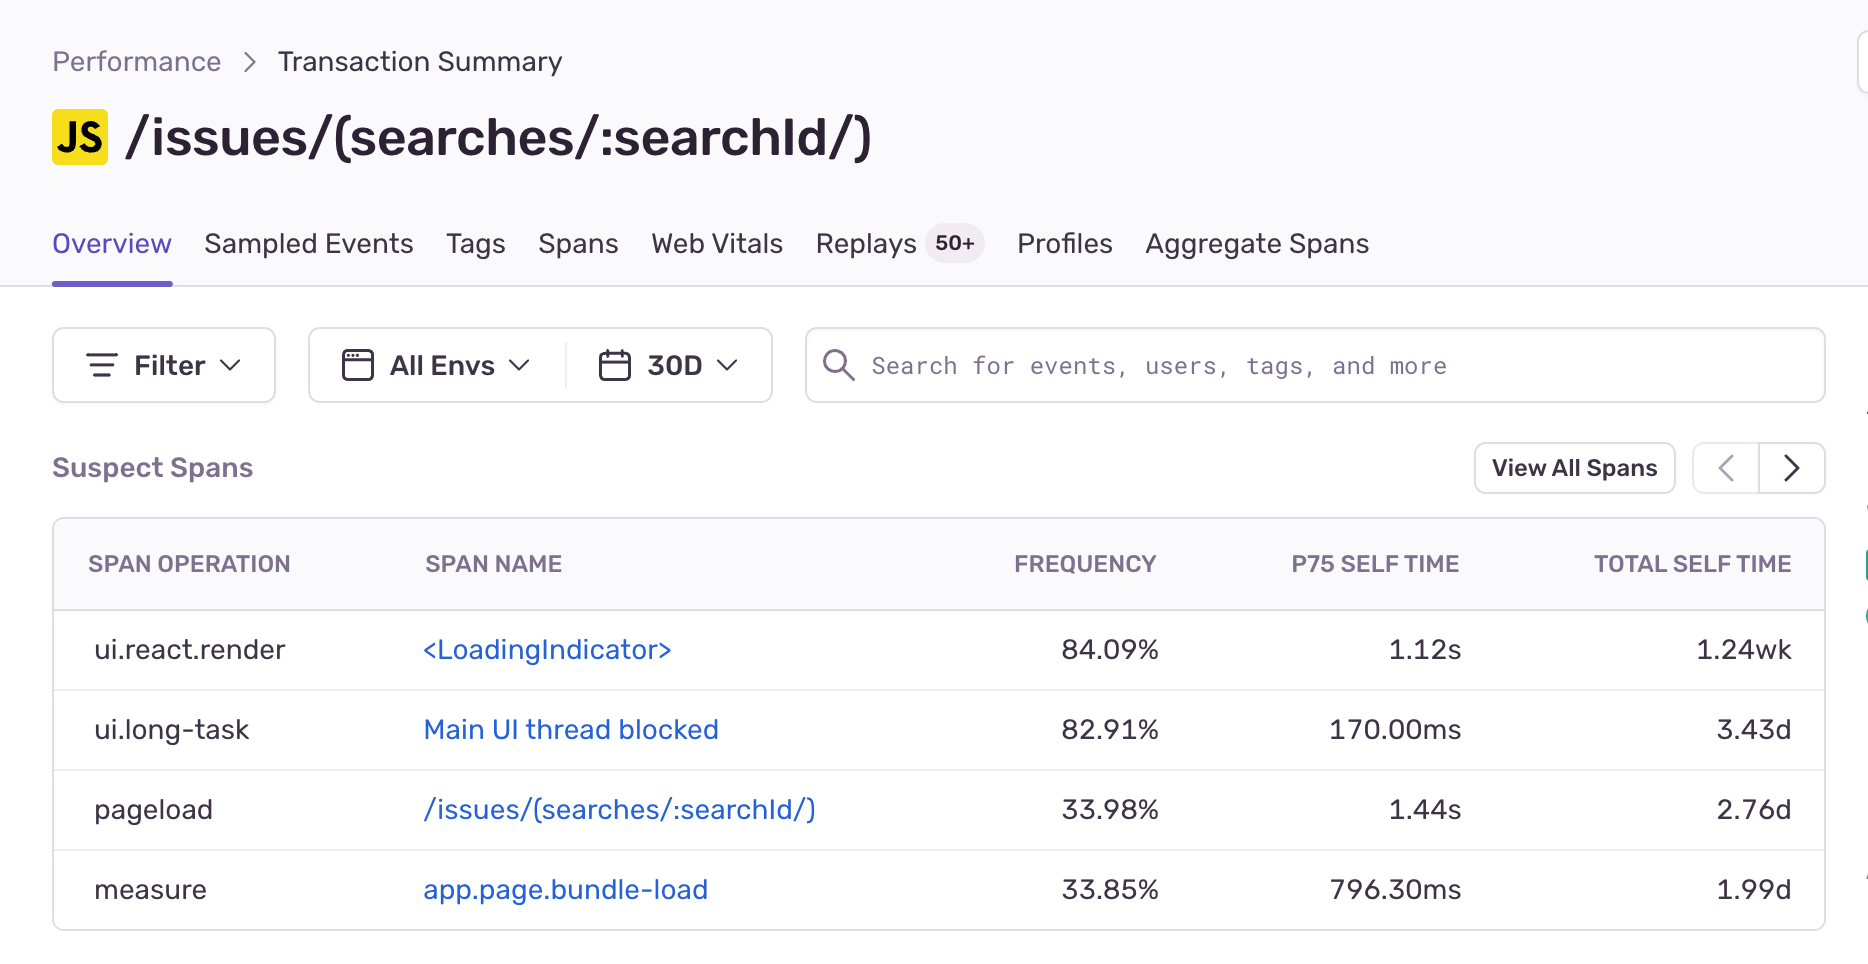
Our second most common span is a UI long task event span, with a frequency of 80% and p75 time of 170ms. The UI long task span indicates UI jank, generated by the browser and collected by the SDK whenever the UI thread is blocked. It causes the browser to drop frames, resulting in slow and janky interactions for users.
It's a good news, bad news situation — while we know a lot of users encounter jank on this page, we still don't know where that jank is coming from.
If this was all the data we had, we’d have to resort to manual debugging and attempt to reproduce the issue. However, with profiling data, we can pinpoint the most commonly executed code during the janky periods, revealing the UI jank culprit.
Let’s open up the flame graph for this page load event and inspect some frames.
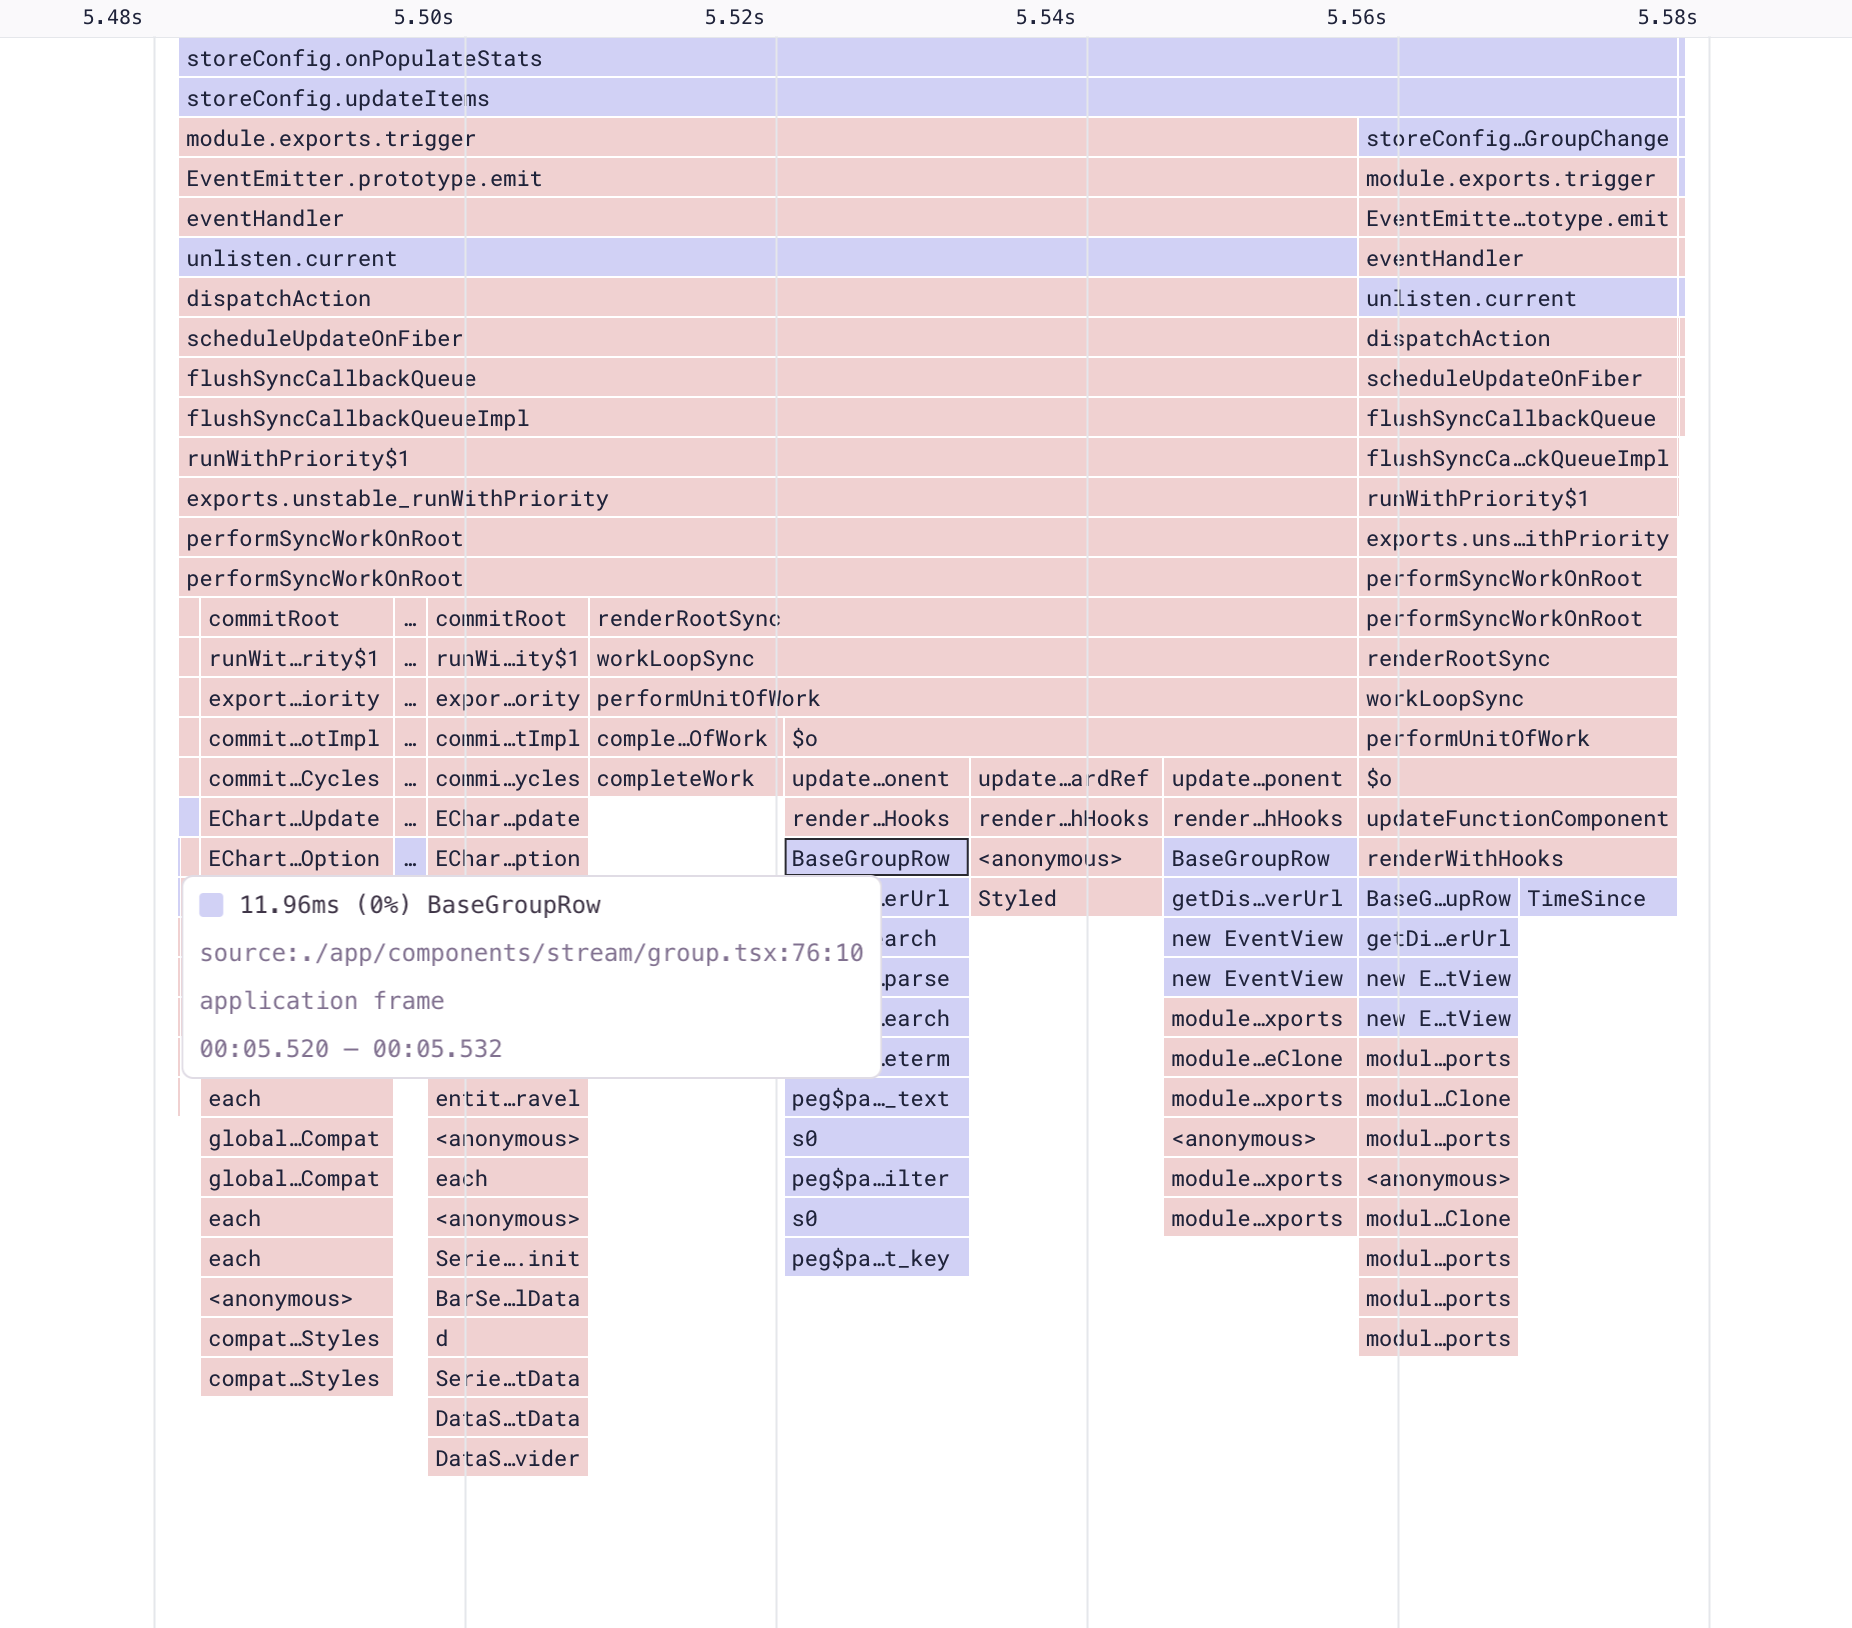
When looking at aggregate flame graphs, a good optimization to look for is the widest drawn frames, which indicate where the most time is spent. In our case, the function where we spend the most time is storeConfig.onPopulateStats. If we right-click on the function, we can select an example profile to visualize what this function is doing.
The example profile shows that a user experienced a 230s main thread block event, which was the result of a call to storeConfig.onPopulateStats. Looking at the call stack below, we can see that this function doesn’t spend its time in one single place, but in many calls to other functions.
The slowness can be attributed to one of two scenarios:
There’s an obvious long-running leaf function blocking our stack execution, or
It’s the cumulative effect of multiple function invocations.
Since we don't see one obvious function, we can assume that it’s the latter.
Analyzing the source code, we know the call to onPopulateStats is the result of a resolved promise where we fetch error statistics. This is what the page load looks like - do you notice how after our list initially renders, there is a period when the graph, events, and users column are all blank?
This happens because error statistics, being resource-intensive, are fetched separately. If we look at the profile, we can see that our call to onPopulateStats causes our list components (BaseGroupRow) to re-render.
But why? React should be able to skip those and just re-render the columns that have changed.
Well, it turns out that we have some inefficient code that breaks React tree diffing.
I’ve made a simplified example that shows the issue and a way we can mitigate it. The solution is to move the partial state call inside a provider, avoiding parent component re-rendering and passing the value to the children via React context. This prevents unnecessary rerendering of React components that don’t consume our value.
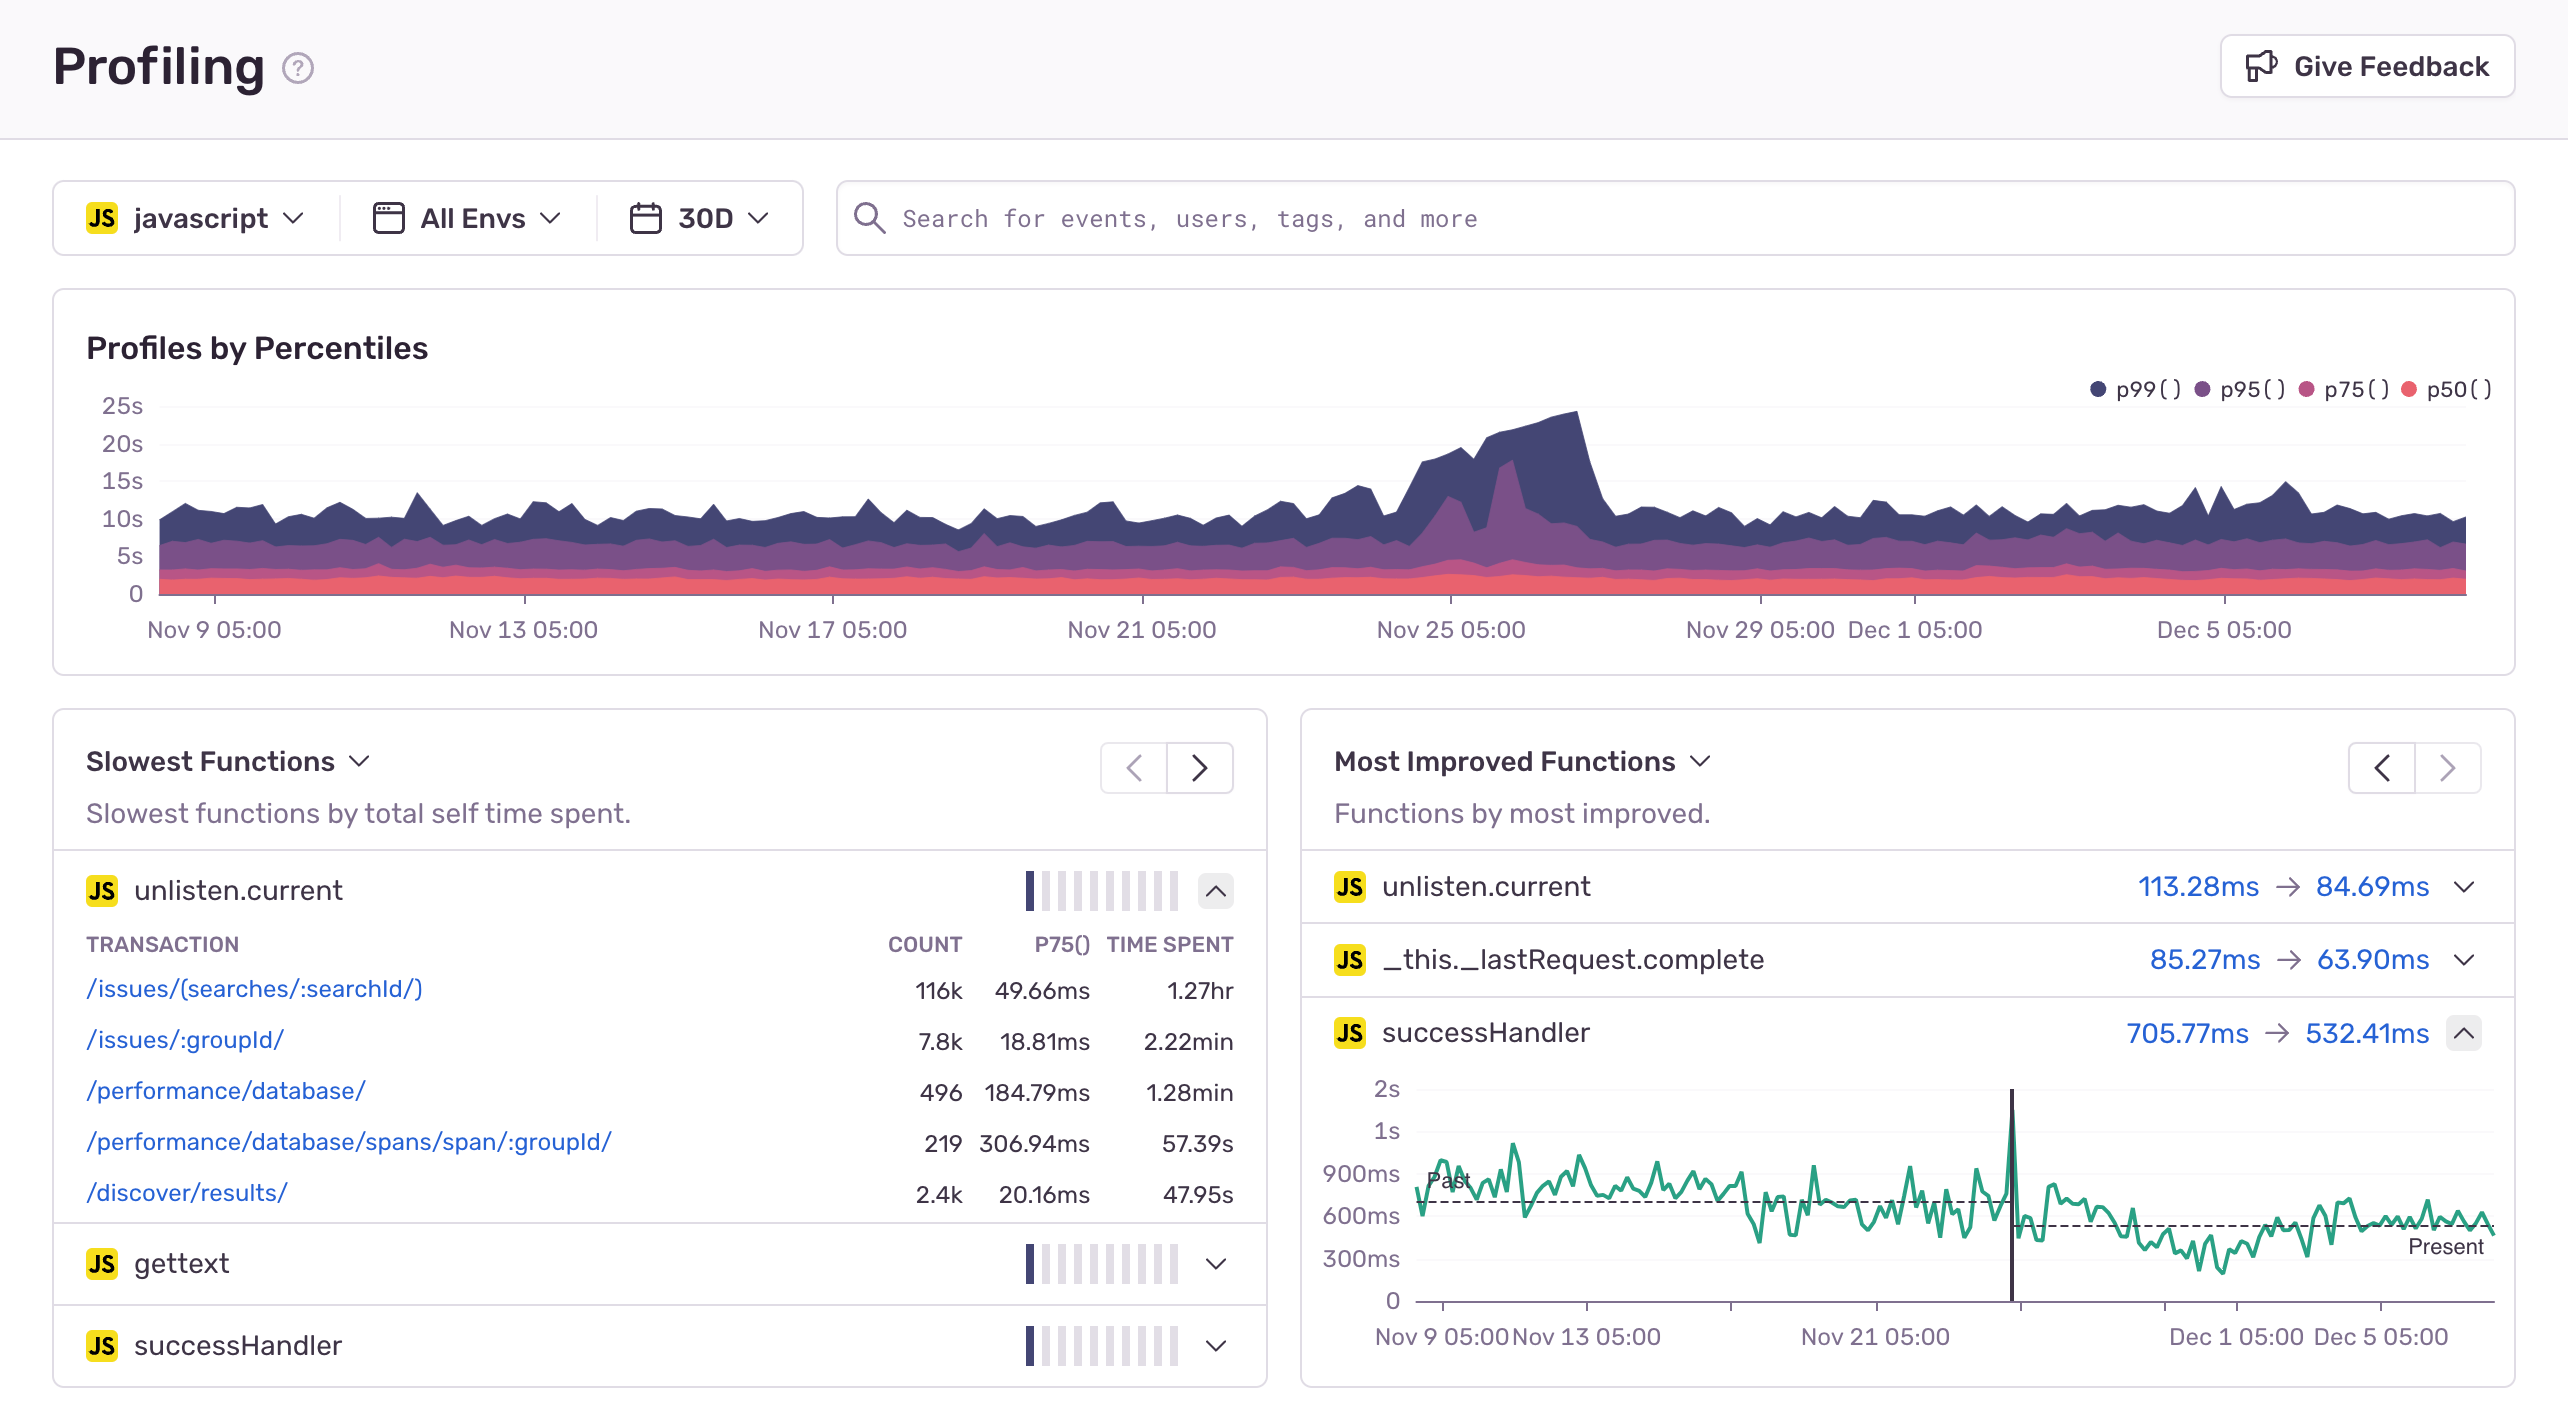
Having identified the root cause and a solution, the next step is to deploy these changes to production and observe how our runtime has changed. We can see that post-deployment, a lot of the functions are now benefitting from a more granular re-render, resulting in improved runtime performance.
Use Sentry Profiling to improve performance & user experience
This is just one example of a performance issue that occurs in production with a better workflow. We no longer have to rely on our users to complain about performance issues and can instead use profiling data to be proactive, prioritize performance work, and validate that our changes are indeed improving performance for our users.
Have questions or feedback? You can check out our discussions on GitHub, join the Discord, or reach us on Twitter.


