Avoid Rate Limiting with Query Batching
Avoid Rate Limiting with Query Batching
This post is part of our debugging series, where we share tricky challenges and solutions while building Sentry.
~~~
On March 4th, 2024, the most metal incident happened - INC-666 😈
INC-666, in a nutshell, was where the issue alert rule post-processing step was flooded with more load than it could handle, and alerts that were supposed to have fired did not. This means that Sentry customers might not be receiving alerts if the query that would have triggered the alert is rate-limited. A high-priority issue that needed to be resolved.
This issue was caused by a few other incidents, including one that paused event ingestion. We discovered INC-666 when ingestion was turned back on - the rule processor was not able to keep up with the large backlog of issues that required processing.
From ~7:30 am and 8:45 am is when the event ingestion was paused, and we saw this in our metrics where rate limited queries dropped from an average of around 10K every 5 minutes to 0. Then we had a large spike to an average of 150k rate limited queries every 5 minutes while we were processing the backlog. The incident also caused a large error rate for issue alerts; errors on issue alerts dropped from 10 every 5 minutes to 0 and then spiked to over 40 on average during the backlog recovery period.
How Sentry processes Issue Alerts
To better understand the incident and the steps taken to improve processing, let’s take a broader look at how we process issue alerts. Issue alerts can be thought of as falling into the category of “slow” or “fast”. Fast conditions only need to look at readily available data (like if the issue is a high priority). Slow conditions need to query Snuba—this makes them take longer to process. These are the alert rule conditions that check a number against a period, like so:
We validate each event ingested for a project against its issue alert rules. For example, if the rule has a condition “Number of events in an issue is more than 5 in an hour,” we query Snuba for the number of events in the last hour to see whether or not the condition has been met. If the condition has been met, then the alert fires.
The problem was that this made so many Snuba queries that they were already getting heavily rate-limited, and then the incident added even more queries to it, which resulted in many rules not being evaluated.
The incident shed light on how bad the problem could become as we continue to grow and have more of these alerts.
Through debugging this incident, we were faced with the truth that a typical week will see Monday, Wednesday, and Friday spiking around 6M - 8M rate limited events by Snuba a day while the rest of the days stay fairly consistent around 3M - 4M rate limited events by Snuba a day.
We did have an optimization where we’d skip the slow checks if possible. For example, if the rule was configured to fire on “any” of some conditions (rather than “all”), we wouldn’t have to check the slow condition if the fast one passed. This helped, but we needed to do much more to address this in the long term.
Prevent rate limiting by batching Snuba queries
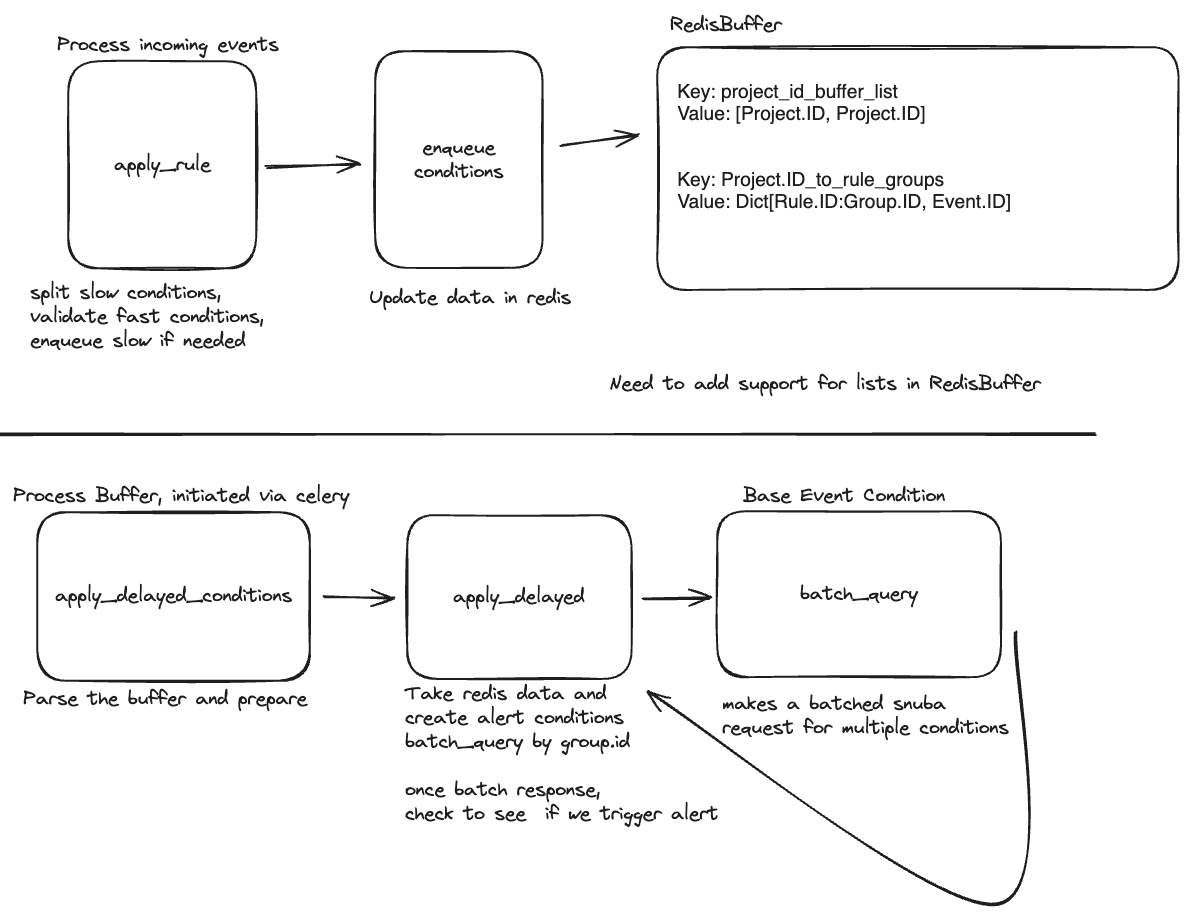
To address the rate limiting issue, we came up with a plan to batch the Snuba queries to reduce the total number of queries we were making and avoid rate limiting as much as possible. During post-processing, if we have an event in a project with a rule with a slow condition, we add it to a sorted set that gets flushed every minute. We then batch multiple groups together to make one Snuba query where we previously would have made one for each group and fire the alert normally if the condition has been met.
Challenges with using a sorted set to batch Snuba queries
The plan seemed relatively straightforward, but it took quite a while to implement. We added methods like ZADD and ZRANGEBYSCORE, set up a new task to process the set, and added a registry so we could trigger the new “delayed” (delayed by a minute max since we flush the buffer every minute) processing. Then we moved on to actually holding back the rules with “slow” conditions by putting them into the buffer and wrote a new processor to fetch the data from the buffer, batch query Snuba, and fire the alerts. Finishing this required a lot of refactoring, troubleshooting, and coordination with ops.
Results
Overall, we saw a massive reduction in several metrics related to issue alert processing.
We saw a huge reduction in the total number of Snuba queries made by issue alerts. Before batching, we hit an average of 15M Snuba queries, and it dropped to under 2M Snuba queries after batching was implemented.
We had an additional bonus to batching the queries as well. The number of bytes scanned took a nosedive, too. Before batching, we were in the 20T bytes scanned on average and after batching, we dropped to under 1T.
The number of dropped queries due to Snuba rate limits also dropped off entirely.
Metric Alert load shedding
While investigating INC-666, we ran into another incident where we built up a backlog of subscription executors. This backlog was caused organically over time as users adopted products and started sending more events.
What happens if there are fewer queries to Snuba?
Then, the question was asked: “What if we didn’t make as many queries to Snuba? Would there be an impact on the product?" Well, sort of. Let me explain. We currently evaluate metric alerts on about a 1-minute cadence, plus or minus for processing time. Changing this frequency ends up impacting metric alerts differently depending on the size of the data's time window.
For example, if a user wants to be alerted that the p95 of their site takes longer than 10 seconds over the last 10 minutes, then delaying the alert would likely impact our user. However, if the user wanted to know about the same metric for the last 24 hours, then it is unlikely that they would notice or mind if they were alerted within 1 minute or 5 minutes because they are already concerned with a much larger time scale than just a few minutes.
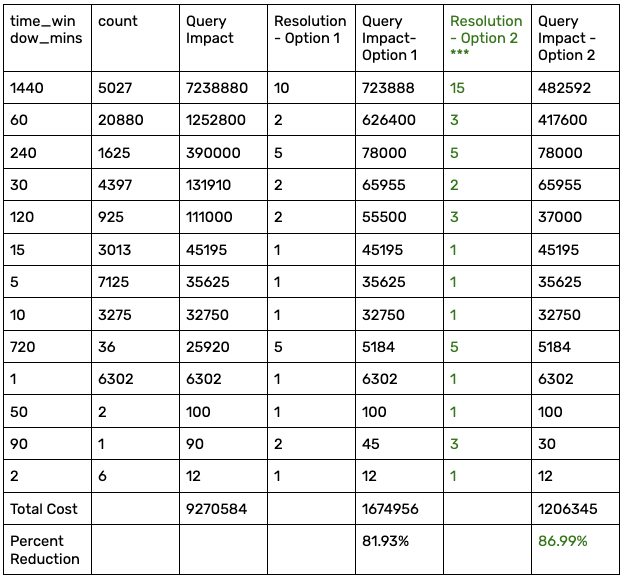
With this theory in mind, we put together the chart below, mapping the time_window to the frequency of Snuba subscription updates (resolution).
From this chart, we can begin to estimate how much alerts “cost” us (Query Impact), within the context of how much we affect the user's experience. From here, we can experiment with different values to balance the user experience changes with savings. Finally, we need to figure out a way to delay the QuerySubscription. Happily, the resolution field already exists on the QuerySubscription model to update how frequently we want to query.
We decided to choose the second option for maximum Snuba savings. Now we just needed to make the code changes. The first change was pretty straightforward - if we are creating an alert, we’ll want to check the time_window for the query and use a dictionary to map the time_window to the SnubaSubscription.resolution.
team_id: int | None def _owner_kwargs_from_actor(actor: Actor | None) -> _OwnerKwargs: if actor and actor.is_user: return _OwnerKwargs(user_id=actor.id, team_id=None) if actor and actor.is_team: return _OwnerKwargs(team_id=actor.id, user_id=None)
[See on GitHub here]
By modifying new alerts first, we could A) validate our thesis that users won’t mind if larger queries don’t update as frequently and B) verify that the subscription model’s `resolution` field works as intended.
Finally, we just needed to run a migration on saved data. To do that, we selected any QuerySubscription associated with a metric alert and updated the resolution field using the same logic.
So… Did query batching work?
Yes! It’s not too surprising that making fewer requests to Snuba reduces the load on Snuba. What’s great is that we were able to reduce the number of Snuba queries by almost half and maintain the product experience for our users.
Subscriptions executor query rate
We saw that the number of subscription executors has been reduced from ~9000qps to a little more than 5000qps. This reduction will help prevent further incidents like the one that originally triggered INC-666.
Percentage of Snuba cumulative time for Metric Alerts
We also saw the load on the Snuba itself was reduced. Previously, we had spent approximately 38% of our cumulative time in Snuba. This has been reduced to about 16% —making the process ~58% more efficient.
In the end, all of these savings were accomplished with just five new lines of code.
Need to debug performance issues yourself?
Give Sentry a try. We’re focused on making debugging more efficient for all developers, and we likely support whatever language or framework you’re building with. Visit our docs to get started.
If you have any feedback, please feel free to join the discussion on Discord or GitHub.


