August Product Updates for Sentry

Sentry -

During the month of August we dropped heaps of new features across the entire Sentry platform. From identifying user frustration through rage and dead clicks to expanding front end Profiling support, your Sentry Dev Team has skipped their summer vacations (well, kinda…) and been hard at work delivering more capabilities to help you better deal with application errors and performance issues. We’ve also rolled out a cool, new integration with Discord and VS Code extension for Sentry Codecov. Here’s the full list:
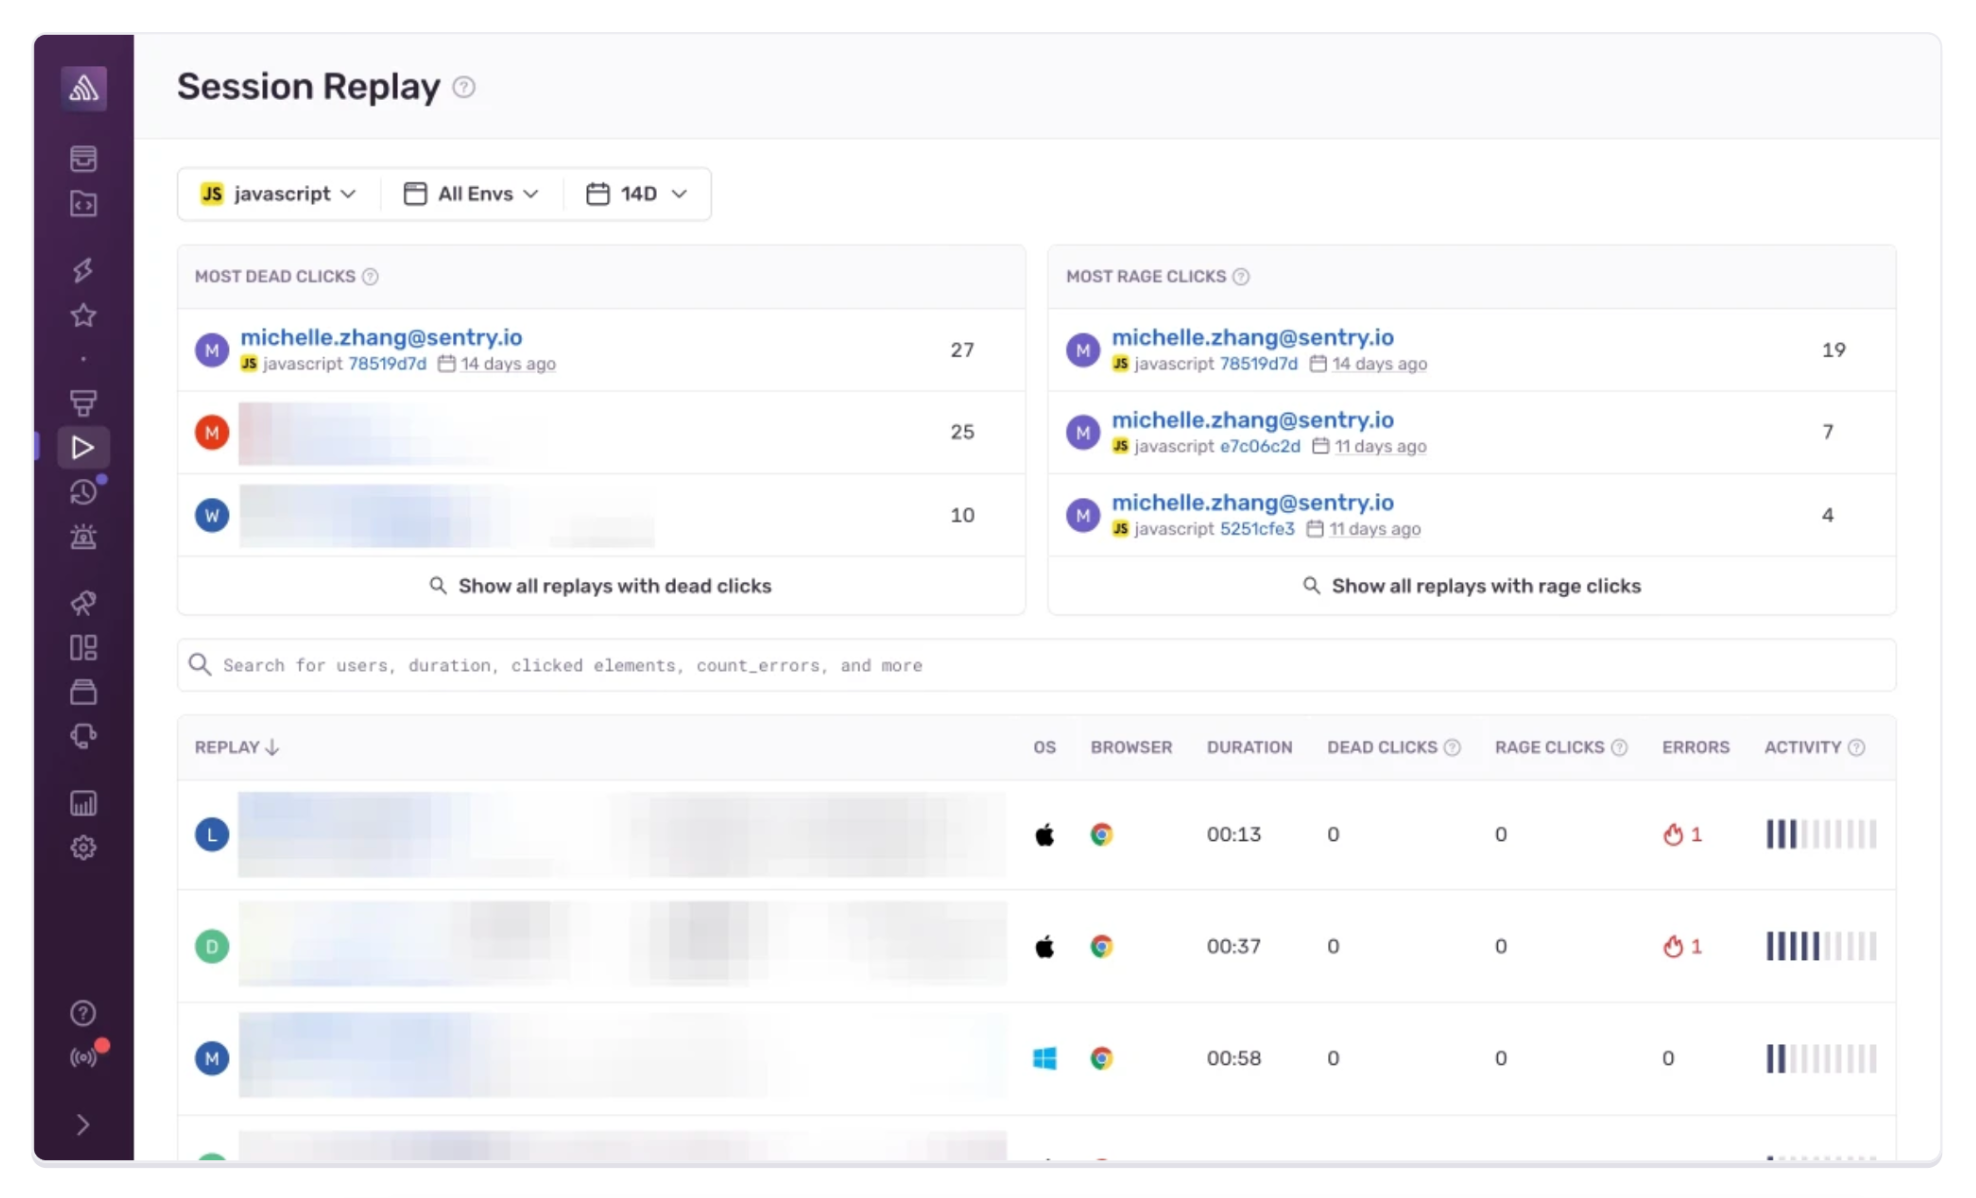
Rage and dead clicks now available in Session Replay
Profiling for Browser Javascript, React Native, and Ruby
Sentry + Discord integration
VS Code extension for Codecov
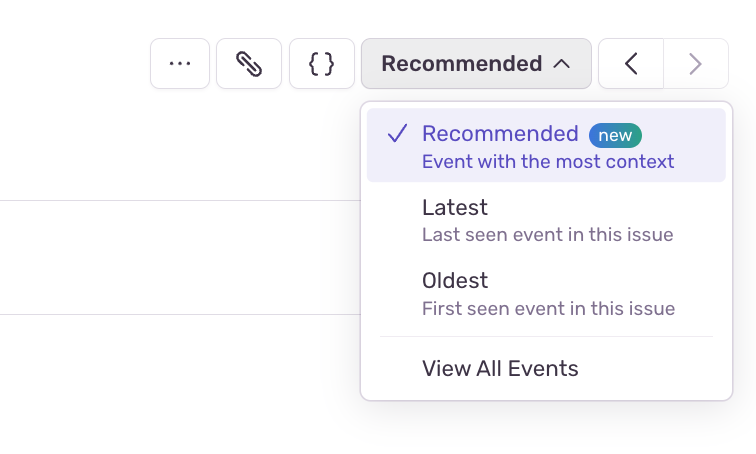
Recommended events in Issue Details
Be sure to check out our ChangeLog for the entire list of recent releases.
Rage and dead clicks now available in Session Replay
The fallout from malfunctioning frontend features, like buttons, extends beyond mere technical glitches; it can frustrate your users and lead them to doubt the overall reliability of your application. Two telltale signs of someone being frustrated are rage clicks, a series of rapid and agitated clicks on the same unresponsive element, and dead clicks, instances where users click on seemingly interactive elements, only to be met with an absence of any obvious action or change in the application. Being able to easily identify this user frustration and rapidly pinpoint the underlying cause is critical for you to keep your users happy.
This is where the click-by-click insight into your user's journey provided by Session Replay can help save the day. By identifying rage clicks and dead clicks as significant events in the Timeline (in addition to errors and other user interactions) Session Replay now highlights these moments of user frustration that may signal a larger problem with your application. And through the DOM Events filter, you can scrutinize the entire sequence of actions around the user's interaction with the unresponsive element to gain deep context on the issue and more quickly identify the root cause in your code. Learn more in our recent blog post.
Profiling additions: more SDKs, finding the slow and regressed functions
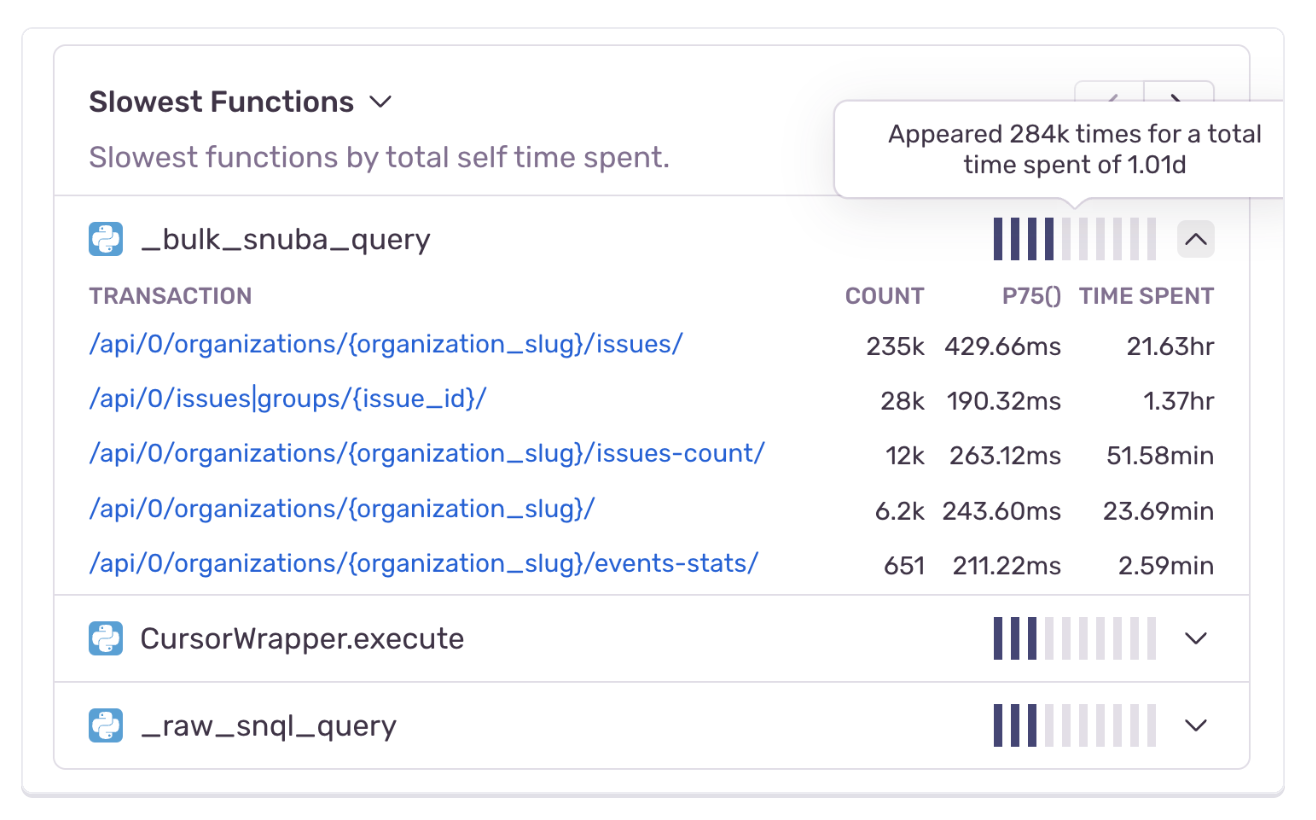
Profiling helps you find the root cause of performance bottlenecks across your services to prioritize code optimizations and architectural changes. To enhance this observability across your entire stack we’ve added coverage for frontend, backend, and mobile applications with SDK support for Ruby, JavaScript, and React Native.
With this expanded SDK support, we’ve added a pair of new widgets that provide a quick look at areas of your code that may be ripe for performance enhancements. The Slowest Functions widget meticulously compiles and ranks your application's slowest functions based on their cumulative self-time (amount of time it takes a function to execute, excluding other functions it calls). The Most Regressed Functions widget shines a spotlight on the functions within your codebase that have experienced the most substantial regressions in terms of self-time, over a defined time period. The widget's breakpoint detection algorithm identifies the precise moment when these regressions began, allowing you to trace back to the specific software release that introduced the regression. Read the recent blog post to learn more.
Sentry + Discord integration
To help you seamlessly bridge the gap between your Sentry alerts and your Discord channels, ensuring you stay on top of critical developments in your application's performance and functionality, we’ve rolled out a new integration with Discord. With this integration, you'll receive real-time notifications for Sentry alerts directly within your configured Discord channels. This means you can react more quickly to new issue alerts and streamline your workflow by assigning, resolving, and archiving these alerts—all from within Discord itself. Love Discord and want to try it out? Learn how to enable EA access to this new integration here.
VS Code extension for Codecov
Sometimes you need more configuration options than the defaults provided by your software tools. For users of Sentry Codecov who edit their Codecov YAML file to enable more functionality, we’ve released a new extension that enables you to effortlessly create, manage, and validate your YAML file directly within the Visual Studio Code environment. Gone are the days of worrying about committing mistakes that accidentally change Codecov’s behavior due to an invalid configuration. The VS Code extension is designed for all users, whether you’re a Codecov expert or completely new to YAML files. It also offers autocomplete and real-time validation so before creating a pull request you can be sure your configuration is perfect.
Recommended events in Issue Details
Everyone loves a good recommendation – whether coffee, food, or…. events. Based on your feedback from our recent quarterly satisfaction survey, we’ve added a new feature that provides you with a list of events recommended for follow-up. The events provided in this filter are curated by recency (< 7 days old), relevance (based on your recent issue searches), and content (prioritizes events that contain debugging tools such as replays, profiles, and traces). To try it out, go to your Issues page to find these issues that may matter the most to you.
If you want more, our changelog has the running list of all product and feature releases. You can also drop us a line on GitHub, Twitter, or our Discord. And if you’re new to Sentry, you can try it for free today or request a demo to get started.


