Aspire Insights in Production with Sentry
Aspire Insights in Production with Sentry
Aspire 101
With the release of .NET 8, Microsoft released a new framework called .NET Aspire that's shaking up the way distributed applications are crafted. Aspire makes it painless to configure and deploy distributed apps in .NET.
You can check out the Aspire docs for a full rundown. However, just some of the cool things you get when you build your applications using Aspire are:
OpenTelemetry logs, metrics, and tracing
Health checks
Service discovery
Orchestration in .NET (no need to dive into Kubernetes or Docker config files)
And loads more
Aspire comes with a nifty dashboard that allows you to easily navigate the telemetry generated by your "resources"—the term Aspire uses for the various components of your distributed system:
All of this makes for a pretty cool developer experience.
And we can easily share all that OpenTelemetry data with Sentry, which gives us all the insights we get from telemetry data plus all the cool stuff that Sentry has to offer (like crash reporting, source maps, and the ability to instrument distributed application components that are not built in .NET).
Also, with Sentry, that instrumentation is available both in development and production (currently the Aspire dashboard is a developer-only experience).
So let’s dive in and see how to wire all of this up!
Note: You can get the source code for everything that follows on GitHub.
Creating a basic Aspire solution
There are some good tutorials on getting started with Aspire already, so we won’t cover that here in detail. Once the tooling is set up, we can create a new aspire solution from the command line:
dotnet new aspire-starter --output AspireWithSentryThis creates a new Aspire solution using the aspire-starter template, which consists of a minimal API (ApiService), a Blazor front end (Web) and the two projects that form the backbone of any Aspire solution (AppHost and ServiceDefaults):
ServiceDefaults contains various extension methods to wire up configuration that’s common to all the projects in the solution.
AppHost is used to orchestrate everything and is the application you’ll run when you want to power everything up on your development machine. It also contains a useful dashboard:
In addition to some handy links for the URLs corresponding to each of the “resources” in your distributed application, the dashboard shows you logs, tracing, and metrics for each of these.
Wouldn’t it be great if we could see that in Sentry?
Sending traces to Sentry
Under the hood, each of the Aspire projects is being configured to make logs, metrics, and trace information available via OpenTelemetry. This gets triggered by the call to AddServiceDefaults in AspireWithSentry.ApiService/Program.cs:
var builder = WebApplication.CreateBuilder(args);

// Add service defaults & Aspire components.
builder.AddServiceDefaults();
If you dig into that extension method, you’ll see the very first thing it does is call ConfigureOpenTelemetry:
public static IHostApplicationBuilder AddServiceDefaults(this IHostApplicationBuilder builder)
{
   builder.ConfigureOpenTelemetry();
Sentry, of course, has OpenTelemetry Support so we can fairly easily hook this up to Sentry... we’re pretty much just following the instructions listed on Sentry Docs here, making all the necessary changes in the ServiceDefaults project:
Add references to the Sentry packages
Configure OpenTelemetry to Send data to Sentry
Initialize Sentry and configure it to use OpenTelemetry
1. Add Sentry package references
For this we simply add a couple of package references to the ServiceDefaults project:
<ItemGroup>
 <FrameworkReference Include="Microsoft.AspNetCore.App" />

 <PackageReference Include="Sentry.OpenTelemetry" Version="4.1.2" />
 <PackageReference Include="Sentry.AspNetCore" Version="4.1.2" />
</ItemGroup>
2. Send Telemetry data to Sentry
To send Telemetry data to Sentry, we can tweak the boilerplate ConfigureOpenTelemetry method as per the Sentry docs:
builder.Services.AddOpenTelemetry()
   .WithMetrics(metrics =>
   {
       metrics.AddRuntimeInstrumentation()
              .AddBuiltInMeters();
   })
   .WithTracing(tracing =>
   {
       if (builder.Environment.IsDevelopment())
       {
           // We want to view all traces in development
           tracing.SetSampler(new AlwaysOnSampler());
       }

       Tracing.AddSentry() // <-- Send trace information to Sentry
             .AddAspNetCoreInstrumentation()
             .AddGrpcClientInstrumentation()
             .AddHttpClientInstrumentation();
   });
3. Configure projects to use Sentry with OpenTelemetry
Finally, we need to configure each of the projects in the solution to use Sentry. For that, we need to add the following extension method in the ServiceDefaults project:
   public static WebApplicationBuilder AddSentry(this WebApplicationBuilder builder, Action<SentryAspNetCoreOptions>? configureOptions = null)
   {
       builder.WebHost.UseSentry(options =>
       {
           // Change this to the DSN of your Sentry project
           options.Dsn = "... your DSN here ...";  // Replace this!!!
#if DEBUG
           options.Debug = true;
#endif
           options.TracesSampleRate = 1.0;
           options.UseOpenTelemetry(); // <-- Use OpenTelemetry traces
           configureOptions?.Invoke(options);
       });
       return builder;
   }
And now we can call that method from both AspireWithSentry.ApiService/Program.cs and AspireWithSentry.Web/Program.cs:
var builder = WebApplication.CreateBuilder(args);

// Send telemetry and crash reporting to Sentry
builder.AddSentry();
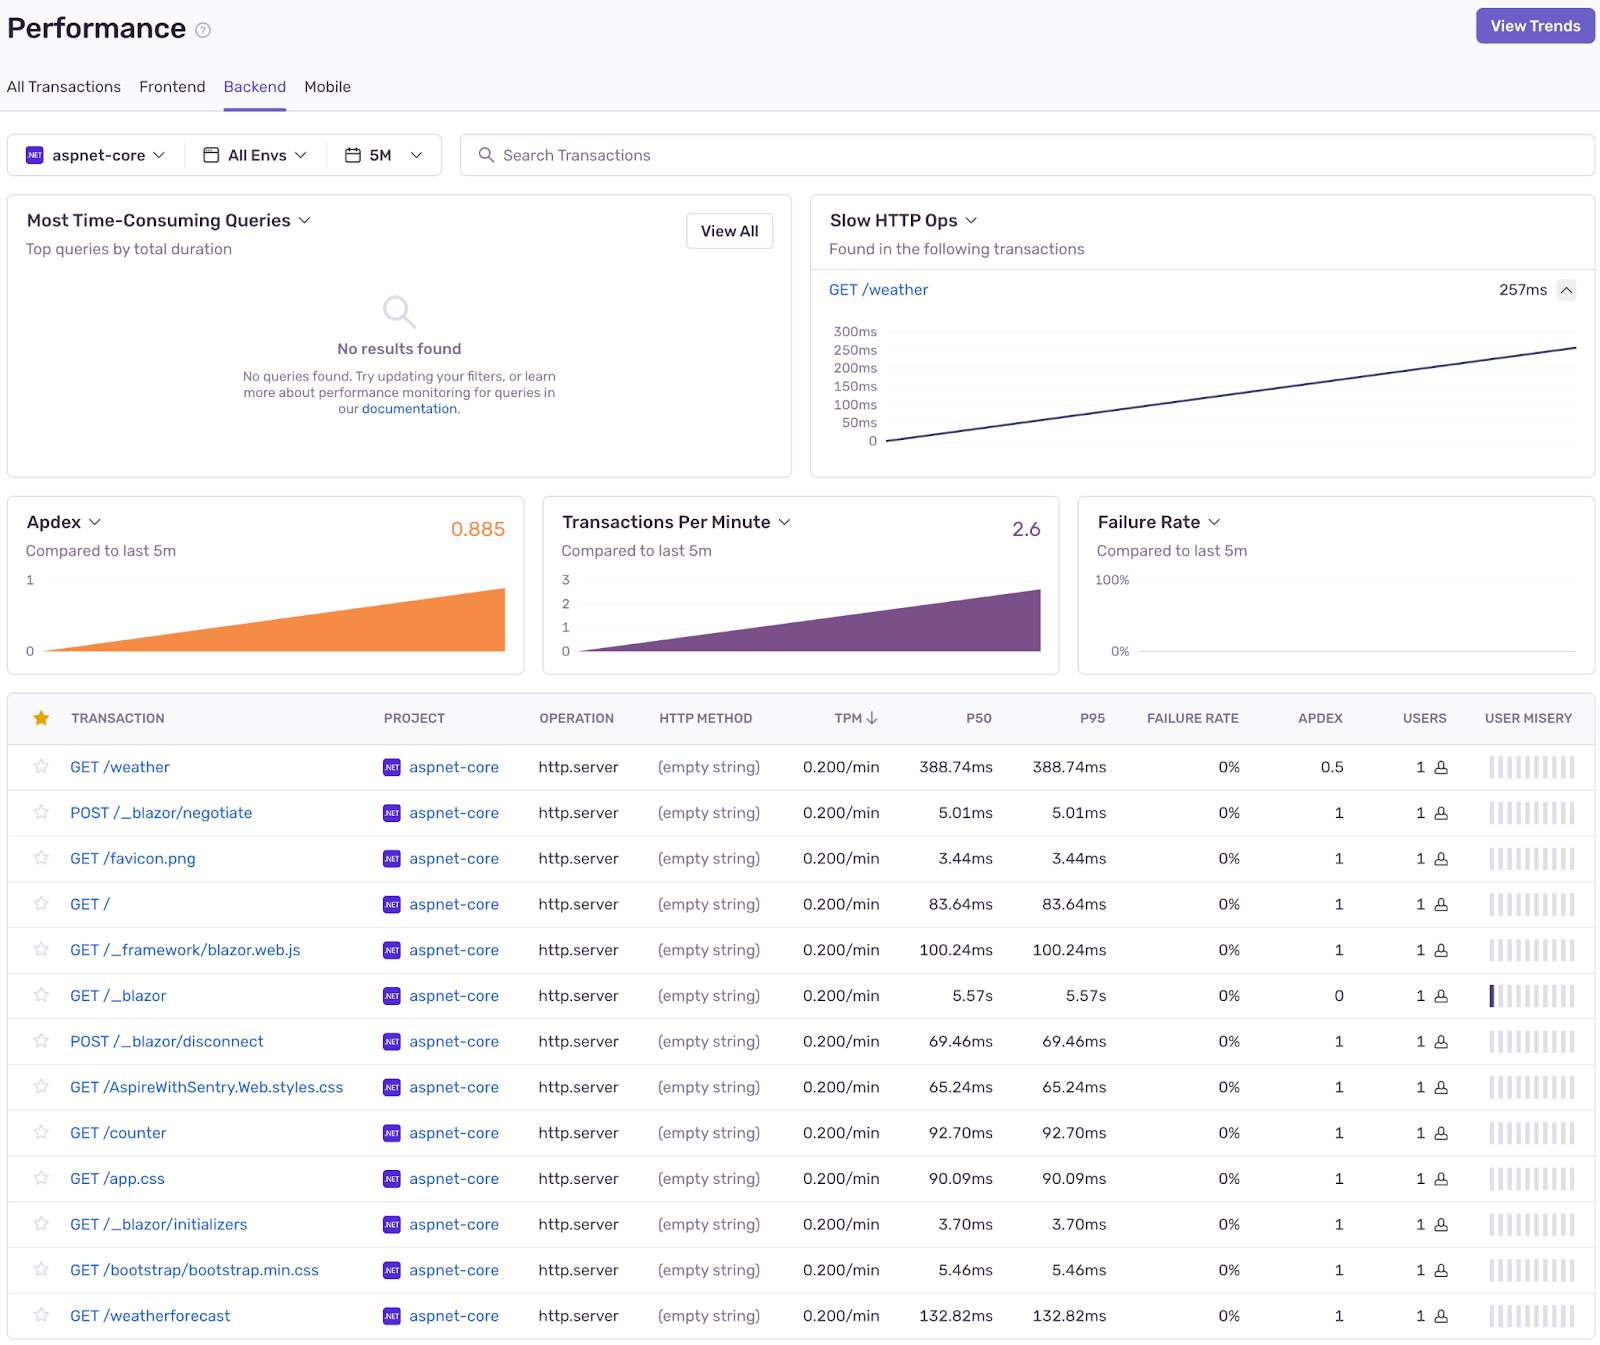
And that’s it! We can now power up our distributed app by running the AspireWithSentry.AppHost project. As we navigate around the Web front end (increment counters, check weather reports) we see that all our lovely traces flow through to the Performance dashboard in Sentry!
Note: The way things are hooked up above assumes that you want to use the same settings for both your Web and ApiService projects. The configureOptions parameter that we’ve provided on our extension method could be used to override the settings on a per-project basis (or you could even put your settings in appsettings.json - up to you).
Adding a SQL Database
Most distributed applications have some kind of data persistence, right? Let’s add an SQL server to the app.
In Aspire, this is really easy:
Add the Aspire Sql component
Add a SQL Server Resource to our orchestrator
Query the database from our client projects
1. Add the Aspire SQL component
First we add a package reference in the ServiceDefaults project to Aspire.Microsoft.Data.SqlClient... and for the version, I’m going to match this with the version of the other Aspire components from the aspire-starter template (in my case this is 8.0.0-preview.2.23619.3):
<ItemGroup>
 <FrameworkReference Include="Microsoft.AspNetCore.App" />

 <PackageReference Include="Aspire.Microsoft.Data.SqlClient" Version="8.0.0-preview.2.23619.3"/>
 <PackageReference Include="Microsoft.Extensions.ServiceDiscovery" Version="8.0.0-preview.2.23619.3" />
2. Add a SQL Server Resource
Next we need to create a SQL Server container in AspireWithSentry.AppHost/Program.cs as a dependency for our ApiService:
var builder = DistributedApplication.CreateBuilder(args);

var sql = builder
   .AddSqlServerContainer("sql")
   .AddDatabase("tempdb");

var apiService = builder
   .AddProject<Projects.AspireWithSentry_ApiService>("apiservice")
   .WithReference(sql);
Then in AspireWithSentry.ApiService/Program.cs we register this with the service provider so that it’s available for dependency injection:
var builder = WebApplication.CreateBuilder(args);

// Add SQL Client
builder.AddSqlServerClient("tempdb");
3. Query like it’s 1999
Finally, we can use the SQL Connection in a new API endpoint on the ApiService:
app.MapGet("/crashtest", Delegate(SqlConnection connection) =>
{
   connection.Open();
   var command = new SqlCommand(CommandHelper.CommandText, connection);
   command.ExecuteNonQuery();

   throw new Exception("This is a test exception");
});
The actual SQL that will be executed is defined in a little helper class:
public static class CommandHelper
{
   public static readonly string CommandText = @"
USE tempdb;
IF NOT EXISTS (SELECT * FROM sys.tables WHERE name = 'Todo')
BEGIN
   CREATE TABLE Todo
   (
       id INT PRIMARY KEY,
       description NVARCHAR(255)
   );
END
IF NOT EXISTS (SELECT * FROM Todo WHERE id = 1)
BEGIN
   INSERT INTO Todo VALUES (1, 'Fix this crazy bug');
END";
}
Wow that’s some terrible code - what a noob. 🤡
Nothing to see here though - let’s truck on and build some UX to make use of our new API endpoint.
Add some UX
First we need to modify AspireWithSentry.Web/WeatherApiClient.cs so that we can easily call the new endpoint:
public class WeatherApiClient(HttpClient httpClient)
{
   // … all the other code

   public async Task<string> CrashTestAsync()
   {
       return await httpClient.GetStringAsync("/crashtest");
   }
}
Now to use the new endpoint, we’ll replace the contents of AspireWithSentry.Web/Components/Pages/Home.razor with the following:
@page "/"

@rendermode InteractiveServer

@inject WeatherApiClient WeatherApi

<PageTitle>Crash Tests</PageTitle>

# Hello, bugs!

<button class="btn btn-primary" @onclick="ApiCrashTest">Danger - don't touch!</button>

@code {
   private async Task ApiCrashTest()
   {
       await WeatherApi.CrashTestAsync();
   }
}
Neat, let’s fire it up and test it out…
Woah! This is surprising - we’ve got a bug when we click on that new button. Didn’t see that coming 🥸.
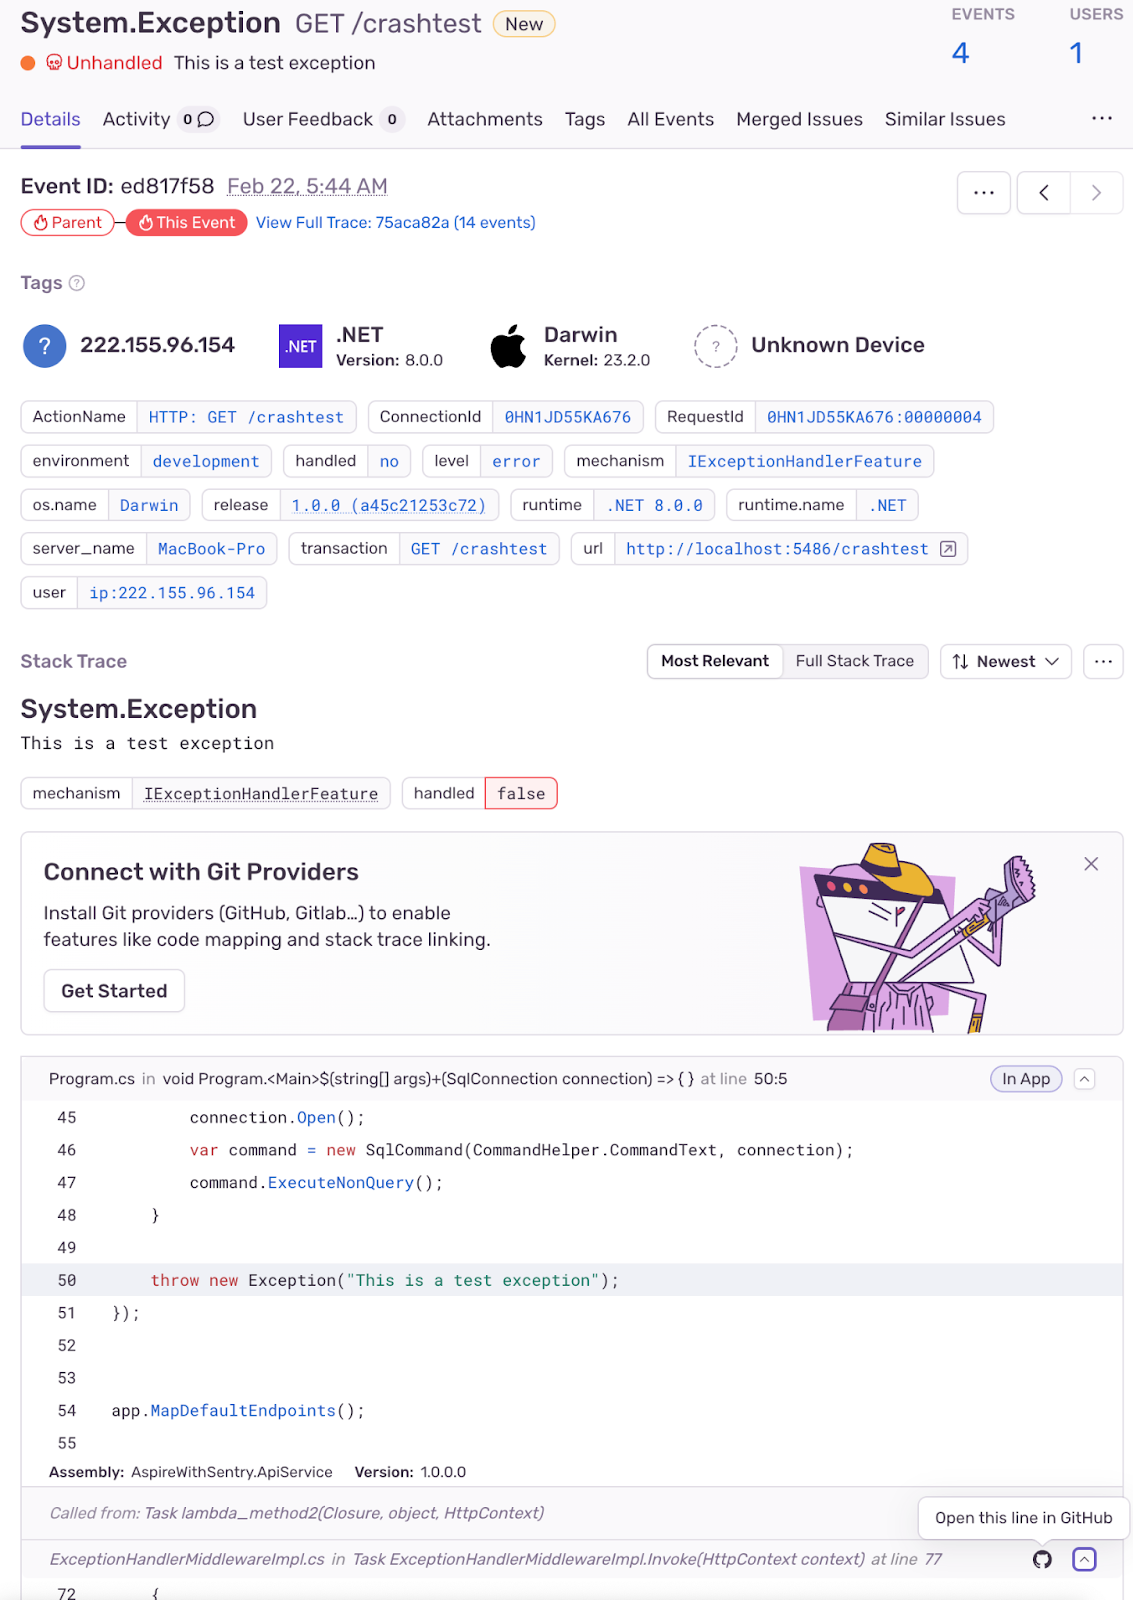
OK what does it look like in Sentry?
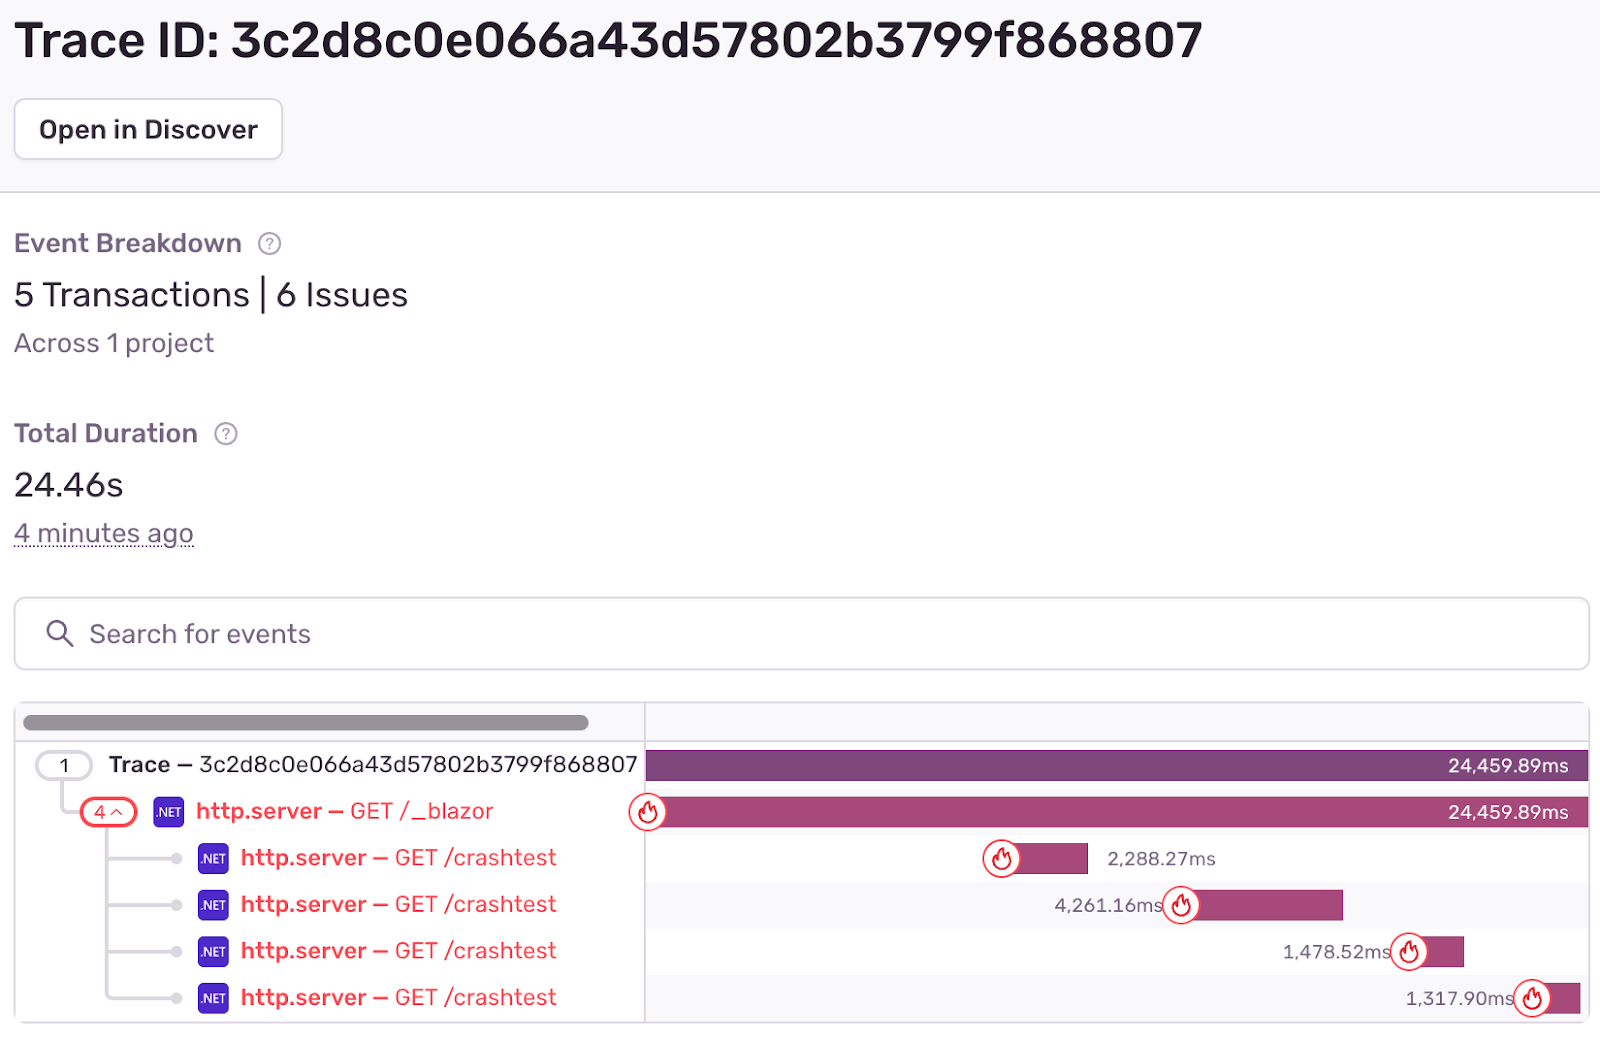
We can see there was an error in the AspireWithSentry.ApiService program on line 50. There’s a link to view the full trace. If we click on that we see the following:
We see the original request from the Blazor front end as well as multiple requests to the GET /crashtest endpoint, which is showing off the Microsoft.Extensions.Resilience features that Aspire wires up on our HttpClient by default.
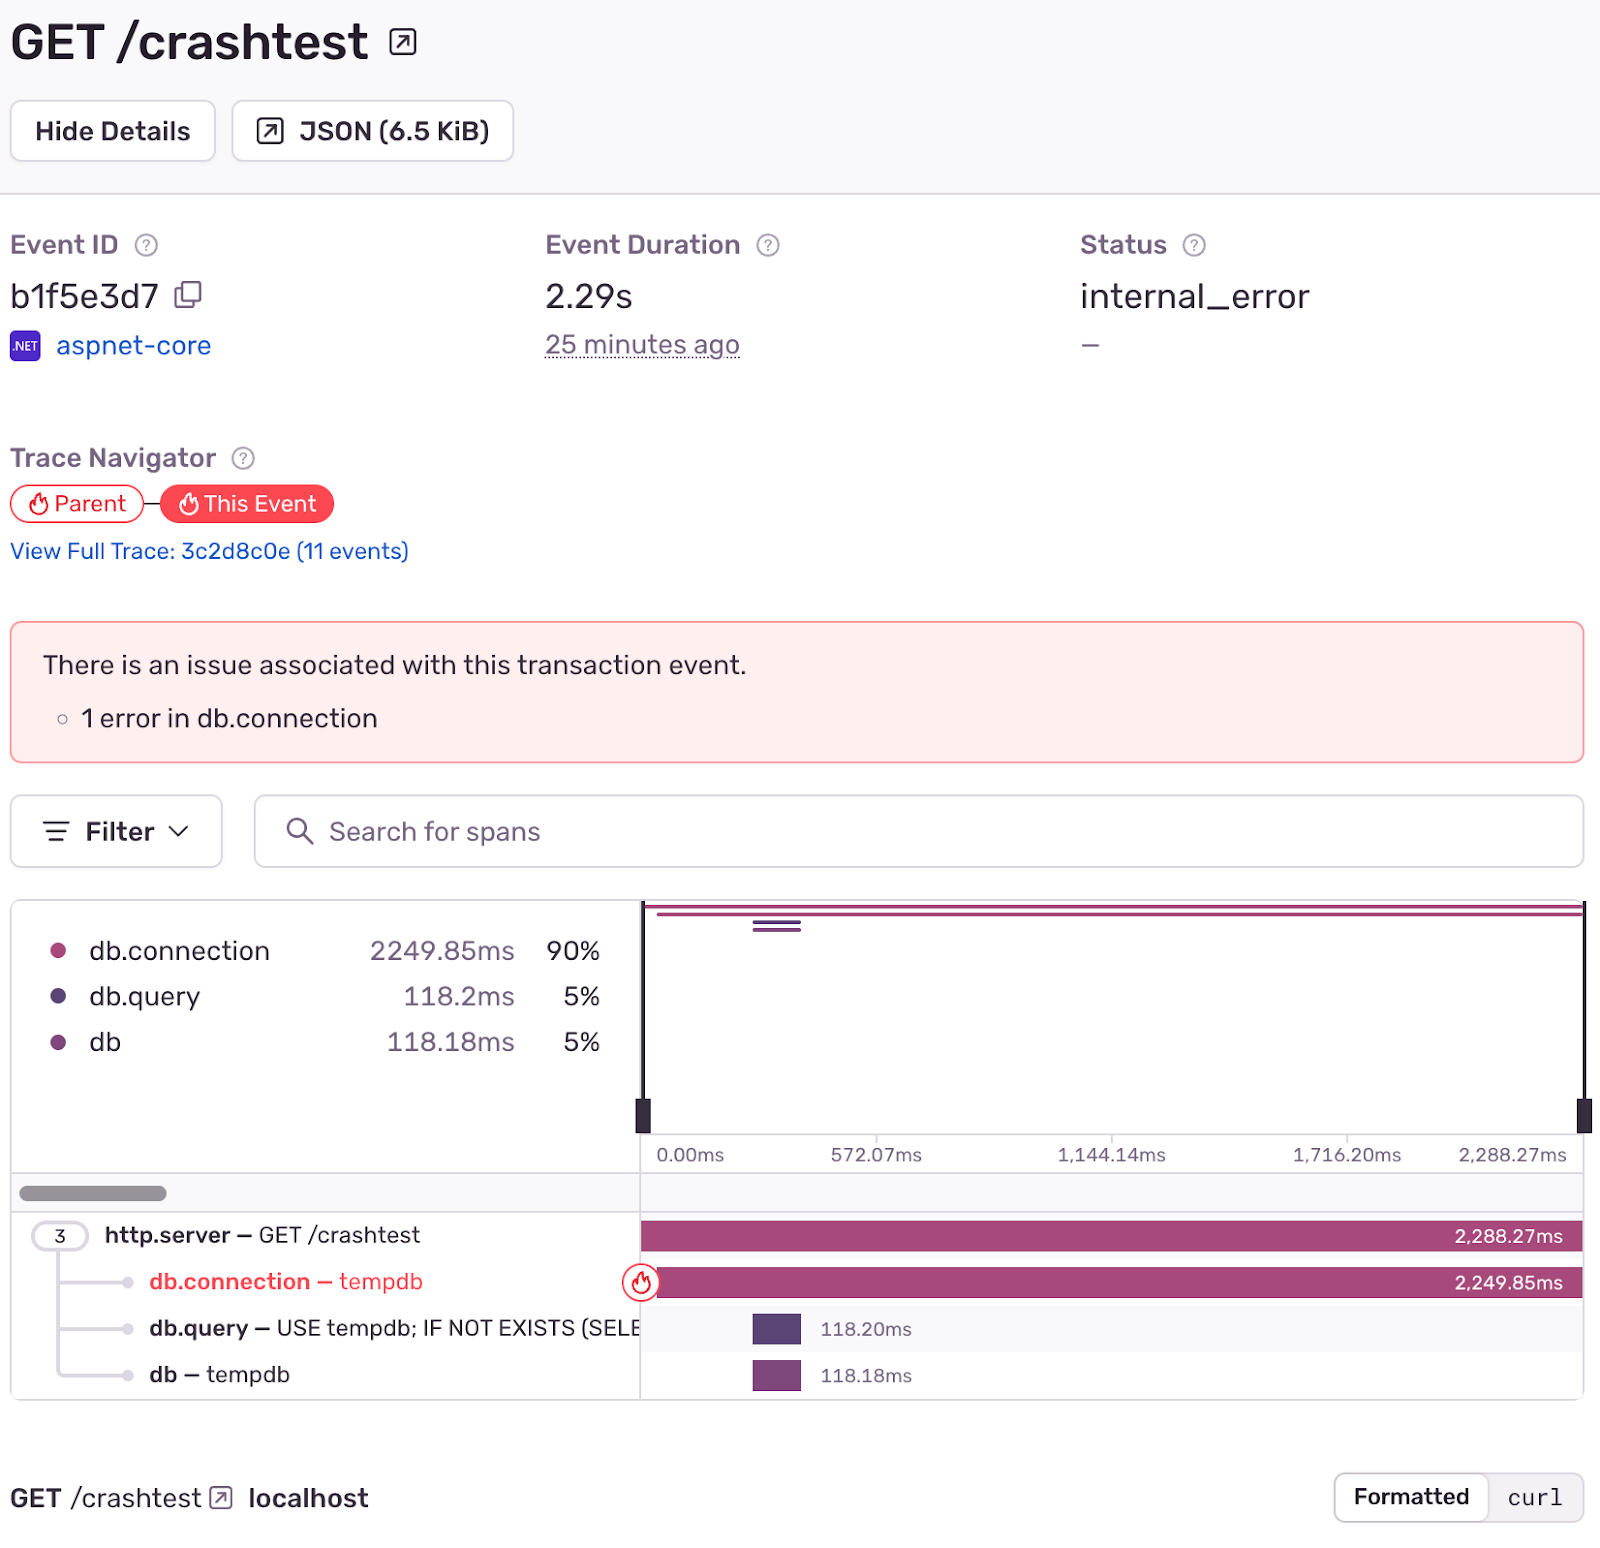
We can also see that those requests had unhandled errors (the flame icon to the left of each trace). We can click on one of those to get a bit more detail on the error:
Here, we can see full details of the SQL Query as well as the fact that an exception occurred in the context of the span that was created for our DB connection (i.e. some time after the tempdb connection was opened but before it was closed).
This is a great example of how Sentry’s crash reporting features complement the rich telemetry information available from distributed applications built with Aspire. With a bit more work, we could make all this even better (uploading debug symbols and source maps to Sentry) but that’s a bit outside the scope of this blog post.
For the time being, let’s circle back to some other information that is available in an Aspire application: Metrics!
Sending Metrics to Sentry
If we revisit Extensions.ConfigureOpenTelemetry, in the ServiceDefaults project, in addition to tracing we can see that various built-in metrics are also enabled by default for Aspire applications:
builder.Services.AddOpenTelemetry()
   .WithMetrics(metrics =>
   {
       metrics.AddRuntimeInstrumentation()
              .AddBuiltInMeters();
   })

<…snip…>

private static MeterProviderBuilder AddBuiltInMeters(this MeterProviderBuilder meterProviderBuilder) =>
   meterProviderBuilder.AddMeter(
       "Microsoft.AspNetCore.Hosting",
       "Microsoft.AspNetCore.Server.Kestrel",
       "System.Net.Http");
The Sentry .NET SDK has experimental support to capture all of these metrics. So with a small tweak to the Sentry initialization code, we can get these flowing through to Sentry as well:
   public static WebApplicationBuilder AddSentry(this WebApplicationBuilder builder, Action<SentryAspNetCoreOptions>? configureOptions = null)
   {
       builder.WebHost.UseSentry(options =>
       {
           // Change this to the DSN of your Sentry project
           options.Dsn = "... your DSN here ...";  // Replace this!!!
#if DEBUG
           options.Debug = true;
#endif
           options.TracesSampleRate = 1.0;
           options.UseOpenTelemetry();

// Configure Sentry to capture built in metrics
options.ExperimentalMetrics = new ExperimentalMetricsOptions()
{
   CaptureSystemDiagnosticsMeters = BuiltInSystemDiagnosticsMeters.All
};

           configureOptions?.Invoke(options);
       });
       return builder;
   }
The code above enables an experimental metrics feature in the .NET SDK and configures it to capture all the built-in metrics Sentry knows about (which includes all of the metrics emitted by our Aspire application).
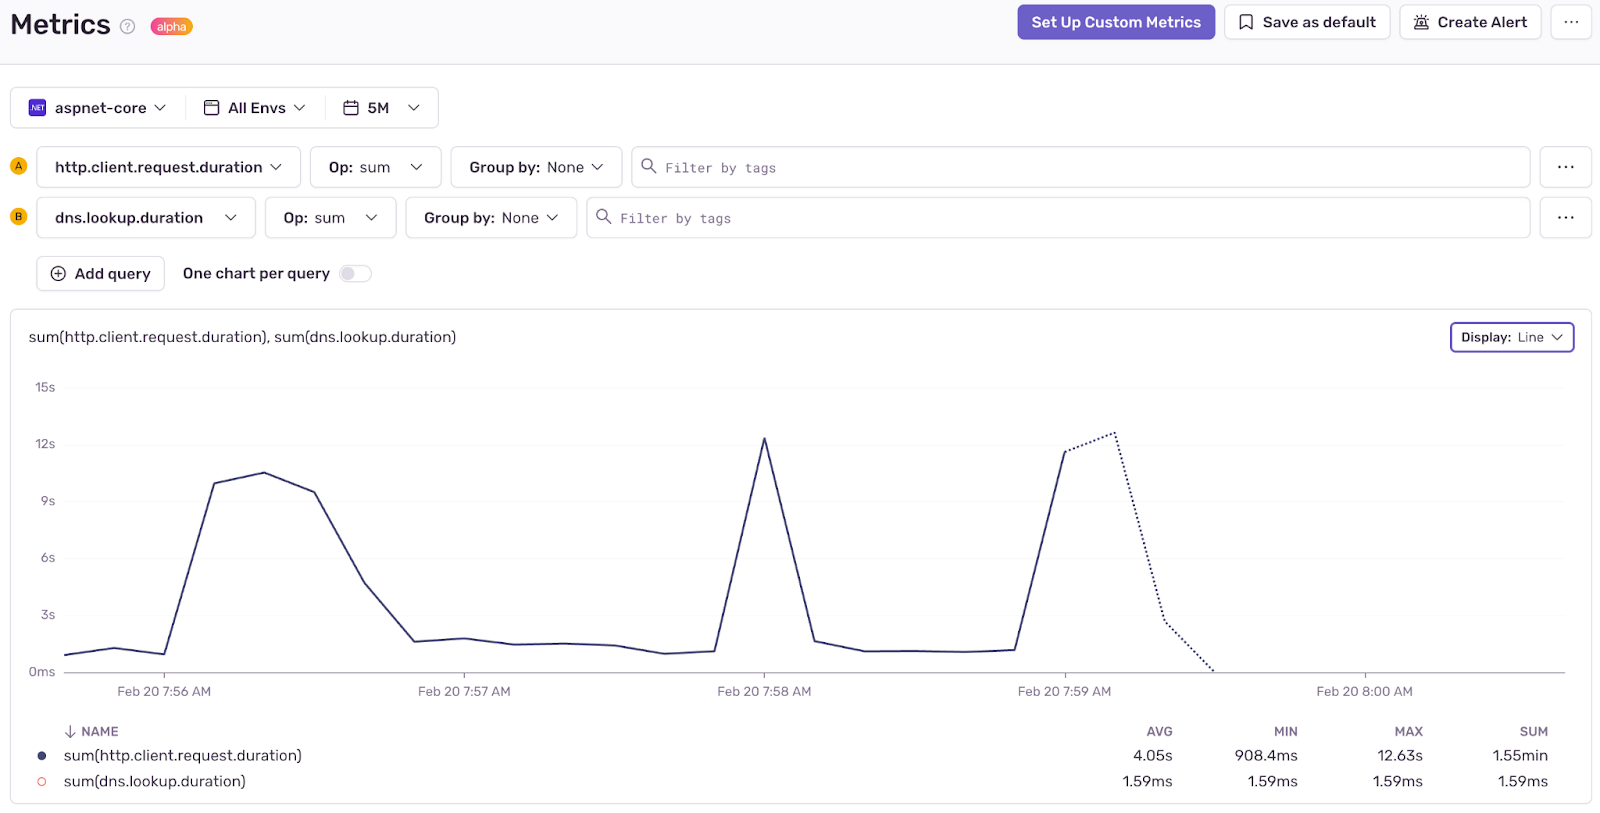
And now all the same metrics you see in the Aspire dashboard are available in Sentry!
Conclusion
Aspire simplifies app orchestration, offering powerful OpenTelemetry out-of-the-box, while Sentry provides robust production-ready infrastructure to capture and visualize that telemetry and complement it with features like crash reporting and instrumentation for components built in non .NET languages.
Aspire with Sentry is a powerful combo already and it’s still very early days. I’m super excited to see how the Aspire framework evolves and we’re definitely looking for ways to make it even easier to integrate Aspire with Sentry in the future.


