Starting with Sentry Android SDK 8.51.0, profiling on Android 15+ devices is powered by Perfetto, through Android’s system ProfilingManager API. That means fewer legacy tracer crashes, lower CPU and memory overhead, and more representative profiles.
You don’t need to change any configuration: if you already use continuous profiling, devices on Android 15 and newer pick up the new profiler as soon as you upgrade.
From method tracing to ProfilingManager
Until now, the Sentry Android SDK profiled apps with Android’s Debug.startMethodTracing APIs, which sample threads using the Android runtime’s built-in tracer. That profiler, now called Legacy Profiling, runs inside your app’s process.
With 8.51.0, on Android 15+ (API 35+) we replaced it with ProfilingManager, which can record Perfetto-based stack samples. Devices below Android 15 keep using the legacy profiler, so you don’t lose coverage on older devices.
Benefits of profiling outside your app’s process
Moving profiling out of your app’s process has three advantages:
No more legacy tracer crashes. The Android runtime’s tracer used by the Debug.startMethodTracing() APIs can crash an app when other code in the process creates native threads, attaches them to the runtime, and exits without detaching them. Sentry doesn’t cause that bug, but using the tracer for profiling can make it surface more often (sentry-java#2604). Perfetto profiling doesn’t use that tracer.
Lower CPU and memory overhead. Most of the profiling work, including most memory allocations, happens in a system process instead of yours. We don’t have hard numbers to share, but the overhead is lower than with the legacy profiler.
More representative profiles. Because the profiler isn’t competing with your code inside the same process, it has less influence on the code it measures.
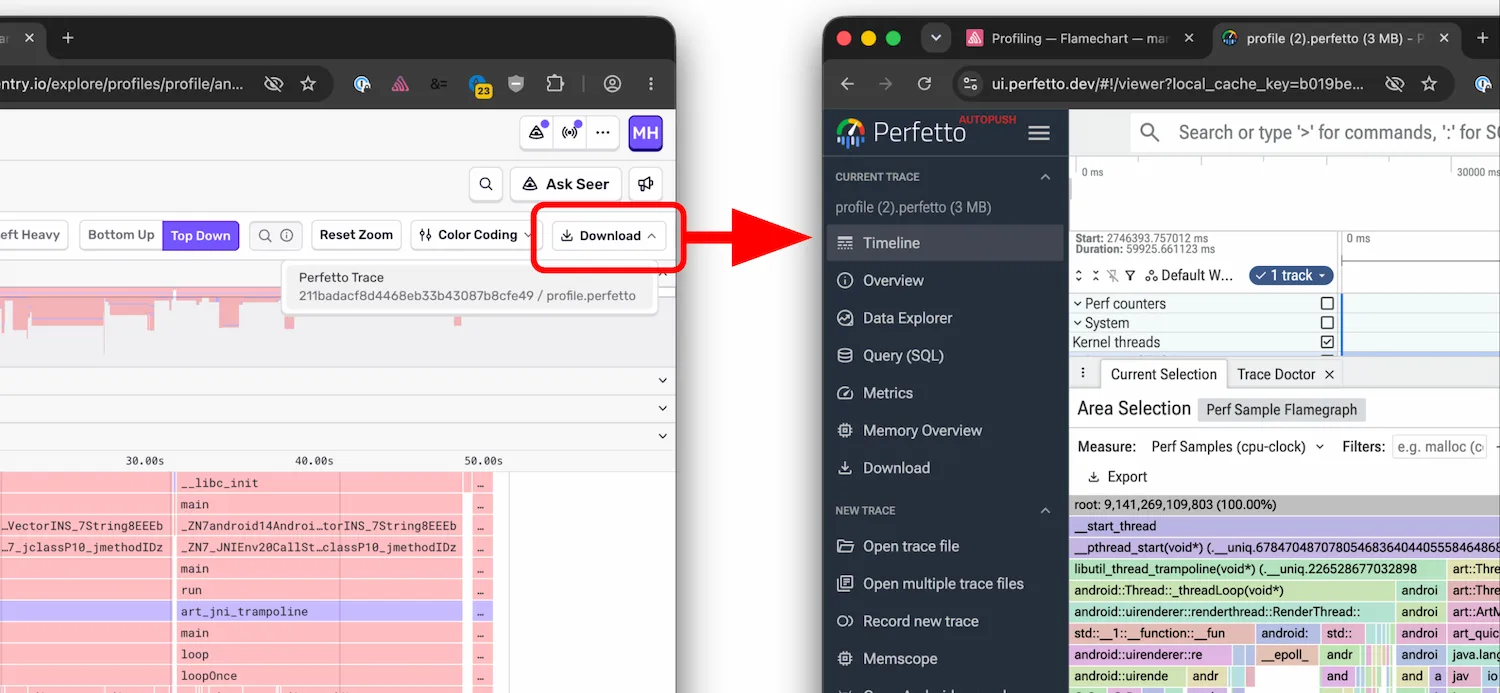
Need to go deeper than the flame chart? Download the raw Perfetto trace straight from the profile in Sentry and open it in ui.perfetto.dev.
Profiling in action
In any larger codebase, it’s hard to reason about which code runs where. Profiling gives you a different perspective: you see exactly what code ran, on which thread, and for how long. That makes unwanted behavior easy to spot.
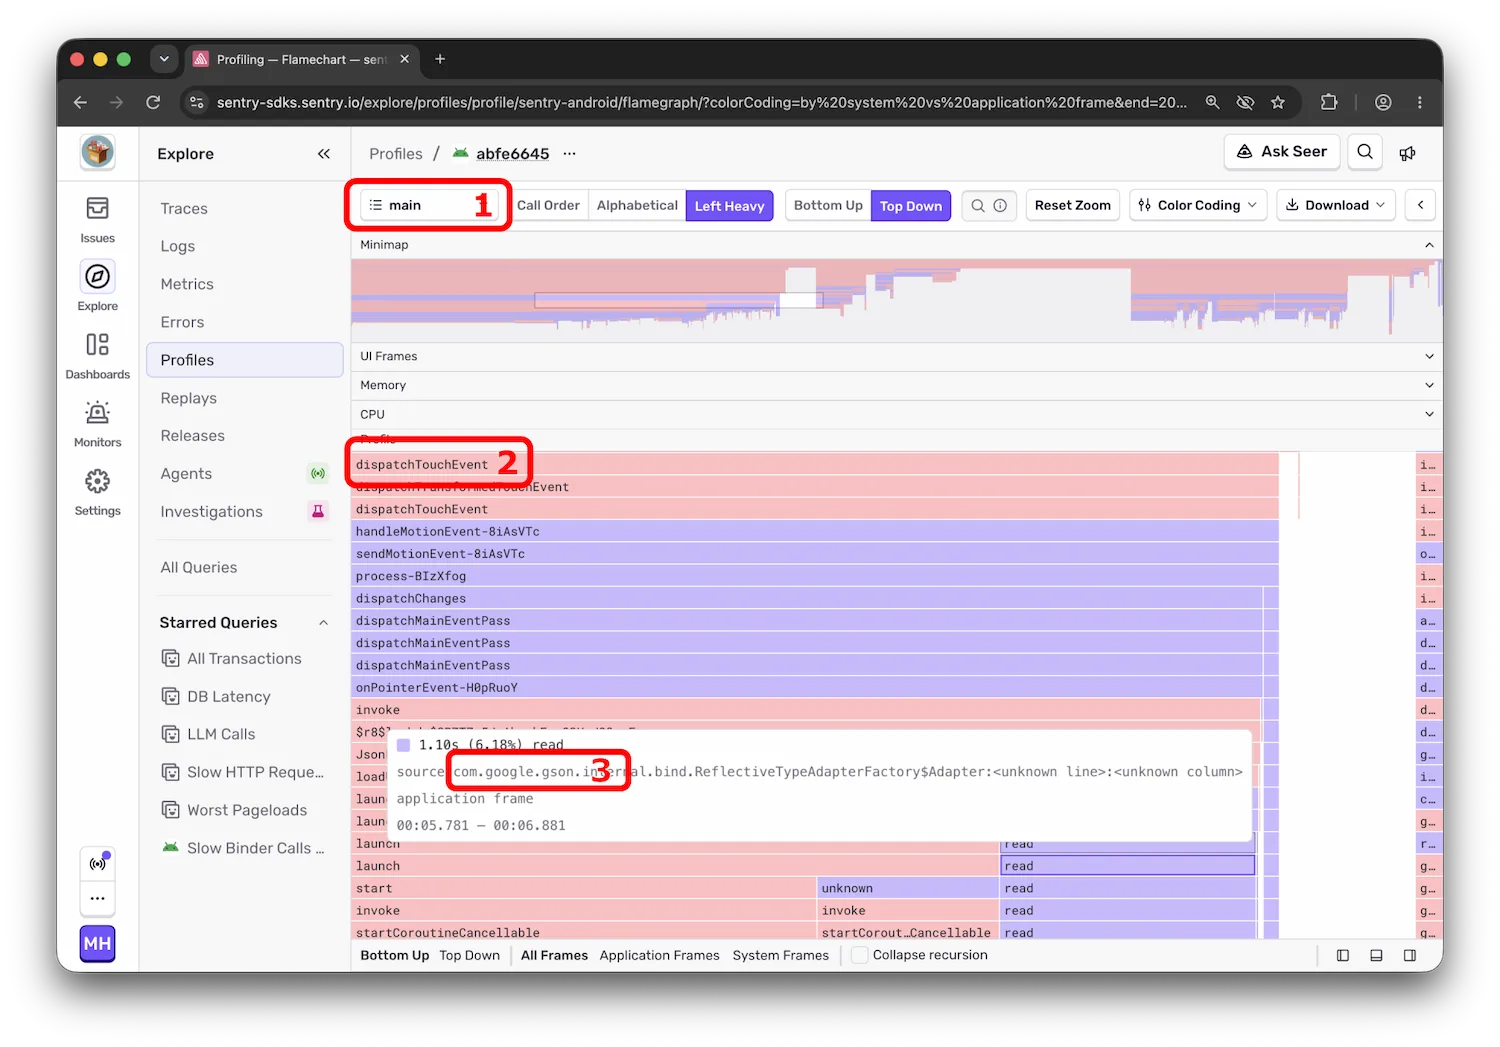
A classic example is a missing withContext(Dispatchers.IO). In the profile below, when examining the main thread (1) a user input is dispatched (2) and triggers a ViewModel. The ViewModel calls into a repository, and the repository parses a large JSON asset using the Gson library (3).
The UI, ViewModel, and repository layers each look correct on their own, but none of them moves the work off the main thread. The profile makes that obvious: Gson spends more than a second parsing a JSON blob on the main thread, causing UI freezes. The fix could be one line in the ViewModel:
suspend fun loadUsers(): List<User> = withContext(Dispatchers.IO) { repository.loadUsers()}
Device support and rate limits
ProfilingManager is only available on Android 15 and newer. Based on the latest numbers, this is about 41% of active Android devices (apilevels.com). Older devices fall back to the legacy profiler, unless you turn it off (more on that below).
The system also decides when to profile. Android rate limits profiling requests and doesn’t guarantee that it will fill them. In practice, this means that even with profileSessionSampleRate set to 1.0, not every session gets a profile. If you want to test locally without the limit, you can turn it off on your device:
adb shell device_config put profiling_testing rate_limiter.disabled true
Getting started
First, upgrade to the latest Sentry Android SDK. If you already use continuous profiling, that’s it: Android 15+ devices switch to Perfetto automatically.
We also added a new option, enableLegacyProfiling. It defaults to true, so older devices keep using the legacy profiler. If you want to avoid the legacy tracer completely, we recommend setting it to false:
SentryAndroid.init(this) { options -> // ... // Only profile on Android 15+ with Perfetto options.isEnableLegacyProfiling = false}
Most of a session happens after the page users landed on. With soft navigation web vitals in SDK v11, every page they visit gets its own LCP, CLS, and INP.
Two people and one beagle-shaped AI agent run madewithvuejs.com. Here's how Milly connects to GitHub, Linear, and Sentry to ship code and fix production bugs on her own.
Logs and metrics look nearly identical when you're instrumenting code. Using a signup handler as the example, here's how to tell which question each one answers, and when you can just count the logs.