Using Sentry Logs to Debug a Dynamic Sampling Issue
Using Sentry Logs to Debug a Dynamic Sampling Issue
Some of the team at Sentry spent this past quarter fixing bugs, more than 800 to be exact. Among them was a complex issue causing transaction spikes in our own Sentry project. Using Sentry Logs, we were able to investigate, trace the root cause, and resolve the problem.
The problem: Intermittent spikes and a 100% sample rate
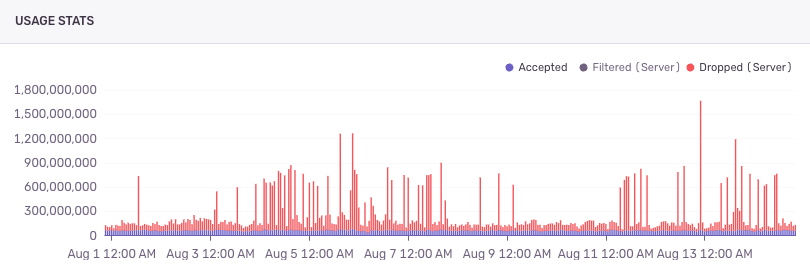
The initial symptom was clear: at the start of certain hours, our internal project would get flooded with spans, causing our project abuse layer to randomly discard huge amounts of data from the sentry project. But not all hours, and it would sometimes not kick in for a few days in a row. We quickly found that our dynamic sampling configuration was being overwritten with a rule to sample everything: {"type": "sampleRate", "value": 1.0}.
The purpose of this configuration is to provide the percentages of different projects and transactions that will be stored, and if that value is 1.0, we sample EVERYTHING. Sentry has a target sample rate of 2%, so suddenly receiving 50x the traffic is no joke.
But why was this happening? Our first hypothesis was that the rule generation logic was hitting a fallback case. To confirm this, we needed more visibility. The first step was to instrument the code by adding detailed logging statements that would give us some insight into the configuration at play here.
Using Logs to investigate
We started out by just logging the configuration JSON directly, and it turned out that these configurations can get really big, bigger than what GCP Logs would accept. Sentry Logs, however, would just truncate the JSON and give us the important info directly.
After a quick iteration to make our log payloads smaller and more semantically meaningful, we started getting the data we needed. As soon as the next instance of the issue occurred, we jumped into Sentry Logs to see what was happening. It turned out our original hypothesis was incorrect. It was not a fallback case, instead it looked like it ended up being a more interesting problem.
But first, a quick background on dynamic sampling
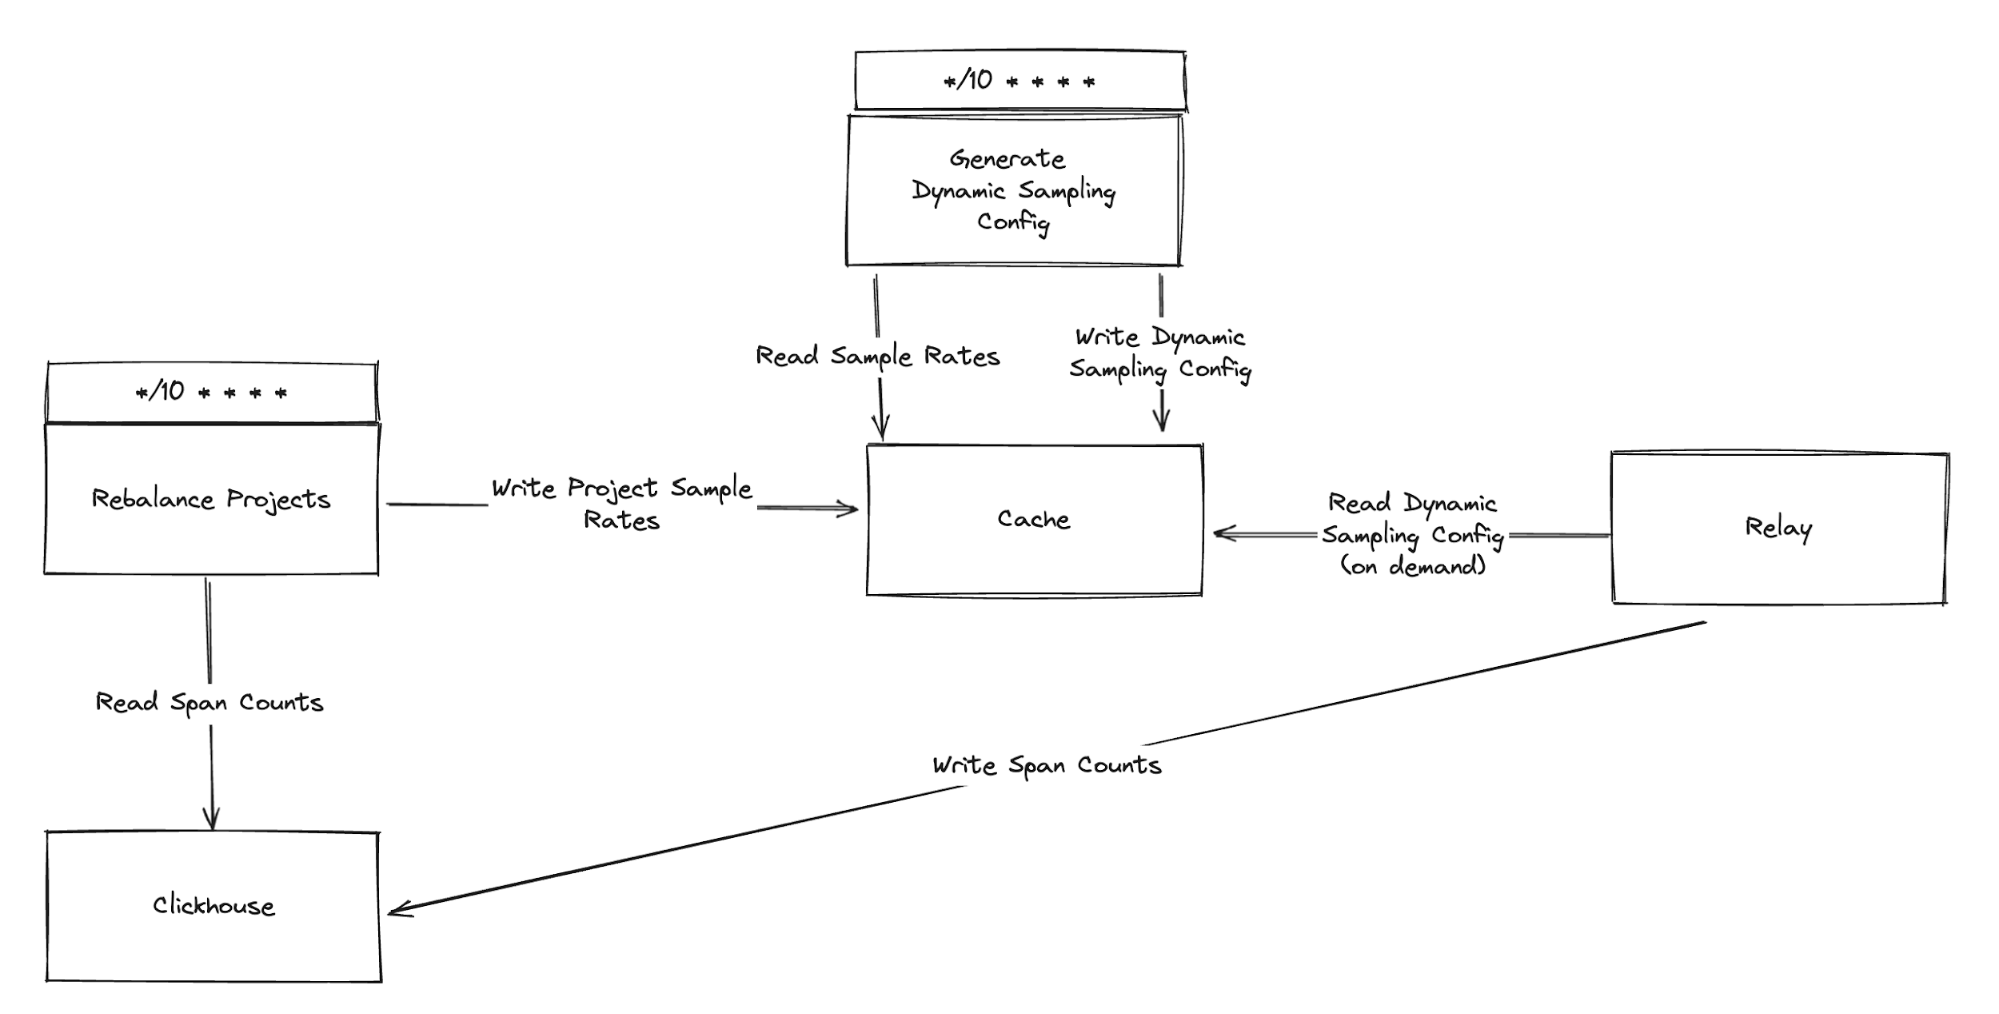
Dynamic sampling consists of multiple tasks that look at different metrics to figure out which sample rates to use for which projects and transactions. These metrics are stored in ClickHouse, and we depend on them to calculate the project sample rates, and in turn, how much data to store for each of the projects.
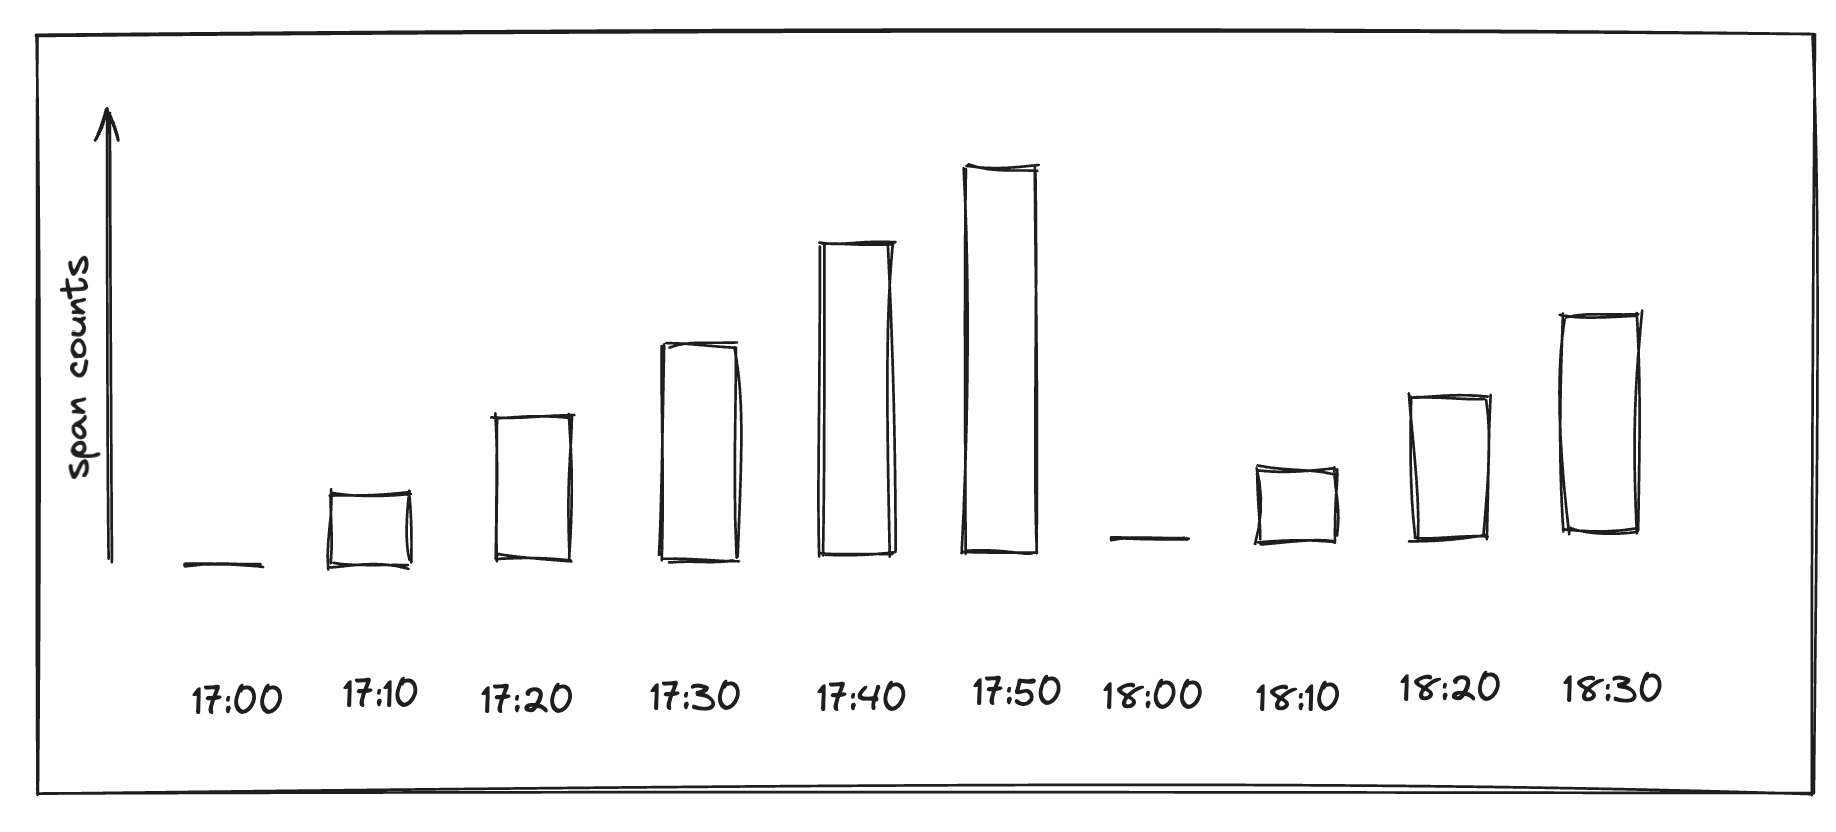
By logging this metric on every run, we saw a clear pattern:
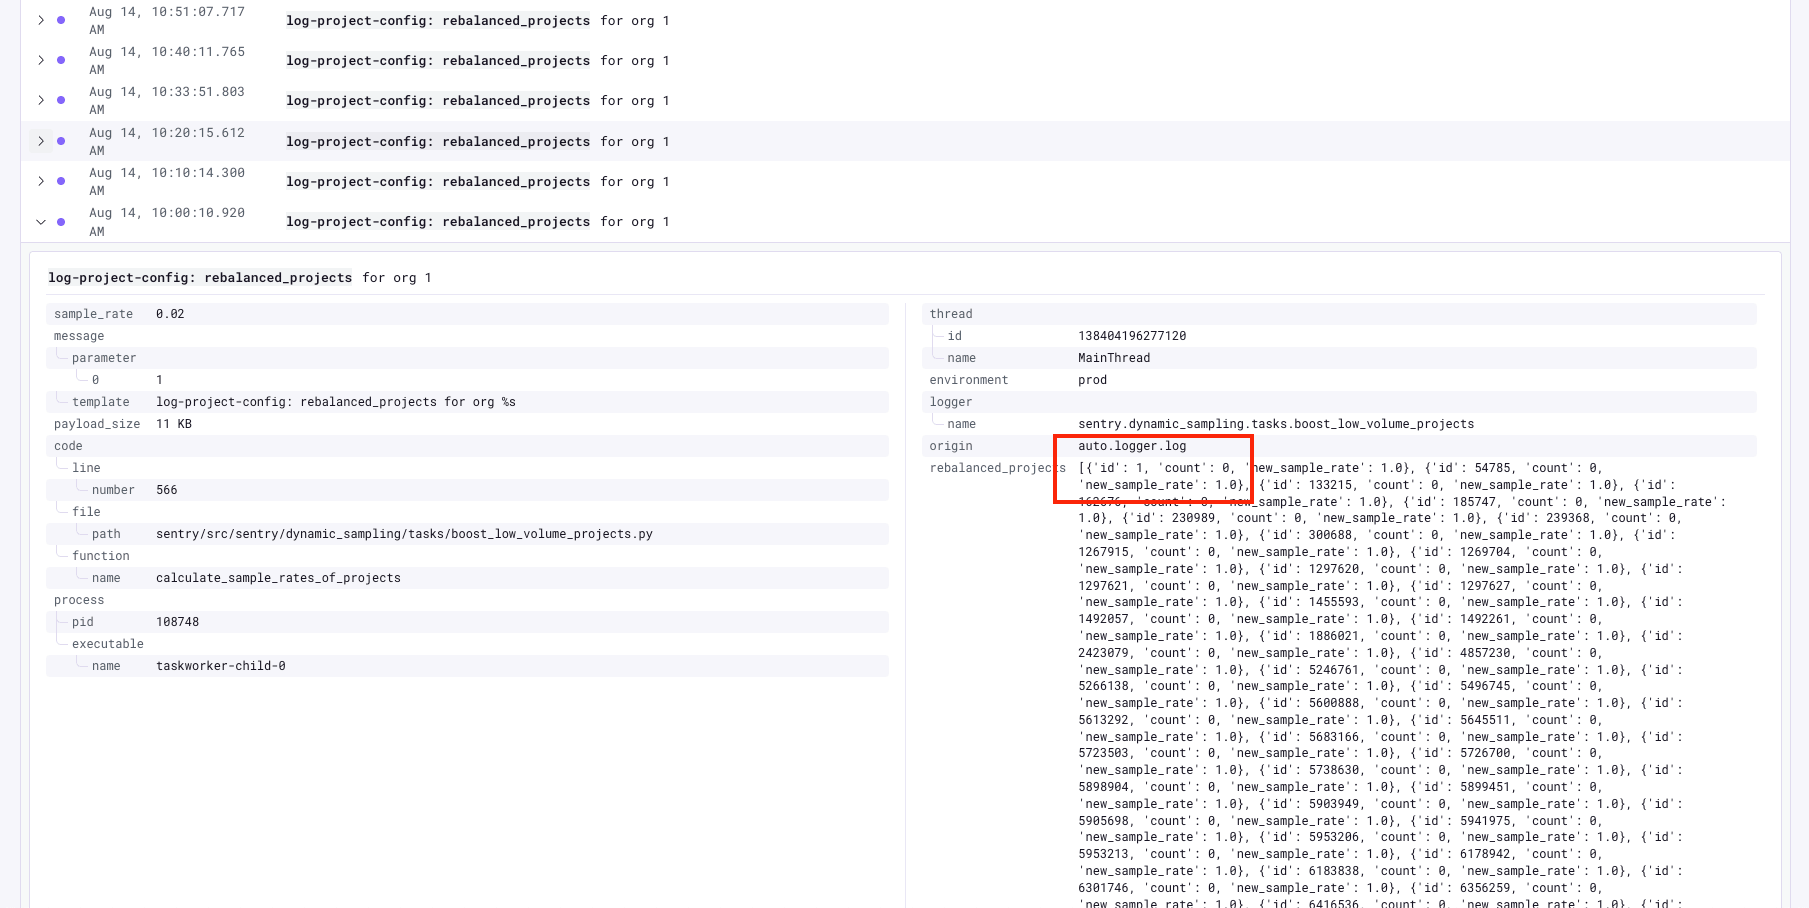
Logs from exactly 17:00 showed the input data for our project as
{'id': 1, 'count': 0, 'new_sample_rate': 1.0}At 17:10 it was N
At 17:20 it was 2 x N
...
At 17:50 it was 5 x N
At 18:00 it was 0 again.
This comparison, made simple by querying in Sentry Logs, was the turning point. It proved our sampling logic was working correctly based on its inputs. The problem wasn't in our code, but in the data being fed to it.
Sentry Logs had shifted our focus from debugging our application logic to investigating the upstream data source. By building up a kind of namespace for debugging dynamic sampling using a log prefix, we could see the state of different tasks running after each other in a single place:
Fixing the issue
With the knowledge that our system saw 0 samples in our highest-traffic project, we traced the issue to the ClickHouse query responsible for counting transactions. The query used a granularity of 3600 seconds (1 hour), which, due to its time-window alignment, returned zero when run precisely at the top of the hour. (For more info about how ClickHouse granularities and data-skipping indexes work, here are some docs explaining how it works )
This still didn't explain why the issue had only recently appeared. The final piece of the puzzle was that the same granularity bug also existed in the job that scheduled these rebalancing tasks. For months, it had been silently failing, never queuing the XX:00 job. Our recent migration to a new task execution system seems to have started running this task at times when the organization had data, but the project did not, allowing the scheduler to succeed, but the job to run on count:0 data.
Resolution and conclusion
The problem: There was a race condition that was recalculating the metrics in buckets, such that there were 0 samples at the same moment that dynamic sampling decisions were made.
The fix was straightforward: we changed the query granularity to 60 seconds and summed the results.
A week-long investigation culminating in what's essentially a one-liner (switched via options, of course, to make sure we don't break everything if we happen to be wrong):
And in the end, it worked - returning the Sentry project's abuse protection violations to previous levels:
This incident was a complex interaction between multiple systems, made visible by our own product. The ability to quickly add structured logs, depend on them being ingested, and exploring them in the UI to pinpoint the problem was incredibly useful in figuring out the underlying problem. It would have been quite difficult and time-consuming otherwise, especially because the mechanisms in question are not interlinked via traces, as different parts of the logic are executed in different tasks.
It’s a clear example of how Sentry Logs help debug complex issues that involve multiple tasks and states, and of how we use our own tools to improve Sentry itself.
New to logs? Try it out - all plans get 5GB for free. And if you're new to Sentry, sign up for free to get started.


