Now you can use Sentry Insights to trigger alerts and debug issues
Now you can use Sentry Insights to trigger alerts and debug issues
You deploy a fix late Friday and spend the weekend refreshing dashboards, hoping nothing breaks. You shouldn’t have to babysit a dashboard to know when something’s wrong.
With the latest updates to Insights, you can now create alerts directly from any chart. Whether it’s a spike in 4xx errors after a deploy, a jump in P95 latency for an API endpoint, or a drop in throughput for a background job, you can set up alerts with just two clicks. And with built-in anomaly detection for span metrics (available on Business and Enterprise plans), Sentry flags unusual behavior based on historical trends—no manual thresholds or "is 600ms bad?" debates.
What is Insights? And what's new?
Insights are out-of-the-box views that surface the parts of your system most likely to cause customer pain or fire drills. You’ll see high-level performance and error trends from your auto-instrumented spans. These spans represent operations like database queries, API calls, or function executions—basically the building blocks of application. Insights shows how those components are behaving across your app: request durations, slowest DB queries, response codes, throughput, and more—so when something’s off, you’re not just aware of it, you’re already on your way to fixing it. Or at least opening a ticket about it.
Sometimes spotting an issue is the easy part. Let's say you see a chart showing your p95 latency for an API suddenly spike from 200ms to 800ms post-deploy, and then go right back to normal. Now what? Did it happen for everyone? Is it something you need to fix now or just keep an eye on? These new updates help you get to answers for questions like this with fewer clicks and less friction:
Open charts in Explore to investigate deeper—group errors by region, slice latency by OS, or break down spikes by release.
Create alerts directly from charts so you get notified when something drifts—no more passive dashboard-watching. Including anomaly detection for span metrics to flag unexpected behavior without needing to define thresholds yourself (anomaly detection on span metrics is available on Business and Enterprise plans).
Copy charts to dashboards to keep your team’s key metrics in one place.
Catch slow query spikes in your user_profile_db
user_profile_dbQuery times from your user_profile_db start creeping up during peak hours. It’s subtle, easy to miss, and by the time someone notices, user-facing performance is already tanking.
With Insights, you can turn that chart into an alert. Just click the three-dot menu, select Create Alert for, and Sentry pre-fills the rule with your current view. Adjust the filters, thresholds, and notification settings to fit your needs (and yes, you can still go full control freak with static thresholds).
Choose from three types of thresholds:
Static: Alert when a metric is above or below a specific value
Percent Change: Alert when a value shifts compared to a previous period
Anomaly: Alert when values deviate from a learned baseline
Let’s say that query spike is due to a flaky downstream dependency. An anomaly alert will recognize the deviation from baseline and flag it—even if you hadn’t defined a threshold for that span. Helpful, especially if your future self forgets to come back and "clean up alerts later."
Or say your login flow breaks due to a third-party API issue. You get a Slack ping, check the Network Requests Insight, and see a spike in 4xx errors. You deploy a fix—and this time, set an alert from the chart so you’ll catch it early next time.
Track performance spikes and regressions by device model
Let’s say the Mobile Vitals Insight page shows a general uptick in your app's Time to Initial Display (TTID) for the latest release. Is this an issue for all users, or is it just hitting users on certain older devices?
Click the three-dot menu on the chart and open the metric in Explore. From there, group by device.model to see if users on specific devices are disproportionately affected—no handcrafted queries or spreadsheets required.
Spot frontend regressions before they pile up
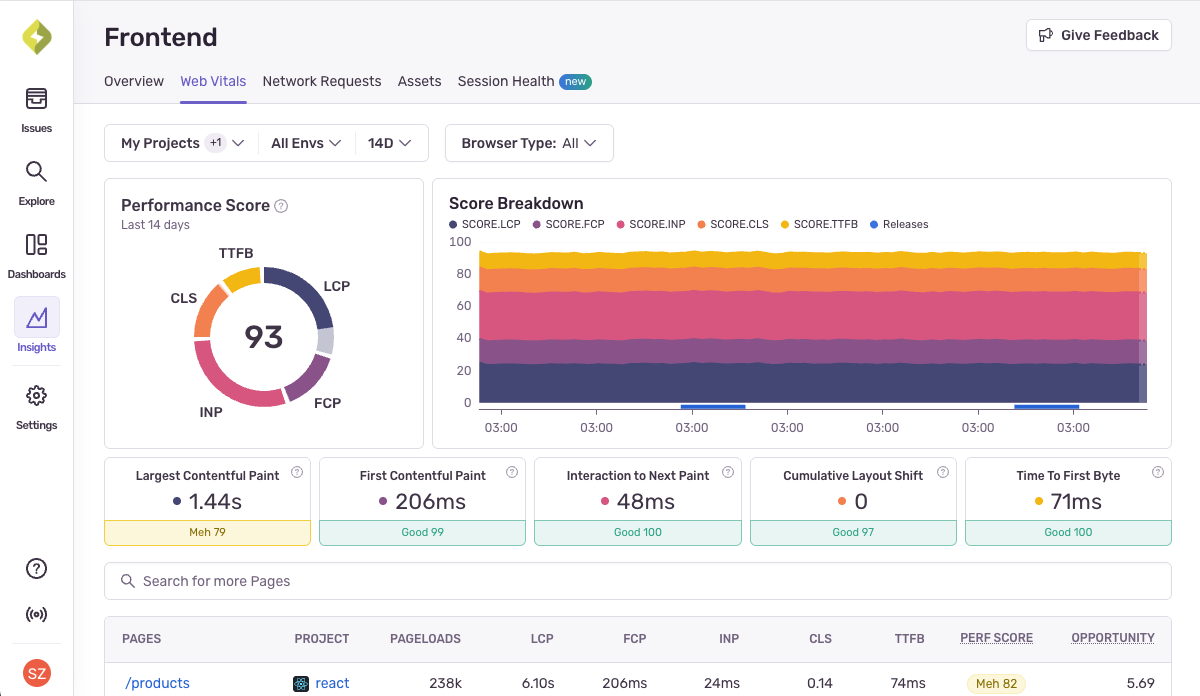
It’s Monday morning. Your team just deployed a product page refresh, and you’re doing a quick scan of the Web Vitals Insight page. You notice a subtle dip in LCP performance. Not huge, but enough to raise an eyebrow.
The drop aligns perfectly with Friday’s deploy (of course). Then you group by browser—and find that the slowdown is mostly affecting a headless browser used by a web crawler.
Rather than leave this as a “we should look into that,” you copy the LCP chart to your team’s "Frontend Performance" dashboard and set up a custom anomaly alert. If LCP starts trending out of bounds again—especially for actual users—you’ll know before your CEO finds out from a social post.
Get started
The goal with these updates is simple: make it easier to find problems, understand and fix them. Check out the new updates in the Insights tab in Sentry today, and let us know what you think on Discord or GitHub. Or, if you’re new to Sentry, get started for free.


