Trace-connected structured logging with LogTape and Sentry
Trace-connected structured logging with LogTape and Sentry


As our applications grow from simple side projects into complex distributed systems with many users, the “old way” of console.log debugging isn’t going to hold up. To build truly observable systems, we have to transition from simple text logs to structured, queryable, trace-connected events.
Would you rather watch this blog in a video format? Check out Production Logging for JS with LogTape + Sentry on YouTube.
TL;DR: The Logging Strategy Shift
Many of us treat logs like a breadcrumb trail, verifying that each line executes, and logging the outputs for debugging. In production, that breadcrumb trail turns into a mountain of noise. We need to move from logging the process to logging the milestone.
Clear the noise: Move away from "thin" logs that create noise, are difficult to query and correlate.
Embrace high cardinality: Pack your logs with "fat" context that builds up over a task. Include User IDs, Order IDs, Cart information, and more so you can query for the data you need for any given event.
Connect the dots: Use Sentry to keep logs trace-connected; linking every log to the specific request that triggered it.
The Log Dump: Why console.log fails in production
console.log fails in productionOnce logs stop being centralized and chronological, console.log breaks down. In a production environment with multiple users and services, your logs quickly turn into an interleaved stream of events with no clear way to reconstruct what happened for any single request.
console.log("user <user_1> logged in")
console.log("order failed <order_id>")
console.log("user <user_2> logged in")
console.log("cart cleared <user_1>")
Without a shared trace to connect related logs and useful, filterable data, these logs become essentially useless in production.
Implementing production-grade logging with LogTape and Sentry
Sentry provides trace-connected logging. With traces, you can see the full context of a request, including all of the logs associated with it. This will give us an easy way to query for the traces and logs associated with an issue or request.
Additionally, Sentry provides a powerful query engine that we can use to search our logs based on attributes and structured data. From there, we can create alerts and dashboards based on our results.

LogTape is a lightweight logging library for all JavaScript runtimes. Logging libraries like LogTape provide a way for us to instrument our code with automatic, rich structured logging and send those logs to Sentry using a "log sink".

Structured logging is a format where, instead of simple strings, we treat a log as a structured object with defined properties.
That allows us to write powerful queries and filters to find and surface the data we need from our logs for debugging in production.
import { getLogger } from "@logtape/logtape";

const logger = getLogger(["my-app"]);

logger.info("User clicked a button!", {
  userId: 123456,
  username: "johndoe",
  loginTime: new Date(),
});
Example from the LogTape Structured Logging manual
Quick start: Next.js setup
We'll be using the Next.js framework for this example, but the concepts can be applied to any JavaScript framework.
You can follow the Quick Start guide for your framework of choice to initialize Sentry in your project. For Next.js, we'll use the @sentry/wizard to initialize Sentry in the project.
npx @sentry/wizard@latest -i nextjsAfter the wizard completes, you should see that a few files were created in your project, which will automatically instrument your project with error monitoring and begin capturing traces and logs.
instrumentation-client.ts— Runs in the browsersentry.server.config.ts— Runs in Node.jssentry.edge.config.ts— Runs in edge runtimes
Your instrumentation-client.ts file should look similar to this:
import * as Sentry from "@sentry/nextjs";
Sentry.init({
  dsn: process.env.NEXT_PUBLIC_SENTRY_DSN,
  // Adds request headers and IP for users
  sendDefaultPii: true,
  tracesSampleRate: process.env.NODE_ENV === "development" ? 1.0 : 0.1,
  enableLogs: true,
});
export const onRouterTransitionStart = Sentry.captureRouterTransitionStart;
You'll also have a new /sentry-example-page route that will help you test that Sentry is working.
If you start your development server, navigate to the example page, and click the "Throw error" button, you'll see the issue captured in Sentry, and the associated trace.
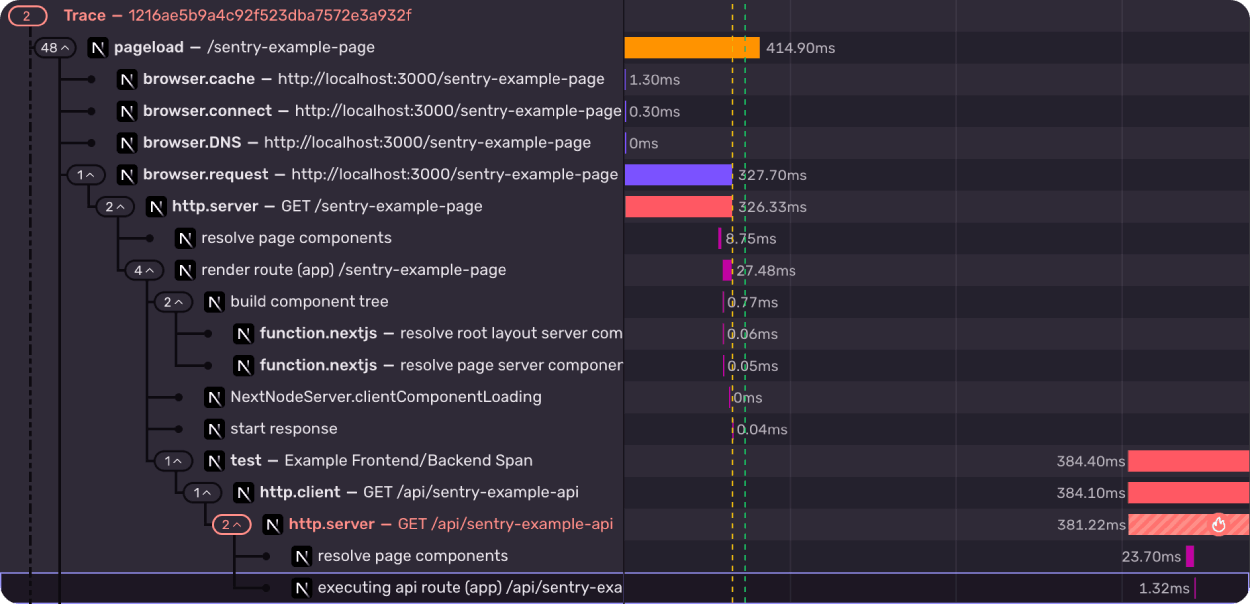
This trace links everything related to a request, including issues, session replays, and logs.
Configuring LogTape with Sentry
We are already configured to receive logs on Sentry, but we need to define how we want to send those logs.
To receive structured logs with LogTape, we'll take advantage of the "log sink". Rather than (or in addition to) sending the logs to the console, we can send our trace-connected logs directly to Sentry.
First, install the LogTape and LogTape Sentry packages:
pnpm add @logtape/logtape @logtape/sentryClient-side configuration
In your instrumentation-client.ts file that we looked at above, we'll add the LogTape configuration.
import * as Sentry from "@sentry/nextjs";
import { configure, getConsoleSink } from "@logtape/logtape";
import { getSentrySink } from "@logtape/sentry";

// 1. Initialize Sentry first (always before Logtape!)
Sentry.init({
  dsn: process.env.NEXT_PUBLIC_SENTRY_DSN,
  tracesSampleRate: 0.1,
  replaysSessionSampleRate: 0.1,
  replaysOnErrorSampleRate: 1.0,
  integrations: [Sentry.replayIntegration()],
  sendDefaultPii: true,
});

// 2. Configure Logtape with Sentry sink
await configure({
  sinks: {
    console: getConsoleSink(),
    sentry: getSentrySink()
  },
  loggers: [
    { category: "nextapp-demo", lowestLevel: "debug", sinks: ["console", "sentry"] }
  ],
});

export const onRouterTransitionStart = Sentry.captureRouterTransitionStart;
We'll break this down after we configure the rest, but in short, we're configuring LogTape so that when we use the logger object, it will send the logs to the console and Sentry.
We are also setting a category for the logs, which will be used to group logs together in Sentry by domain.
Server-side configuration
LogTape has a special feature called contexts that allows us to pass data down the call stack. Meaning, we can easily append contextual data to the log stack at any point, to be included in any logs submitted.
On the backend, we can take advantage of implicit contexts, which will allow us to append data to all logs in the stack. By adding the configuration below, we can utilize the withContext method to automatically insert data at the current scope, and all subroutines will inherit that information automatically.
In your sentry.server.config.ts file, we'll add the LogTape configuration for the server.
// sentry.server.config.ts
import * as Sentry from "@sentry/nextjs";
import { configure, getConsoleSink } from "@logtape/logtape";
import { getSentrySink } from "@logtape/sentry";
import { AsyncLocalStorage } from "node:async_hooks";

// 1. Initialize Sentry
Sentry.init({
  dsn: process.env.SENTRY_DSN,
  tracesSampleRate: 0.1,
  sendDefaultPii: true,
});

// 2. Configure Logtape with implicit context support
await configure({
  sinks: {
    console: getConsoleSink(),
    sentry: getSentrySink(),
  },
  loggers: [
    { category: "nextapp-demo", lowestLevel: "debug", sinks: ["console", "sentry"] },
  ],
  // Enable implicit contexts - Node.js supports AsyncLocalStorage
  // This allows withContext() to propagate user info through the entire request
  contextLocalStorage: new AsyncLocalStorage(),
});
We'll use implicit context inheritance to build up and collect data throughout our app in a partially automated way. Then when we do finally log a message, it will contain debugging information from the whole stack until that point.
Using LogTape in your Next.js app with Sentry
With Sentry and LogTape configured, we can start using the logger object to log messages.
import { getLogger } from '@logtape/logtape';

const logger = getLogger(['nextapp-demo', 'api']);

logger.info('User login attempt', { userId: '123', method: 'google' });

logger.error('Login failed', {
  userId: '123',
  reason: 'Invalid OAuth token',
  provider: 'google',
});
We use getLogger to fetch the root logger for the given category, which we set in the instrumentation-client.ts, and sentry.server.config.ts files for the frontend and backend, respectively.
You'll notice here we have also set an additional category api, which will ensure all logs on this scoped child logger will be tagged with category: nextapp-demo.api , which we can query later.
You can continue to scope this further as needed with nesting.
const logger = getLogger(["nextapp-demo", "api", "posts"]);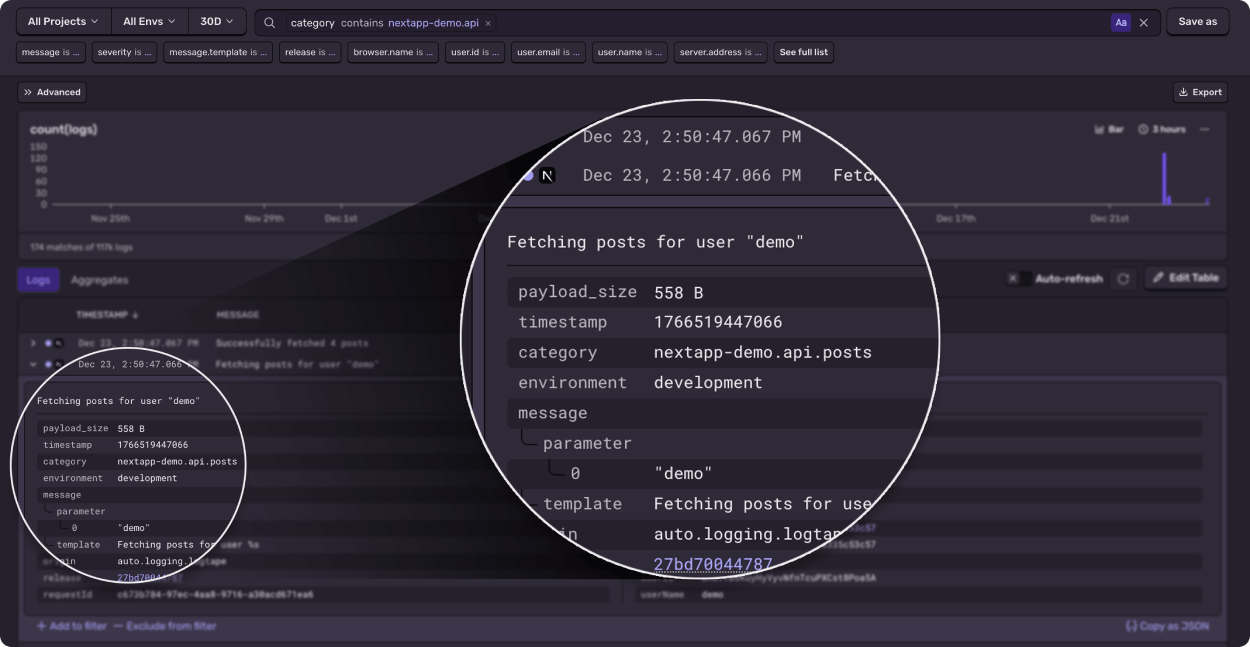
In Explore > Logs, this query is searching for logs where category "contains" nextapp-demo.api, meaning this query shows all API logs, including those under the .api.posts, nested category.
Querying LogTape in Sentry
After collecting a few logs from your frontend and backend in your app, navigate to the Log Explorer in Sentry.

We saw that we can set categories, like api, or even an array of nested categories. Combined with the structured data sent in our logs, we can build queries based on any available attributes.
import { getLogger, withContext } from "@logtape/logtape";
import { randomUUID } from "node:crypto";

const logger = getLogger(["nextapp-demo", "api", "posts"]);

export async function getPosts(session: Session) {
  return withContext(
    {
      userId: session.user.id,
      userEmail: session.user.email,
      userName: session.user.name,
      requestId: randomUUID(),
    },
    async () => {
      // The {userName} placeholder is replaced by the value in the context by the `info()` function
      logger.info("Fetching posts for user {userName}");

      const posts = await db.posts.findMany();
      return posts;
    }
  );
}
Each log created with our logger will contain the inherited attributes, all options we can query on.
category:nextapp-demo.api.posts severity:info userId:0h6vYb3KuyHyVyvNfnTcuPXCst8Poa5AFrom queries to alerts and dashboards
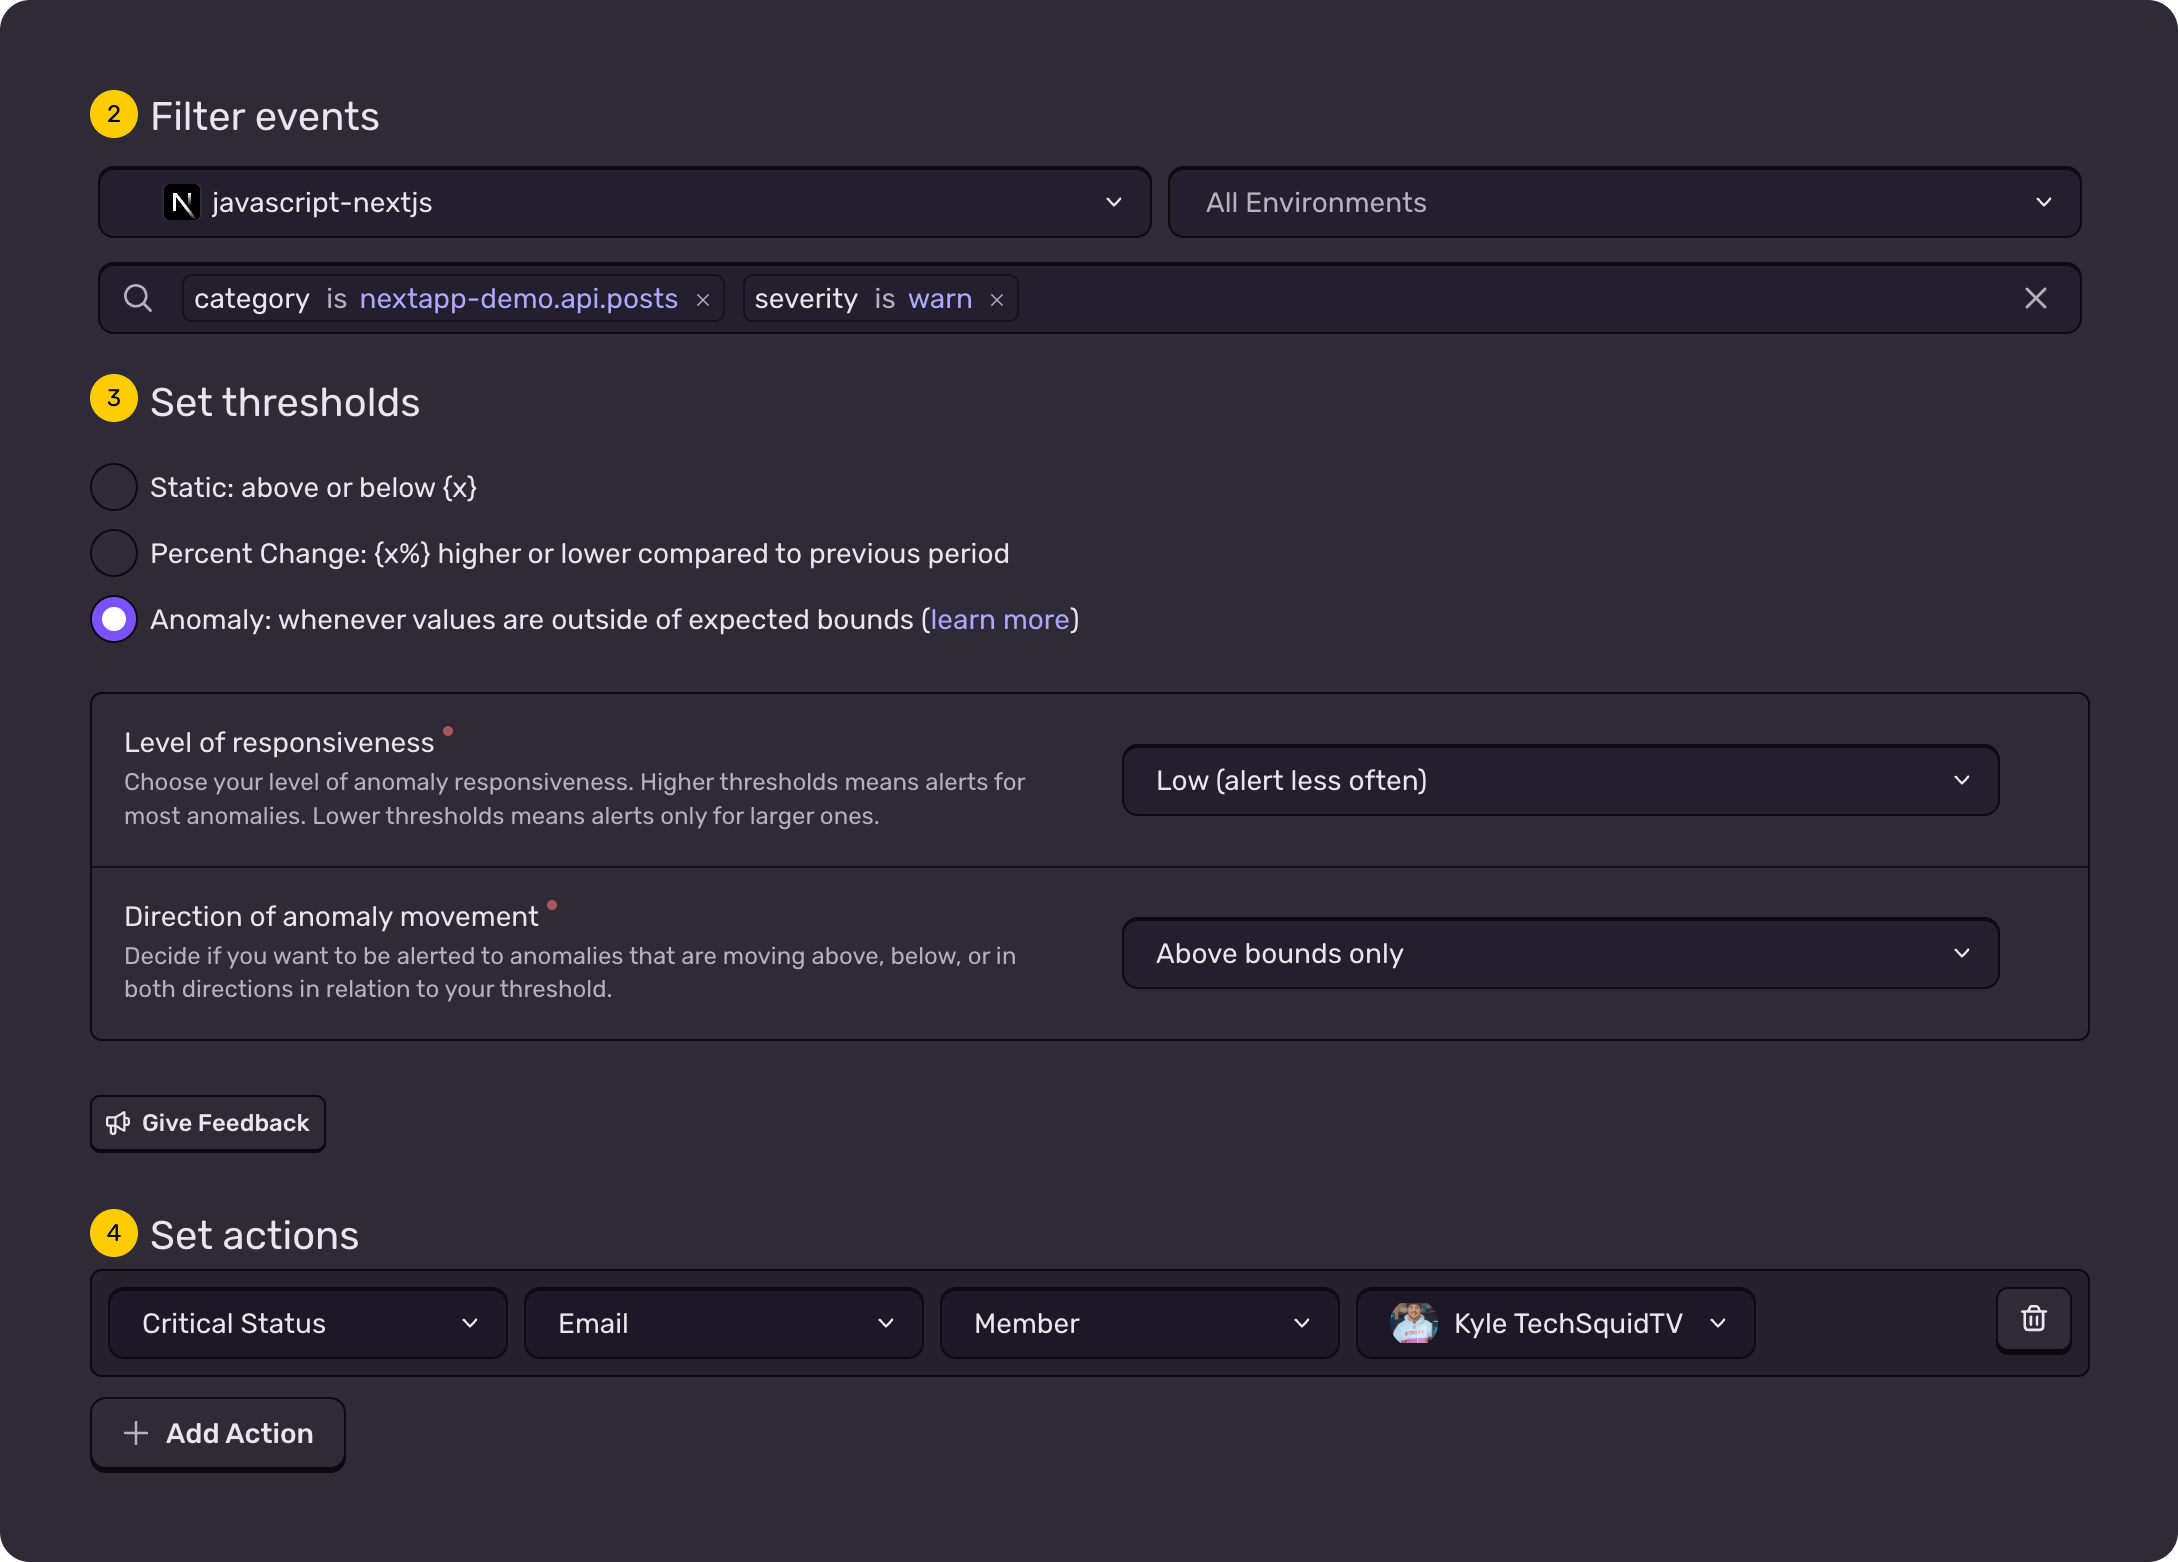
Once your logs are structured and queryable, you can turn those same queries into alerts and dashboards in Sentry.
Now you can configure alerts, for example, where there is a higher-than-average number of warn logs in a given component or service, and you can configure that specific alert to notify a specific team or developer.
Strategy: What (and when) to log
Before we instrument every function, we need a plan. High-volume production apps can generate millions of logs, leading to "noise" that's potentially difficult to sift through, and eats through storage limits.
Choosing the right level
We use log levels as a top-level filter to reduce the noise. In production, we typically set our Sentry sink to info or warn, while keeping the console sink at debug for local work.
import { configure, getConsoleSink, withFilter } from "@logtape/logtape";
import { getSentrySink } from "@logtape/sentry";

const isDev = process.env.NODE_ENV === "development";

await configure({
  sinks: {
    // 1. Console: Show 'debug' in dev, but only 'info' in prod
    // Some cloud providers will also collect console logs.
    console: withFilter(getConsoleSink(), isDev ? "debug" : "info"),

    // 2. Sentry: Always filter to 'info' to save on quota/noise
    sentry: withFilter(getSentrySink(), "info"),
  },
  loggers: [
    {
      category: "nextapp-demo",
      lowestLevel: "debug", // The logger remains open to all levels
      sinks: ["console", "sentry"]
    },
  ],
});
Debug: High-volume data (e.g., "Rendering PostItem ID: 123").
Info: Major lifecycle events (e.g., "User login," "Payment processed").
Warn: Recoverable issues (e.g., "API timeout, retrying").
Error: Critical failures that require immediate attention.
When to log: The event-driven approach
To keep our signal-to-noise ratio healthy, we don't log every line of code. Instead, we log transitions:
The "Happy Path" Boundaries: Log when a major process starts and ends (e.g.,
checkout_started->checkout_completed).External Dependencies: Calling an external dependency has a high potential for failure. You may want to add a log prior to calling any external dependencies, specifically with data from the request payload that may be useful in debugging in the event of failures in the future.
Recoverable Errors (Warn): Use the
warnlevel for things that didn't break the app but aren't "normal," like a cache miss that required a heavy database rebuild. These types of queries will be especially useful for monitoring performance or creating alerts.
Less logs, more cardinality
A common trap is thinking you shouldn't “stuff” your logs with data because it might bloat log sizes or increase costs. In reality, a thousand logs won't help you if they don’t contain the specific data needed to reproduce a bug.
Cardinality refers to the uniqueness of the data within your logs. High-cardinality data includes things like userId, sessionId, orderId, and requestId. While older self-managed logging stacks struggled with high-cardinality data (it made queries slow), modern tools like Sentry thrive on it.
The shift: From "chatty" to "contextual"
We want to move away from logging every individual line of execution and instead move toward logging milestones with accumulated context.
Consider a cart checkout flow. In the "old way," you might have several distinct log lines:
The "Chatty" trace (Distributed but thin)
// ❌ The "Chatty" Way (Low Context, High Noise)
logger.info("Checkout started");
logger.info("Validating cart");
logger.info("Applying discount");
logger.info("Payment successful");
You have multiple “thin” logs, each trace connected, but the data within can’t easily be queried together. To see the orderId and the totalAmount, you have to click through the trace, find the specific "Payment processed" log, and hope the developer included the ID there.
The "High-Cardinality" event (Rich and actionable)
Instead of relying on the trace to "stitch together" a story from thin logs, we log milestones with accumulated context.
// ✅ High Cardinality - One log tells the whole story.
logger.info("Purchase Completed", {
  orderId: "ord_5521",
  userId: "user_987",
  cartTotal: 125.50,
  discountCode: "SAVE20",
  latencyMs: 850,
  itemCount: 3
});
Even with tracing, high-cardinality logs are superior for two reasons:
1. Global searchability
Tracing helps you debug one specific request. High-cardinality logs help you debug the entire system. You can go to the Sentry Log Explorer and ask:
"Show me every 'Purchase Completed' event in the last 24 hours where discountCode was 'SAVE20' and latencyMs was > 2000."
You can't do that if the discount code was buried in a different log line three steps back in the trace.
2. Reduced mental overhead
When you open an issue in Sentry, seeing one "fat" log entry with all relevant IDs and state is significantly faster than hunting through a list of 20 "thin" logs to piece together what the user was doing.
By focusing on "Event-Driven" logs with high cardinality, you turn your logs from a simple diagnostic trail into a powerful internal analytics engine.
Real-world usage of LogTape in React
Unlike the backend, the browser lacks the AsyncLocalStorage API for implicit context. To avoid manually attaching user data to every log, we can use React Context to automate inheritance.
Let’s take a look at how to structure our project with React Contexts to automatically instrument our logs with useful data contextually.
Create a logger context.
In *lib/logger-context.tsx*, or wherever you define your context providers, create this file.
"use client";

import { createContext, useContext, useMemo } from "react";
import { getLogger, type Logger } from "@logtape/logtape";
import { useSession } from "@/lib/auth-client"; // Your auth provider

interface LoggerContextValue {
  logger: Logger;
}

const LoggerContext = createContext<LoggerContextValue | null>(null);

export function LoggerProvider({ children }: { children: React.ReactNode }) {
  const { data: session } = useSession();
  const baseLogger = getLogger(["nextapp-demo", "app"]);

  // Create a contextualized logger when user session changes
  const logger = useMemo(() => {
    if (session?.user) {
      return baseLogger.with({ user: session.user });
    }
    return baseLogger.with({ user: { id: "anonymous" } });
  }, [session?.user, baseLogger]);

  return (
    <LoggerContext.Provider value={{ logger }}>
      {children}
    </LoggerContext.Provider>
  );
}

export function useLogger(): Logger {
  const context = useContext(LoggerContext);
  if (!context) {
    console.warn("[useLogger] Called outside of LoggerProvider");
    return getLogger(["nextapp-demo", "app"]);
  }
  return context.logger;
}

// Child logger for component-specific categories
export function useChildLogger(category: string): Logger {
  const parentLogger = useLogger();
  return useMemo(() => parentLogger.getChild(category), [parentLogger, category]);
}
Then, wrap your app with the provider. This is usually done with layouts.
import { LoggerProvider } from "@/lib/logger-context";

export default function RootLayout({ children }: { children: React.ReactNode }) {
  return (
    <html lang="en">
      <body>
        <LoggerProvider>
          {children}
        </LoggerProvider>
      </body>
    </html>
  );
}
Now every component gets a logger with user context automatically:
// Any client component
"use client";
import { useLogger } from "@/lib/logger-context";

export function PostItem({ post }) {
  const logger = useLogger();

  const handleDelete = async () => {
    logger.info("Deleting post", { postId: post.id });
    // User info is automatically included!

    try {
      await deletePost(post.id);
      logger.info("Post deleted successfully", { postId: post.id });
    } catch (err) {
      logger.error("Failed to delete post", { postId: post.id, error: err });
    }
  };

  // ...
}
Every log automatically includes { user: { id, email, name } } without manual configuration!
The .LOG (Recap)
Structured data > Strings: Use objects to make logs searchable.
Nested organization: Use nesting categories to easily query up and down a stack.
Sink strategy: Utilize filtered sinks to send only the data you want to send, where you want to send it.
Context is King: Use
AsyncLocalStorage(Server) andReact Context(Client) to stop repeating yourself in log statements, and ensure the data you need is included.Traceability: Easily discover all logs in a single request via traces.
High cardinality: Use high cardinality logs at the end of events to create rich metrics from queries.
Monitoring: Use alerts and custom dashboards to keep an eye on important metrics.
You can read more about LogTape and structured logging in the LogTape manual. Get more acquainted with Sentry’s logs with our interactive demos.