Smarter debugging with Sentry MCP and Cursor
Smarter debugging with Sentry MCP and Cursor
Debugging a production issue with Cursor? Your workflow probably looks like this: Alt-Tab to Sentry, copy error details, switch back to your IDE, paste into Cursor. By the time you’ve context-switched three times, you’ve lost your flow and you’re looking at generic suggestions that don’t show any understanding of your actual production environment or codebase.
Cursor and the LLMs can write great code, but they don't know about your production errors, user interaction flows, impact metrics, or deployment history, or even your architecture. That context makes the difference between “Here’s some pattern matching and generic error handling” and “This specific API endpoint is failing for 47% of your users since yesterday’s commit that deployed to one of its adjacent services.”
With the Sentry MCP Server, Cursor gets direct access to all the context that Sentry has surrounding your production (and development) application performance. No more copying and pasting error messages, logs, or trying to describe your distributed tracing setup or stack traces in chat. MCP can investigate real issues, understand their impact, and suggest fixes based on the actual production context.
However, when you hit complex, system-wide problems that span multiple areas of your application architecture, Sentry’s Seer really starts to shine as your “AI Debugger”. While Cursor is great at targeted fixes on its own, using MCP Server's with it still requires you to manually bring each aspect of the application performance you query in it and stitch it all together yourself - and even then, sometimes MCP results just aren't consistent. MCP isn’t perfect by a long shot. Seer shines at automatically finding patterns across your entire project, running deep research against that Sentry context, and tackles finding root causes and building real solutions.
Fortunately, we’ve built tools into the Sentry MCP server to make it easy to query all of this information and also tools to call Seers Issue Fix functionality. Using it is far easier than juggling error logs between windows. A few clicks in Cursor’s settings is all it takes to pull in real‑time production data straight into your editor, no copy‑paste required.
Set up Sentry MCP with Cursor
Setting up Sentry’s MCP with Cursor takes about 30 seconds. You’ll have the best experience with Cursor 1.0 or later since that’s when they added proper OAuth and HTTP Streamable support for MCP.
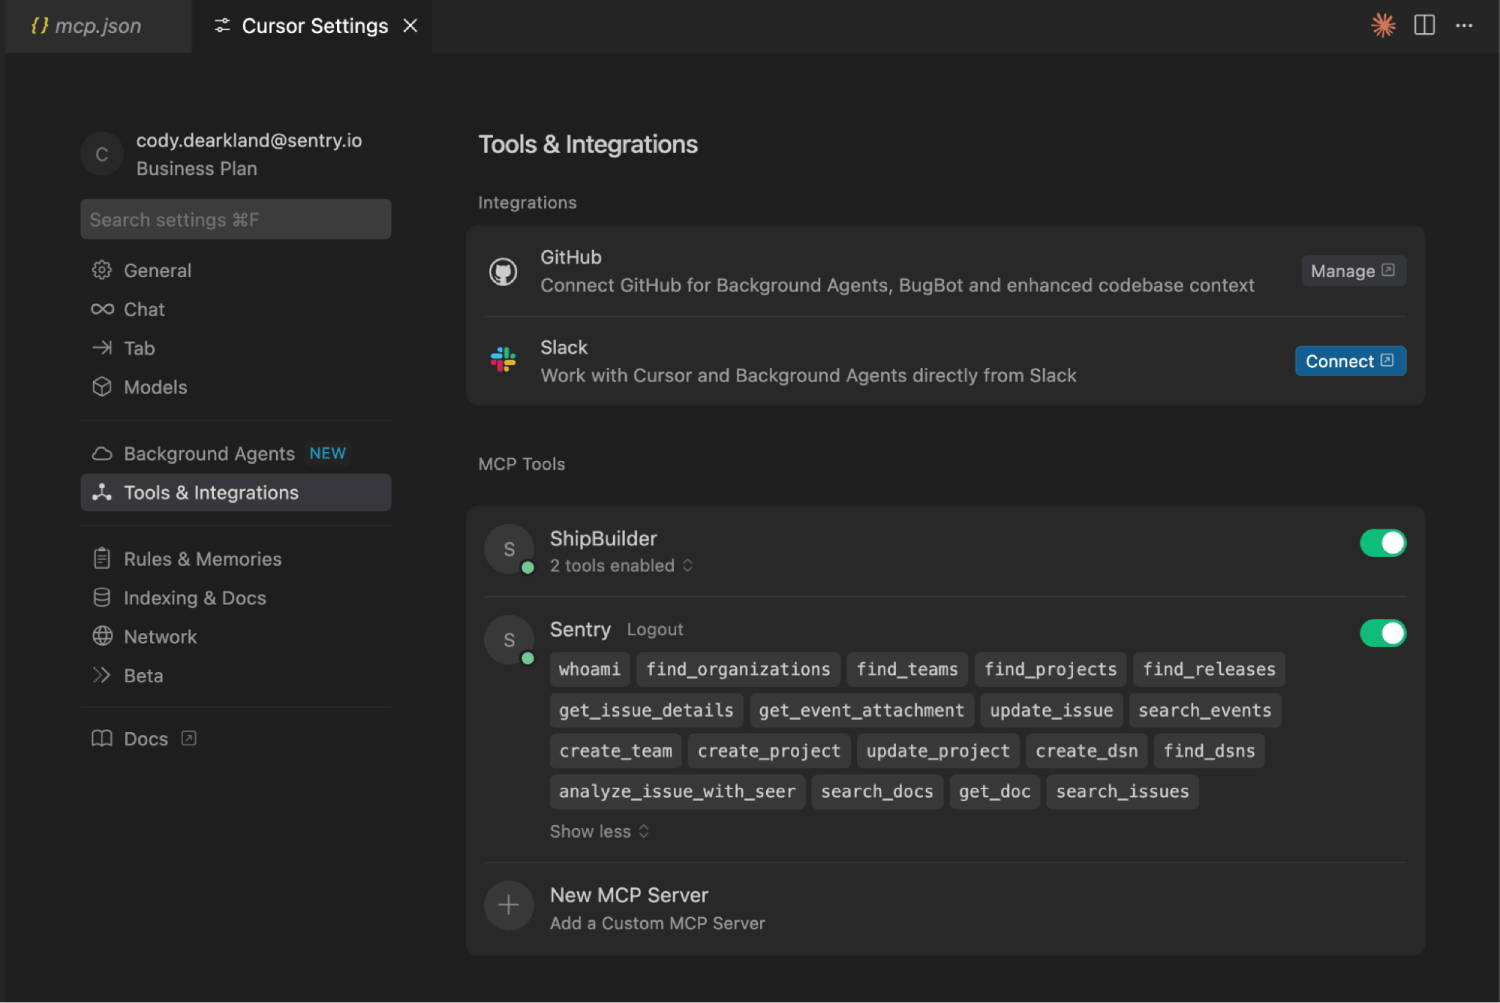
Open Cursor Settings, navigate to Tools & Integrations, click New MCP Server, and add a new global MCP server. Here’s the configuration you’ll need:
{
  "mcpServers": {
    "sentry": {
      "url": "https://mcp.sentry.dev/mcp",
    }
  }
}
Save the settings and just like that, you should be prompted for your authentication via OAuth. Click through to authenticate with your Sentry account and you’re done.
MCP Configured Successfully
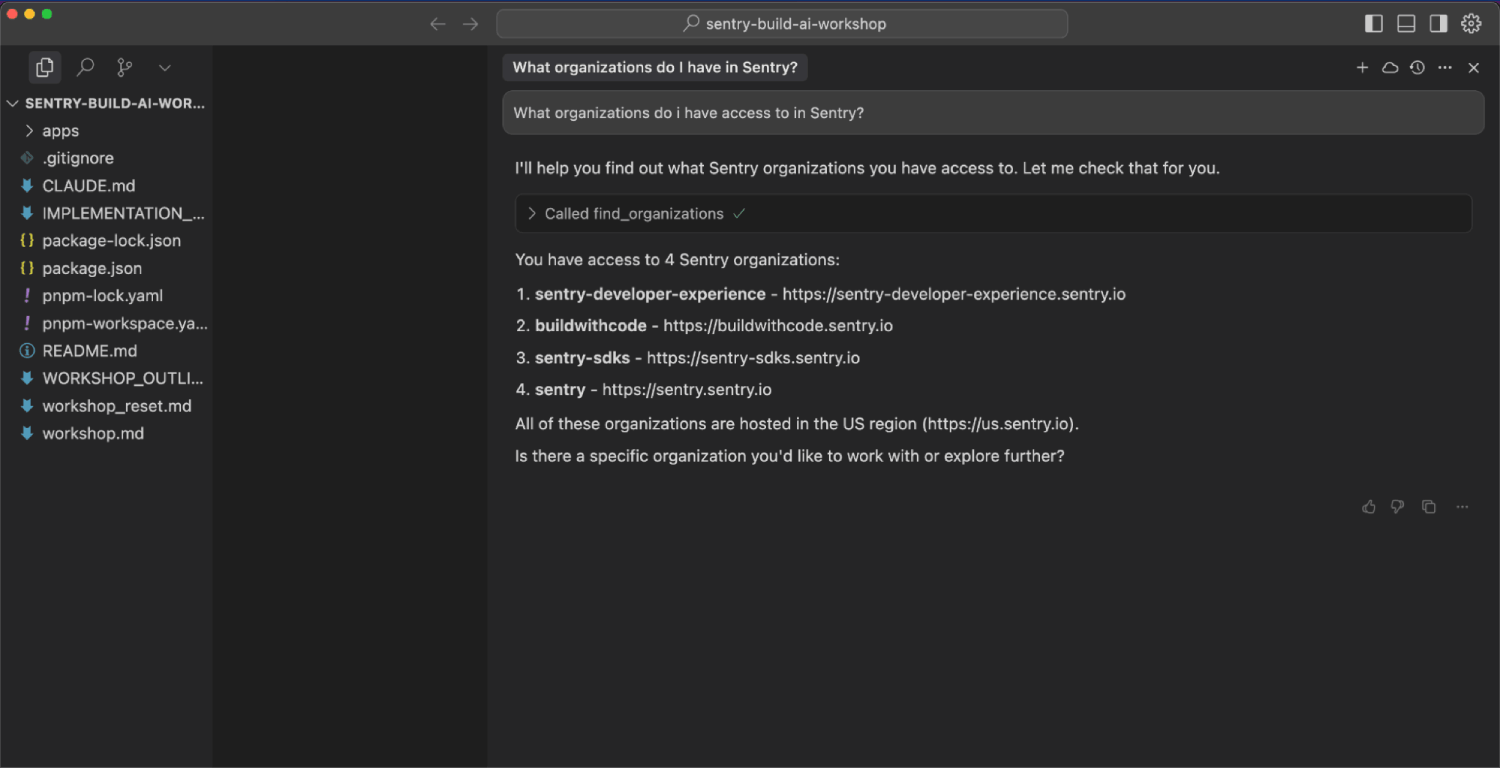
To verify everything’s working, open a new chat and try:
What organizations do I have access to in Sentry?You should see Cursor call the find_organizations tool and return your Sentry organizations. If you get authentication errors, double-check that you’ve got the right permissions on your Sentry account and that OAuth completed successfully.
Cursor Connected
If you’re working across multiple projects or organizations, Cursor handles discovery automatically. It will find the right project without you needing to specify project IDs or remember organization slugs.
A common gotcha: If you have multiple Sentry accounts or use different browsers for different accounts, make sure you’re authenticating with the right one. The OAuth flow uses your default browser, so if you’re usually signed into Sentry with a work account but your browser defaults to personal, you might authenticate with the wrong organization.
Working with Sentry production data in Cursor
Now you can talk to your production data directly through Cursor. Start simple:
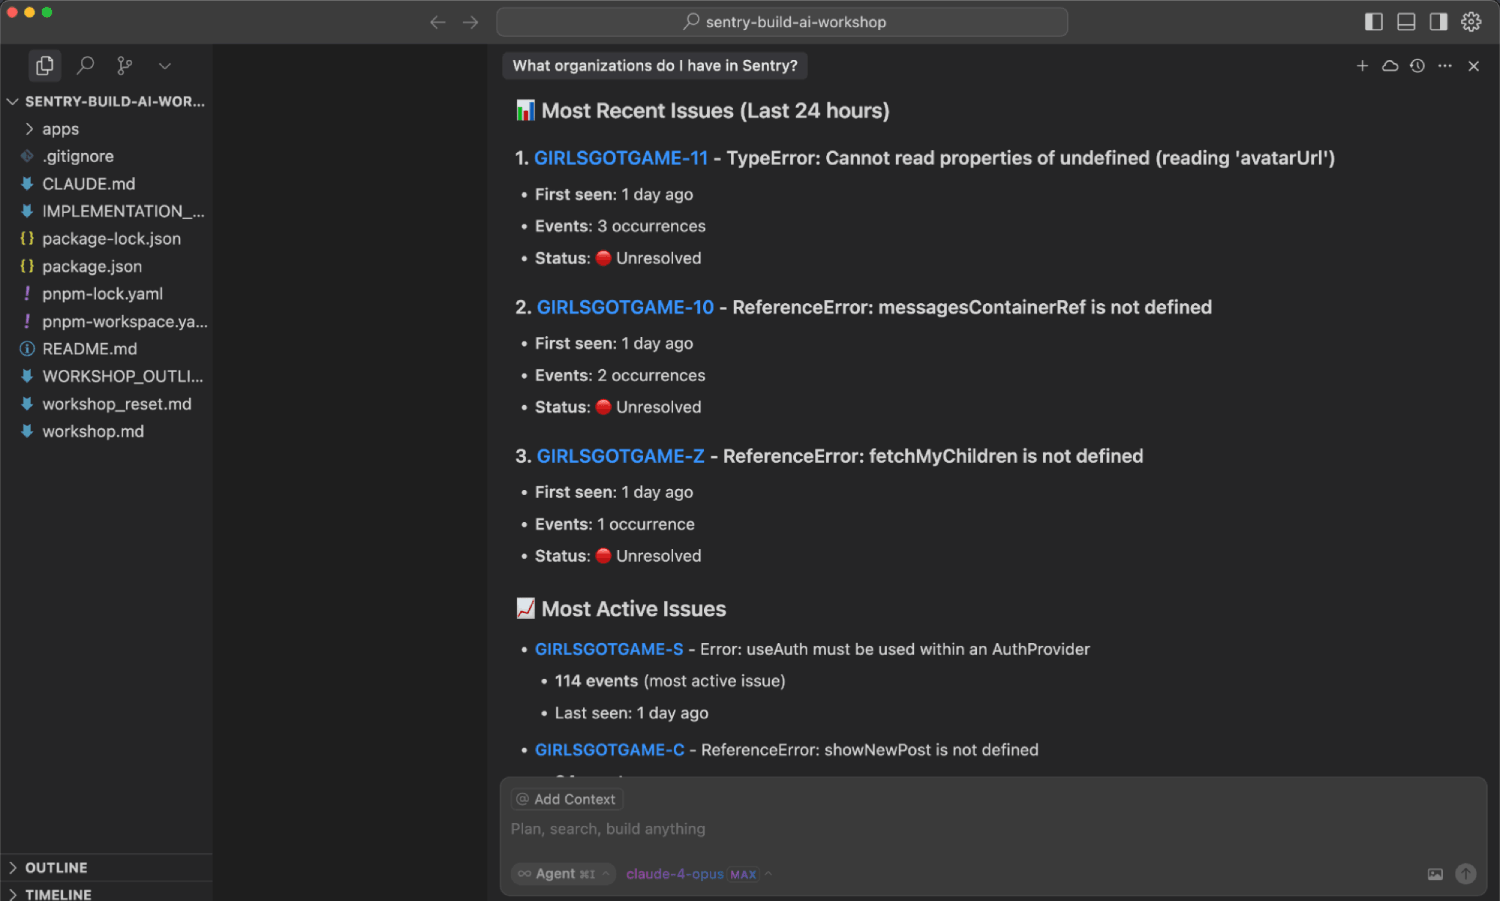
What are the latest issues in my girlsgotgame project?
Show me the most recent errors.
Recent Issues with Sentry MCP in Cursor
Cursor calls three MCP tools behind the scenes: find_organizations to discover your account, find_projects to find the right project, and search_issues to get the actual error data. Current issues appear in your chat, complete with descriptions, culprits, timestamps, and direct links to Sentry.
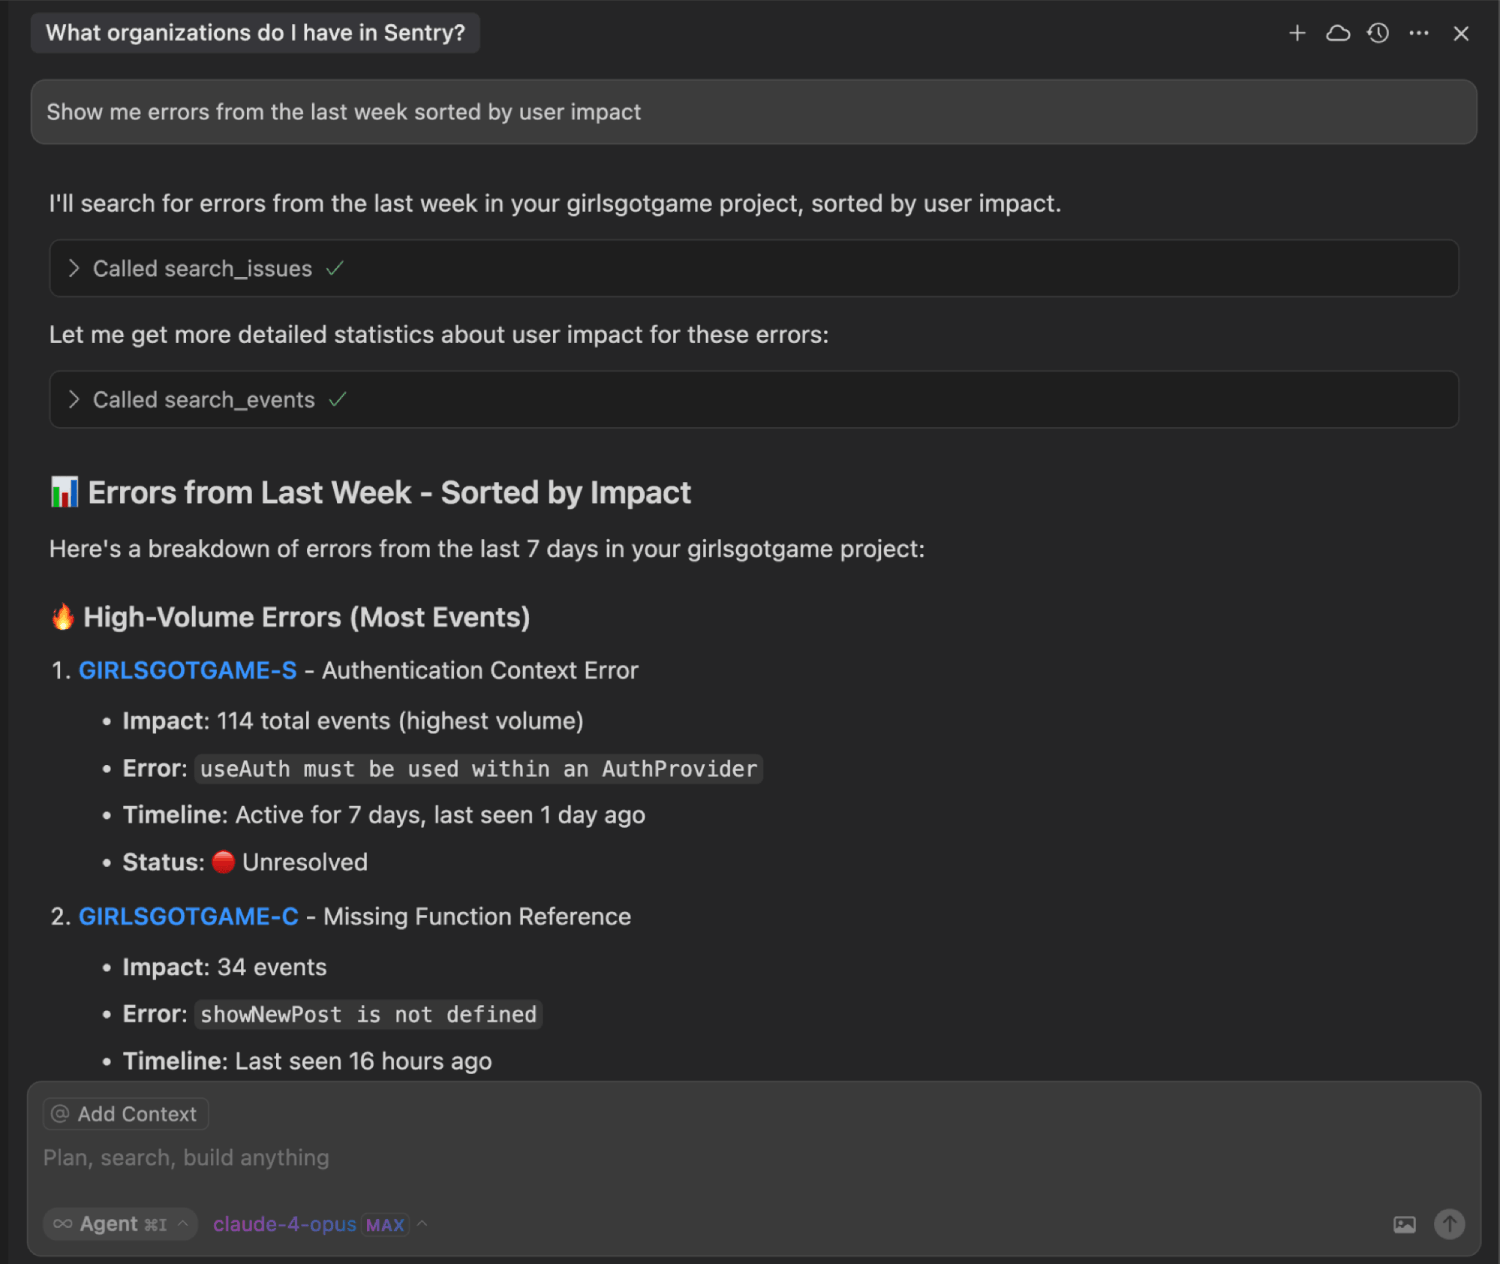
The natural language interface in search_issues means you don’t need to remember Sentry’s query syntax. You can ask for specific timeframes, sort by user impact, or filter by error types, for example:
Find all unresolved issues affecting more than 10 usersOr:
Show me errors from the last week sorted by user impactIssues sorted by user impact
Each issue is returned with stack traces pointing to exact files and line numbers, user impact metrics, error frequency, and the complete context you’d see in Sentry’s interface. The difference is, the data is right there in your development environment where you’re already working on fixes.
Advanced Sentry MCP queries
Once you’re comfortable with basic queries, you can get more sophisticated. Sentry’s query syntax supports complex filtering, but the MCP interface lets you use natural language instead of remembering the exact operators.
Time-based filtering works intuitively:
Show me all unresolved errors from the last weekUser impact analysis helps with prioritization:
Which errors are affecting the most users?You can combine multiple criteria:
Find performance issues that started after yesterday's
deployment and are affecting more than 5 users
The MCP tools translate these natural language queries into proper Sentry API calls with the right filtering, sorting, and pagination.
Sentry MCP error handling in practice
As you use the Sentry MCP tools, you’ll notice that Cursor doesn’t always convert natural language queries perfectly. Sentry’s API may return errors, authentication can time out, or your query might be too ambiguous.
Common issues you’ll encounter and how to fix them:
Ambiguous project references when working across multiple projects. Be more specific about project names.
Authentication timeouts when OAuth expires. Re-authenticate through Cursor’s MCP settings.
Query scope problems when requests are too broad or narrow. Add timeframes or adjust scope accordingly.
Tool selection confusion when Cursor picks the wrong MCP tool. Be more explicit about the response format you want.
The MCP tools remember context across conversations, so establish your project scope early to make subsequent queries more accurate.
Debugging real issues with Sentry MCP context
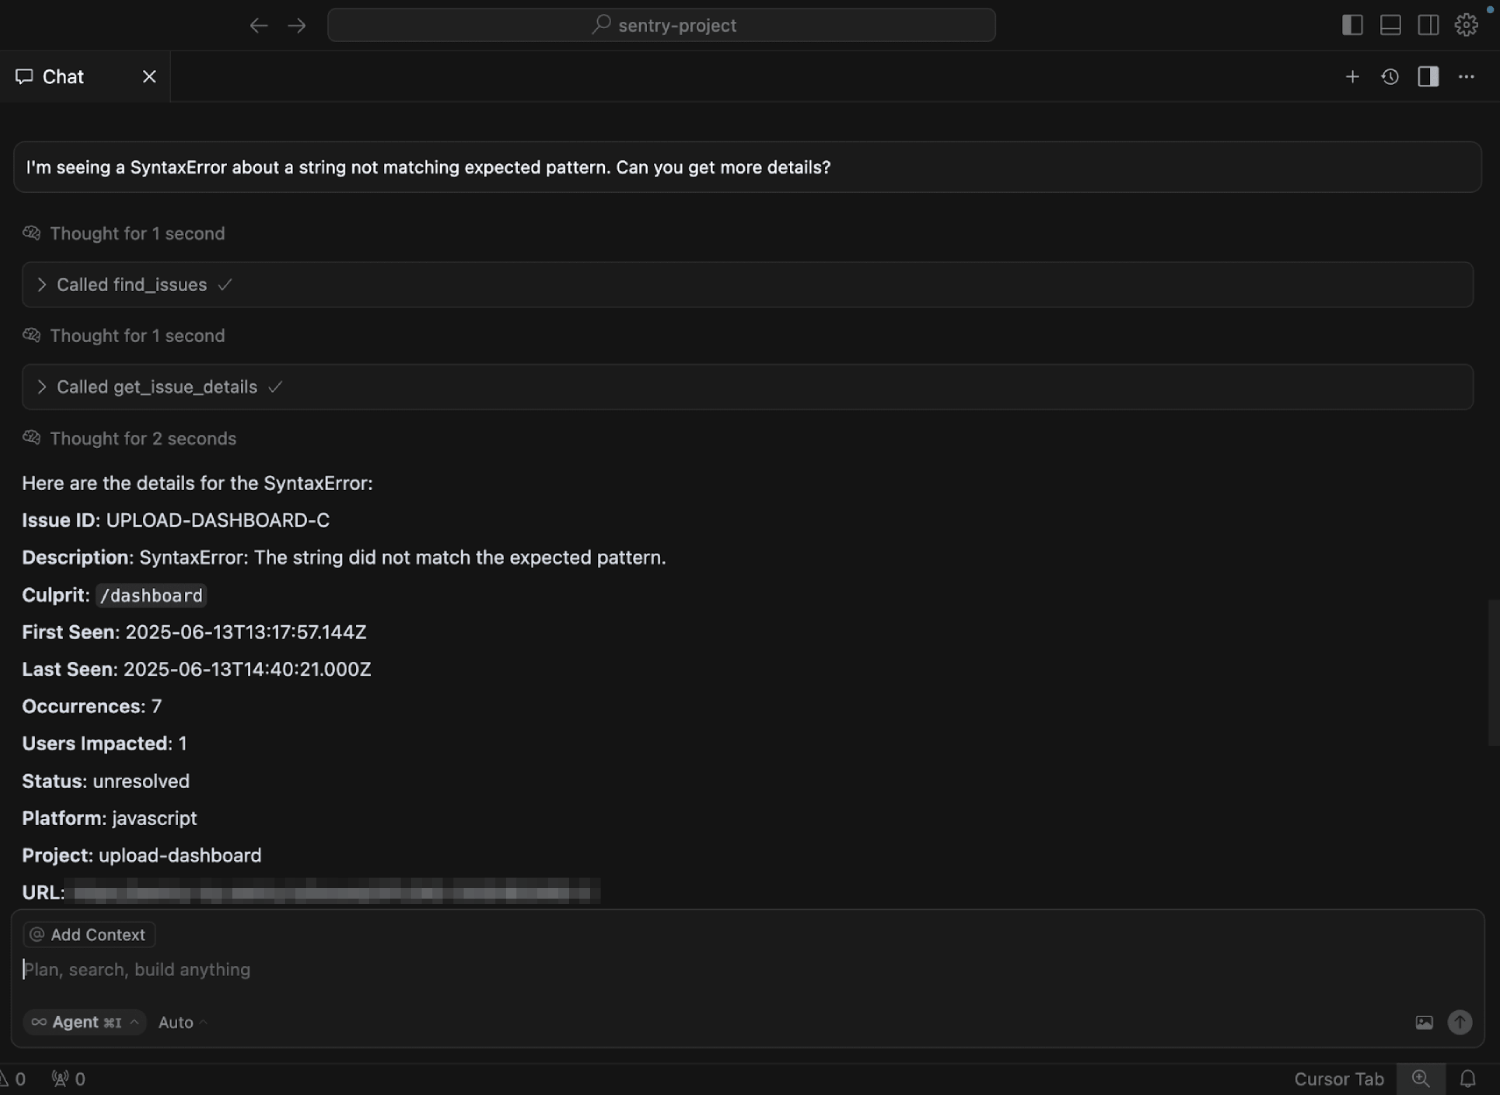
Let’s debug a real issue. A SyntaxError shows up in production:
I'm seeing a SyntaxError about a string not matching expected pattern.
Can you get more details?
Syntax Error Logs
Sentry MCP’s get_issue_details tool pinpoints the exact location, ./app/dashboard/weather-widget.tsx:60:41, and shows the full stack trace. Turns out, the weather insights API wasn’t returning JSON, but the code was calling response.json() anyway.
Cursor uses the error context to suggest more robust error handling that checks content types, handles non-200 responses, and provides meaningful error messages:
// Before: Brittle JSON parsing
const insights = await response.json();// After: Robust error handling
let insights;
try {
const contentType = response.headers.get("content-type");
if (!response.ok) {
throw new Error(`Weather insights API error: ${response.status} ${response.statusText}`);
}
if (!contentType || !contentType.includes("application/json")) {
const text = await response.text();
throw new Error(`Weather insights API did not return JSON. Response: ${text.slice(0, 100)}`);
}
insights = await response.json();
} catch (err) {
throw new Error(
err instanceof Error
? `Could not process weather insights: ${err.message}`
: "Could not process weather insights due to an unknown error."
);
}This new error handling lets the request fail gracefully and provide more details in the error message.
Targeted debugging like this SyntaxError is where Sentry MCP and Cursor work best together. Single-file issues with clear stack traces can be tackled quickly. The production context arrives directly in your IDE, Cursor understands the error pattern, and you can address the problem without leaving your editor.
The missing context
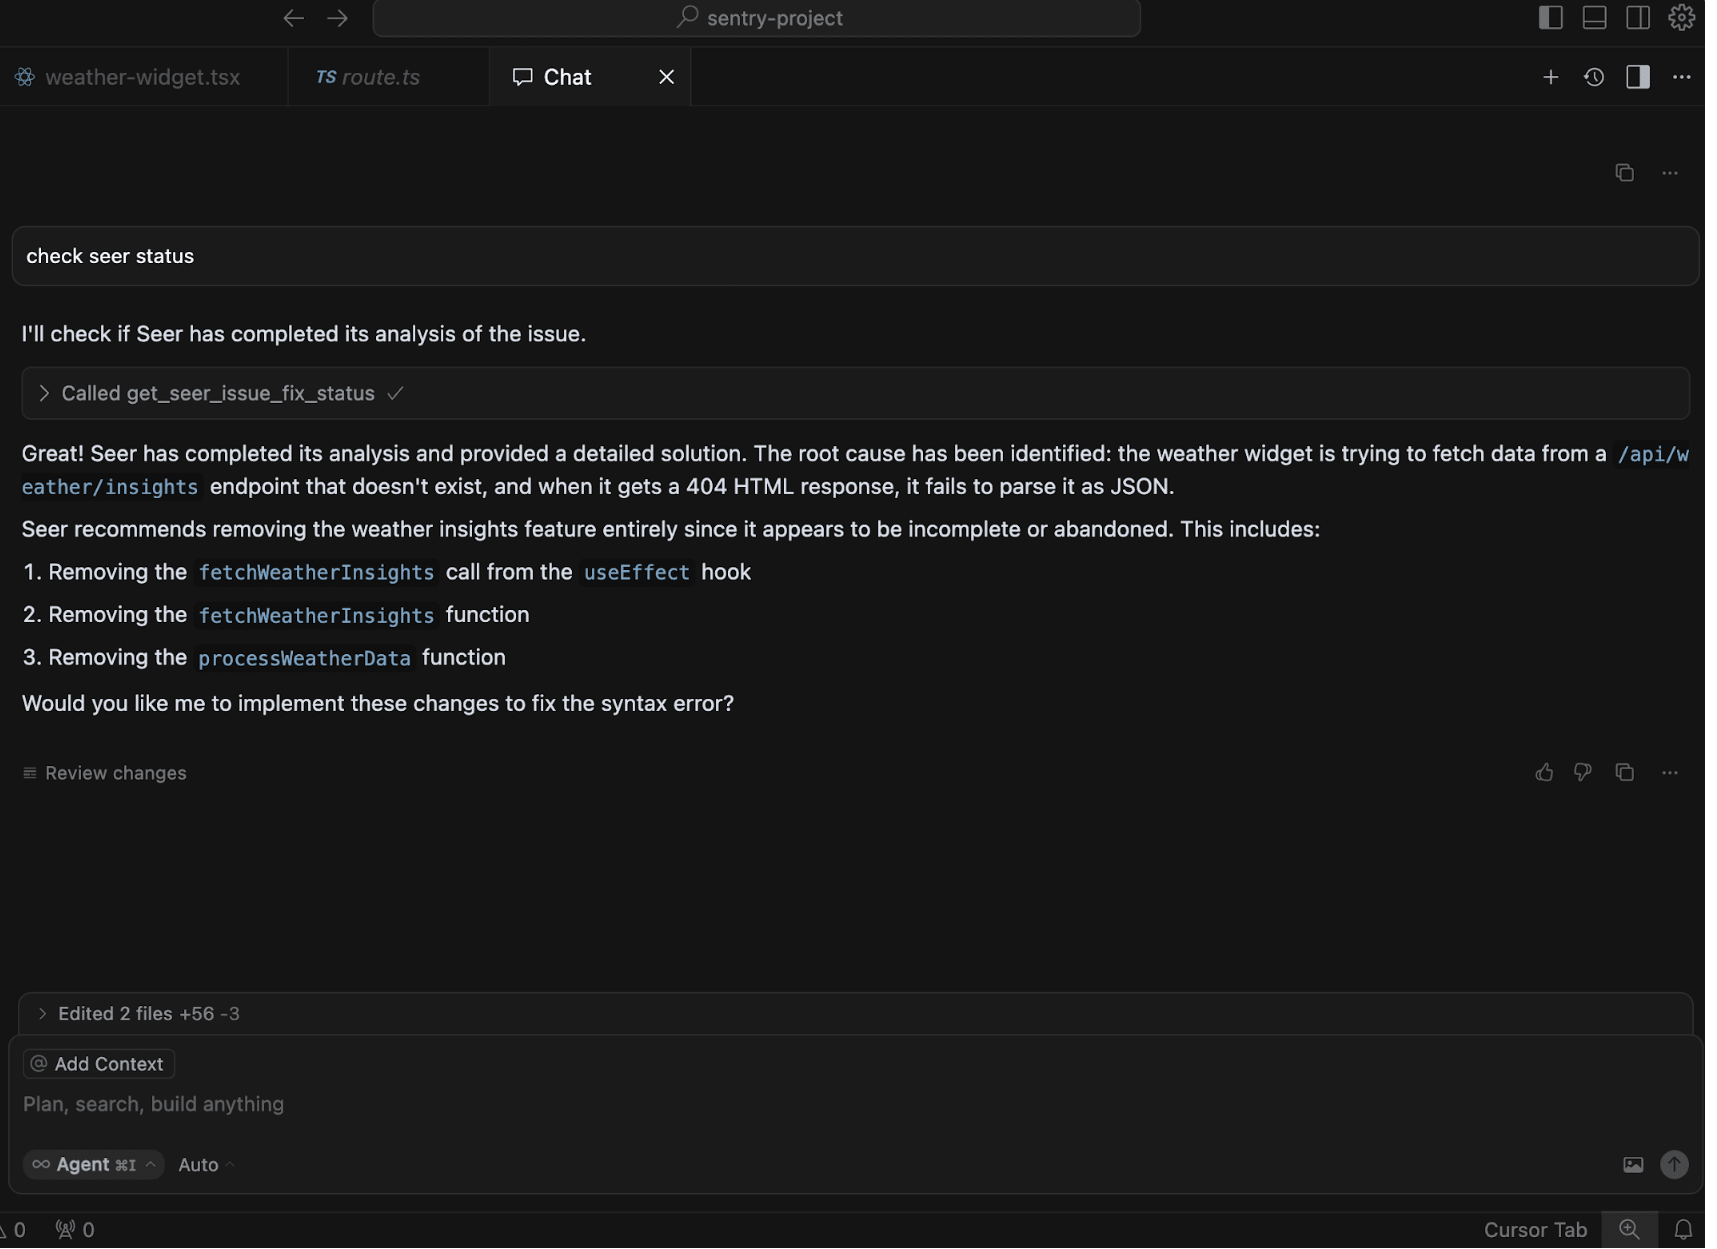
Cursor did a great job of implementing error handling, but its solution wouldn’t be called a fix. We set up this test to evaluate Cursor with an intentionally created error. The real problem is that the API route being called doesn’t actually exist.
While Cursor handled the in-file issue well, it failed to recognize the relationship between the error and the project structure. Seer, however, detected the real error:
Seer Root Cause UI Successful
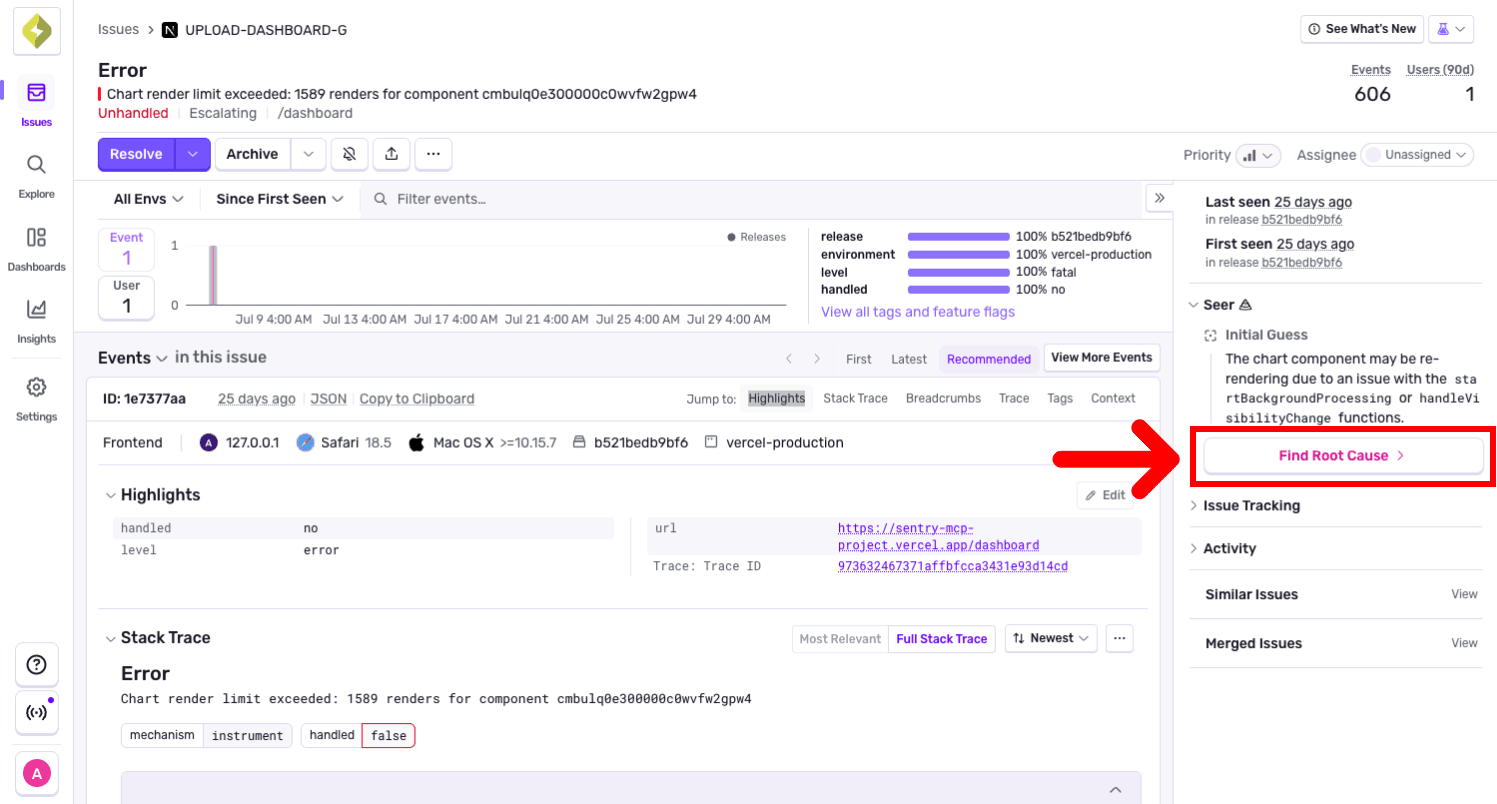
We’ll dive a little deeper into Cursor’s limits and Seer’s capabilities next. But first, you might like to try Seer’s 14-day free trial for your own testing. Get access by clicking the Find Root Cause button in your issue details page:
Seer Trigger in the Sentry UI
Cursor’s limits
The next step is testing how Cursor handles a more complex issue. Let’s say memory leaks are triggering a cascade of related errors across different components.
Try the same debugging approach:
The 'Background processing overflow' error seems severe and
is affecting a lot of users. Can you help me understand
what's causing this and how to fix it?
Cursor uses Sentry MCP to locate the error in activity-chart.tsx, then suggests a fix adding limits and cleanup logic:
// MCP + Cursor approach: Add limits to prevent overflow
const MAX_BACKGROUND_LOOPS = 50;
let backgroundLoops = 0;

// Add cleanup on unmount
useEffect(() => {
  return () => {
    backgroundLoops = 0;
    if (backgroundTimeout) {
      clearTimeout(backgroundTimeout);
    }
  };
}, []);
However, ask about the other similar errors, and Cursor stays trapped in single-file thinking. It looks at one file, applies a targeted fix, moves to the next similar error, and repeats. What Cursor can’t do is step back and ask, “Why are there memory leaks and overflow errors across completely different components? Is there a systematic issue here?”
The memory leaks throughout the application were caused by missing useEffect cleanup functions across multiple React components. Each component needed the same fundamental pattern:
useEffect(() => {
  // Component logic...

  // THE MISSING PIECE: Cleanup function
  return () => {
    window.removeEventListener('resize', handleResize);
    clearInterval(dataUpdateInterval);
    observer.disconnect();
    // Clear global references
  };
}, [dependencies]);
While similar overflow errors appear in different parts of the application, Cursor treats each as a separate issue and its suggestions all involve adding more limits rather than fixing the root cause.
To be fair to Cursor, it’s really helpful at what it’s designed for: targeted investigation and localized fixes. But systematic issues require deeper analysis.
Escalating to Seer for root cause analysis
Here’s how Seer approaches the same issue, still working within the IDE:
Use Sentry's Seer and help me analyze and propose a solution
for the background processing overflow error
Asking for Seer’s help triggers the begin_seer_issue_fix tool and we’re told that we can check in on the status of the fix in a few minutes.
We check in on that fix:
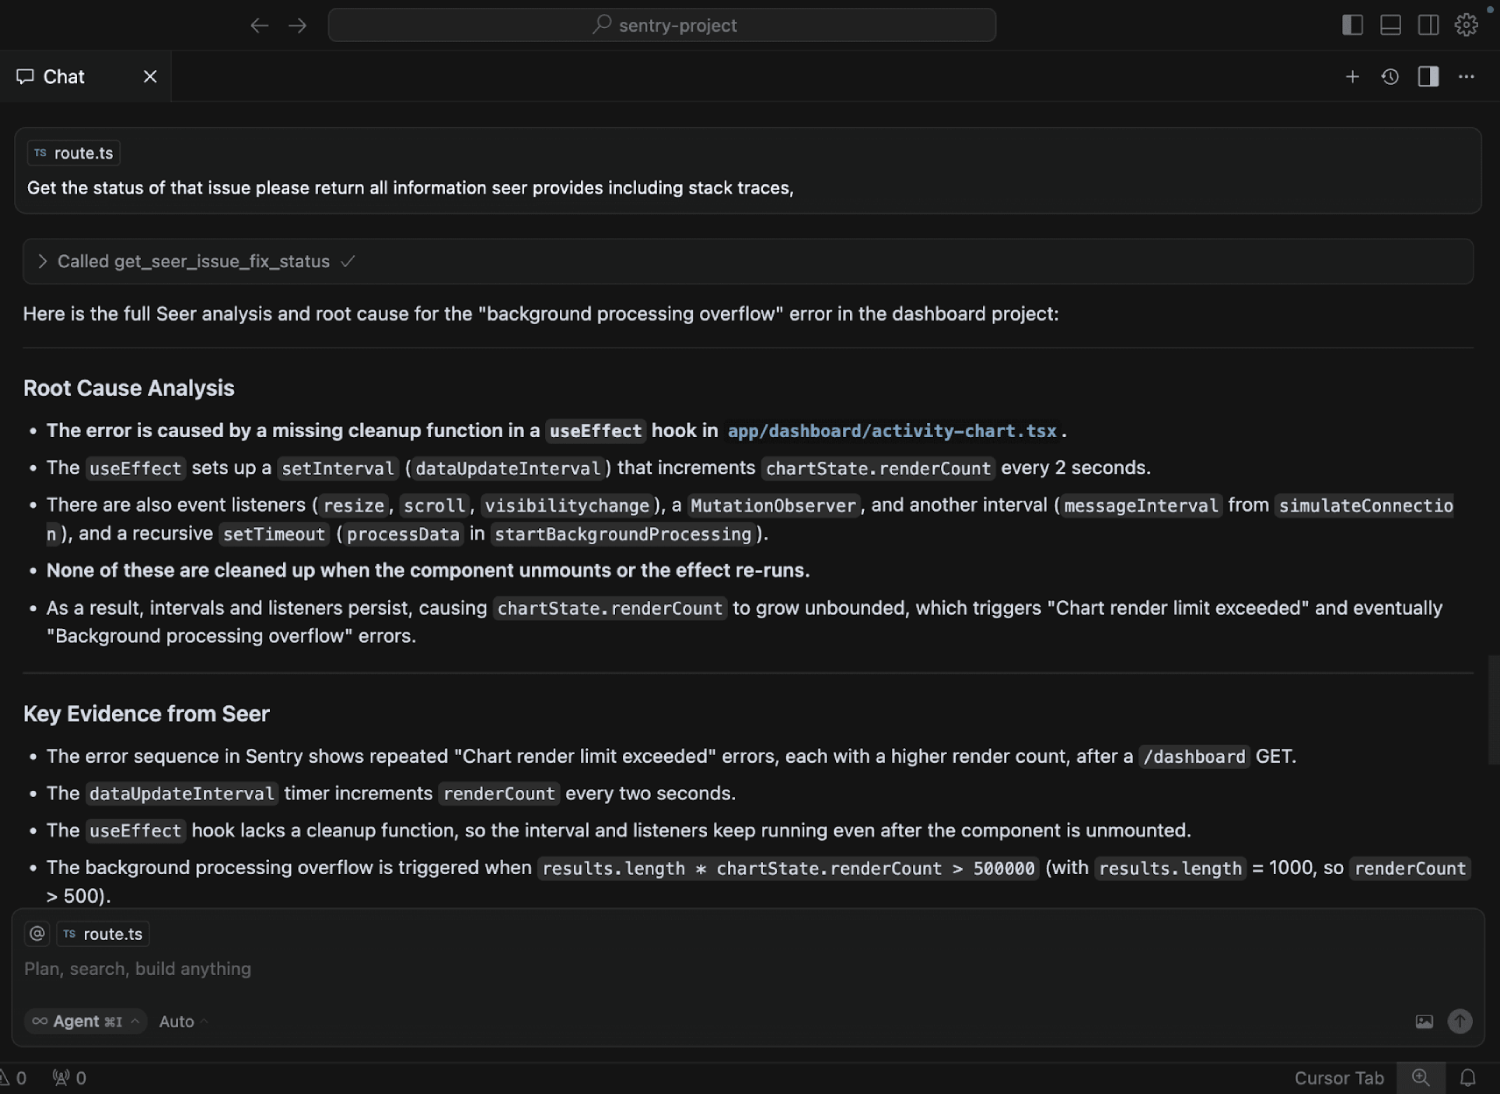
Get the status of that fix, return all the information Seer provides.Seer Fix Status in Cursor
The begin_seer_issue_fix tool kicks off a completely different analysis process.
Seer analyzes patterns across your issue history, examines how errors correlate with deployments, understands relationships between different parts of your system, and identifies root causes that span multiple files and repositories.
Here, Seer found that multiple resources needed proper cleanup: timers, event listeners, observers, and background processes.
return () => {
  clearInterval(dataUpdateInterval);
  if (messageIntervalId) clearInterval(messageIntervalId);
  if (processDataTimeoutId) clearTimeout(processDataTimeoutId);
  window.removeEventListener('resize', handleResize);
  window.removeEventListener('scroll', handleScroll);
  document.removeEventListener('visibilitychange', handleVisibilityChange);
  observer.disconnect();
};
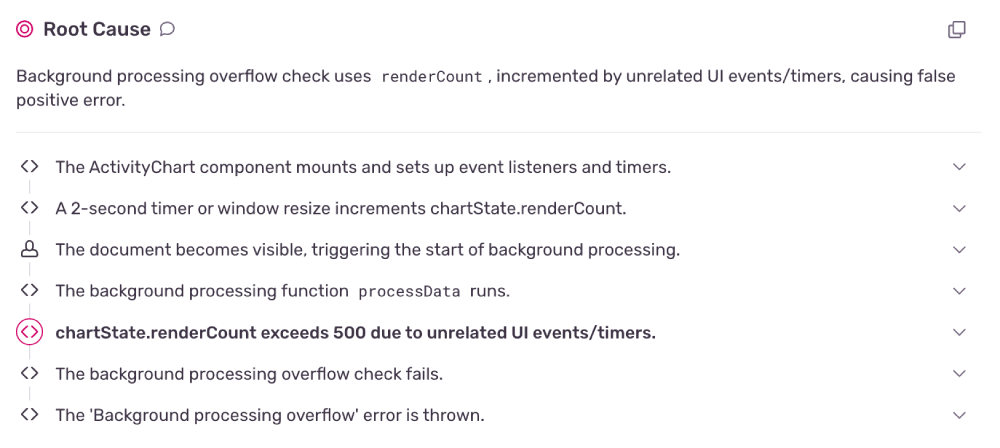
The difference in approach between Cursor and Seer is striking. In our examples, Cursor simply covered up errors with artificial constraints, while Seer noticed poor resource management in the code and suggested a solution to prevent the issue entirely.
Seer’s strength lies in analyzing beyond just this component. Using error sequence data from Sentry, the tool can understand how errors correlate over time, identify when some errors precede others, and reveal cause-and-effect relationships across issues.
Sentry Seer Root Cause UI
The key insight? Knowing when to escalate from targeted fixes to systematic analysis. When similar fixes are being applied across multiple components, error patterns are repeating, or a deeper architectural issue is likely, that’s your cue for Seer’s more comprehensive analysis.
The right tool for the job
Here’s how to think about these three layers of tooling:
Cursor
Cursor alone is great for writing new code and fixing syntax errors when you know exactly what needs to change. It’s fast and direct for straightforward development tasks.
Cursor + Sentry MCP
Cursor with Sentry MCP excels when you’re investigating specific production issues. You get precise error locations, stack traces, and user impact data. It’s perfect for targeted debugging when you can point it at specific problems.
Seer
Cursor with Sentry MCP and Seer handles comprehensive root cause analysis across your entire system. When you suspect patterns, architectural issues, or problems that span multiple files, you can bring in this deeper analysis.
Take control of your context
The difference between generic AI assistance and powerful debugging workflows comes down to context. Cursor alone can help you write code and fix syntax errors. Cursor with context from Sentry MCP can investigate real production issues, understand user impact, and trace errors to specific lines of code. Add Seer to the mix, and you get comprehensive root cause analysis across your entire system architecture.
Each layer of context changes what’s possible. Production error data turns vague bug reports into precise stack traces. Issue correlation reveals patterns that would take hours to identify manually. Cross-repository analysis uncovers systematic problems that individual file investigation misses entirely.
Context is what turns generic AI assistance into actually useful debugging workflows. Give your tools access to your actual production environment and watch how much more helpful they become.

