Session Replay: Becoming your own digital secret shopper
Session Replay: Becoming your own digital secret shopper
Retail stores have long relied on a secret weapon to measure and improve the shopping experience: the secret shopper.
Posing as ordinary customers, they evaluate the customer experience, spotting friction points like hard-to-find items, gauging the quality of customer service, and testing how seamless the checkout process feels. The data they capture acts as a proxy for unbiased, actionable feedback that shopkeepers use to enhance their customer’s experience, boost conversion rates, and increase average order value.
But in e-commerce, you're not limited to small sample sizes or proxy customers. With tools like Session Replay, you can analyze the journeys of real shoppers at scale — and even "replay" their sessions back to see exactly what they saw, click by click.
Enable Session Replay for real customer insights
Session Replay records a video-like reproduction of your user's experience, with all associated logs, errors, traces, and more attached. You'll be able to see what your users experience, while reviewing what was logged to the console at that time, and much more.
This is an excellent way to diagnose user issues without relying on them to file a report. Instead of asking for detailed descriptions, screenshots, or videos, you can simply see what happened. But it's more than just an error debugging tool, it can help you reveal customer behavior patterns — where users hesitate, where flows break down, and how design choices affect the journey.
To get started, you’ll want to select the correct SDK matching the front-end framework of your online store, and add Sentry with Replays enabled. If you are writing a Shopify app with Hydrogen, you can use the React Router SDK. Here’s a simple React setup that can be easily modified to fit your app.
// import Sentry from your framework SDK (e.g. @sentry/react-router)
import * as Sentry from "@sentry/react";
Sentry.init({
  dsn: process.env.SENTRY_DSN
  // This sets the sample rate to be 10%. You may want this to be 100% while
  // in development and sample at a lower rate in production
  replaysSessionSampleRate: 0.1,
  // If the entire session is not sampled, use the below sample rate to sample
  // sessions when an error occurs.
  replaysOnErrorSampleRate: 1.0,
  integrations: [
    Sentry.replayIntegration({
      // Additional SDK configuration goes in here, for example:
      maskAllText: true,
      blockAllMedia: true,
    }),
  ],
});
You can set different capture rates for capturing Session Replays based on when there is an error, when you may want to capture a higher percentage of replays, and for general sessions. While experimenting, it’s a good idea to set these to 1.0 to make it easier to setup and debug, but you’ll want to lower these back down for production to put less strain on your monthly cap.
With Sentry configured, you can now start collecting telemetry data. Some framework SDKs (like Next.js) will automatically instrument error tracking and spans in much of your app. But you can always add more manual spans or metadata to any part of your app.
Diagnosing checkout drop-off and cart abandonment
Most e-commerce platforms track cart abandonment, showing you how many shoppers add items to their cart but never complete checkout. Knowing your checkout conversion rate is useful; knowing why customers abandon their carts is the knowledge you need to start closing the cart-checkout conversion gap.
You should always aim to maximize observability around the critical experiences in your applications. For online stores and shops, the checkout experience is the most critical point in your application. You can't make sales if users can't checkout.
Whether you're using Shopify, WooCommerce (via WordPress), or building your own custom checkout flow, you can implement comprehensive observability.
Adding observability to the checkout
The Sentry.startSpan method takes a callback function where you place any code you want to collect metrics around. Any code you execute here that has a Sentry span of its own will become a child-span of this parent, creating an easy-to-read flow of events to navigate in the Sentry Trace Explorer.
When you start collecting spans, you'll get a lot of metrics automatically, such as how long an operation takes, the user's web browser, and more. You can also attach your own custom attributes, like the total cart value. You may want to run a query in the future to show carts with a higher than average value.
Let's assume you're building a generic React app for this example. Your "cart" page is built as a .tsx component, with Sentry initialized via the useEffect hook to prevent re-triggering. You'll first immediately call setUser and provide an object containing the user's ID. If you're working on a Shopify app with Hydrogen, you can fetch the logged-in user via the Customer Account API.
 const { cart, customerId } = useLoaderData<typeof loader>(),

 useEffect(() => {
	 // Set user context for all Sentry events
	 Sentry.setUser({ id: customerId });

   Sentry.startSpan({
      name: 'cart_view',
      op: 'commerce.cart.view',
      attributes: {
        // Use the actual data from the loader
        cart_items: cart.items.length,
        cart_value: cart.total.usd
      },
    }, () => {
      console.info(`🛒 Cart page viewed by user: ${customerId}`);
    });
  }, []);
Now, you'll be able to view the traces on Sentry for any given user that visits the cart page. You can add a few more spans around other critical parts of your cart page and the components within to get a more full picture.
const handleCheckout = () => {
  Sentry.startSpan({
    name: "checkout",
    op: "commerce.checkout",
    attributes: {
	    cart_items: cart.items.length,
      cart_value: cart.total.usd,
      cart_shipping_cost: cart.calculateShipping()
    },
  }, async () => {
    try {
      console.log('🛍️ Checkout process initiated...');

      // This child span measures the payment processing step.
      await Sentry.startSpan({
        name: "Payment Processing",
        op: "commerce.payment.process",
      }, async () => {
        console.log('💳 Processing payment...');
      });

      // This child span measures the order creation step.
      await Sentry.startSpan({
        name: "Order Creation",
        op: "commerce.order.create",
      }, async () => {
        console.log('📋 Creating order in the database...');
      });

      console.log('🎉 Checkout completed successfully!');

    } catch (error) {
      console.error('❌ Checkout failed:', error);
      Sentry.captureException(error);
    }
  });
};
Track abandoned carts
As I said, most platforms have some kind of built-in system for identifying and tracking "abandoned" carts. The definition of what an abandoned cart actually is will vary from platform to platform. If you're building your own app using platform APIs, you can define and track abandoned carts on any criteria you choose.
Shopify has an abandoned checkout tracker, but it's tied to their external checkout page where you lose visibility, and the information becomes less useful. Even so, Shopify only counts a cart as abandoned if the user reaches checkout and enters their email before leaving. You may have a different idea of that that means for our bespoke app.
If you have your own app with your own cart checkout page, you'll want to see how customers are interacting with it. So for your custom app, you'll need a custom solution.
You can store cart information server-side, using the session ID for the temporary customerId, so it's possible to record and analyze user behavior patterns even before they complete checkout. This is also necessary if you plan to define an abandoned cart as a cart that hasn't checked out over a longer period of time than a single session.
However you define and build your app to track abandoned carts, your goal is to be able to retrieve a list of customerIds with abandoned carts, so you can later investigate those users' sessions in Sentry.
Your server-side code might look something like this:
// Server-side cart tracking (Node.js/Express example)
const abandonedCartTracker = {
  // Track when a cart is created or updated
  updateCart: async (sessionId, cartData) => {
    await db.carts.upsert({
      sessionId,
      customerId: cartData.customerId || sessionId, // Use sessionId as fallback
      items: cartData.items,
      totalValue: cartData.total,
      lastUpdated: new Date(),
      status: 'active'
    });
  },

  // Mark carts as abandoned after 30 minutes of inactivity
  // Run this on a cron job (every 15-30 minutes) or trigger it when users visit your site
  markAbandonedCarts: async () => {
    const thirtyMinutesAgo = new Date(Date.now() - 30 * 60 * 1000);

    return await db.carts.updateMany(
      {
        lastUpdated: { $lt: thirtyMinutesAgo },
        status: 'active'
      },
      { status: 'abandoned' }
    );
  },

  // Get list of abandoned cart customerIds for Sentry investigation
  getAbandonedCartUsers: async (timeframe = '24h') => {
    const timeframeCutoff = new Date(Date.now() - (24 * 60 * 60 * 1000));

    const abandonedCarts = await db.carts.find({
      status: 'abandoned',
      lastUpdated: { $gte: timeframeCutoff },
      totalValue: { $gt: 50 } // Focus on higher-value abandoned carts
    });

    return abandonedCarts.map(cart => ({
      customerId: cart.customerId,
      cartValue: cart.totalValue,
      itemCount: cart.items.length,
      abandonedAt: cart.lastUpdated
    }));
  }
};
With this data, you can then search Sentry for specific user sessions to see exactly what happened during their checkout process.
Querying Sentry for abandoned carts with Session Replays
Now you know which users (temporary or not) currently have "abandoned" carts, however you have defined them, and you know the customer's ID that matches the ID you set with setUser in your Sentry spans.
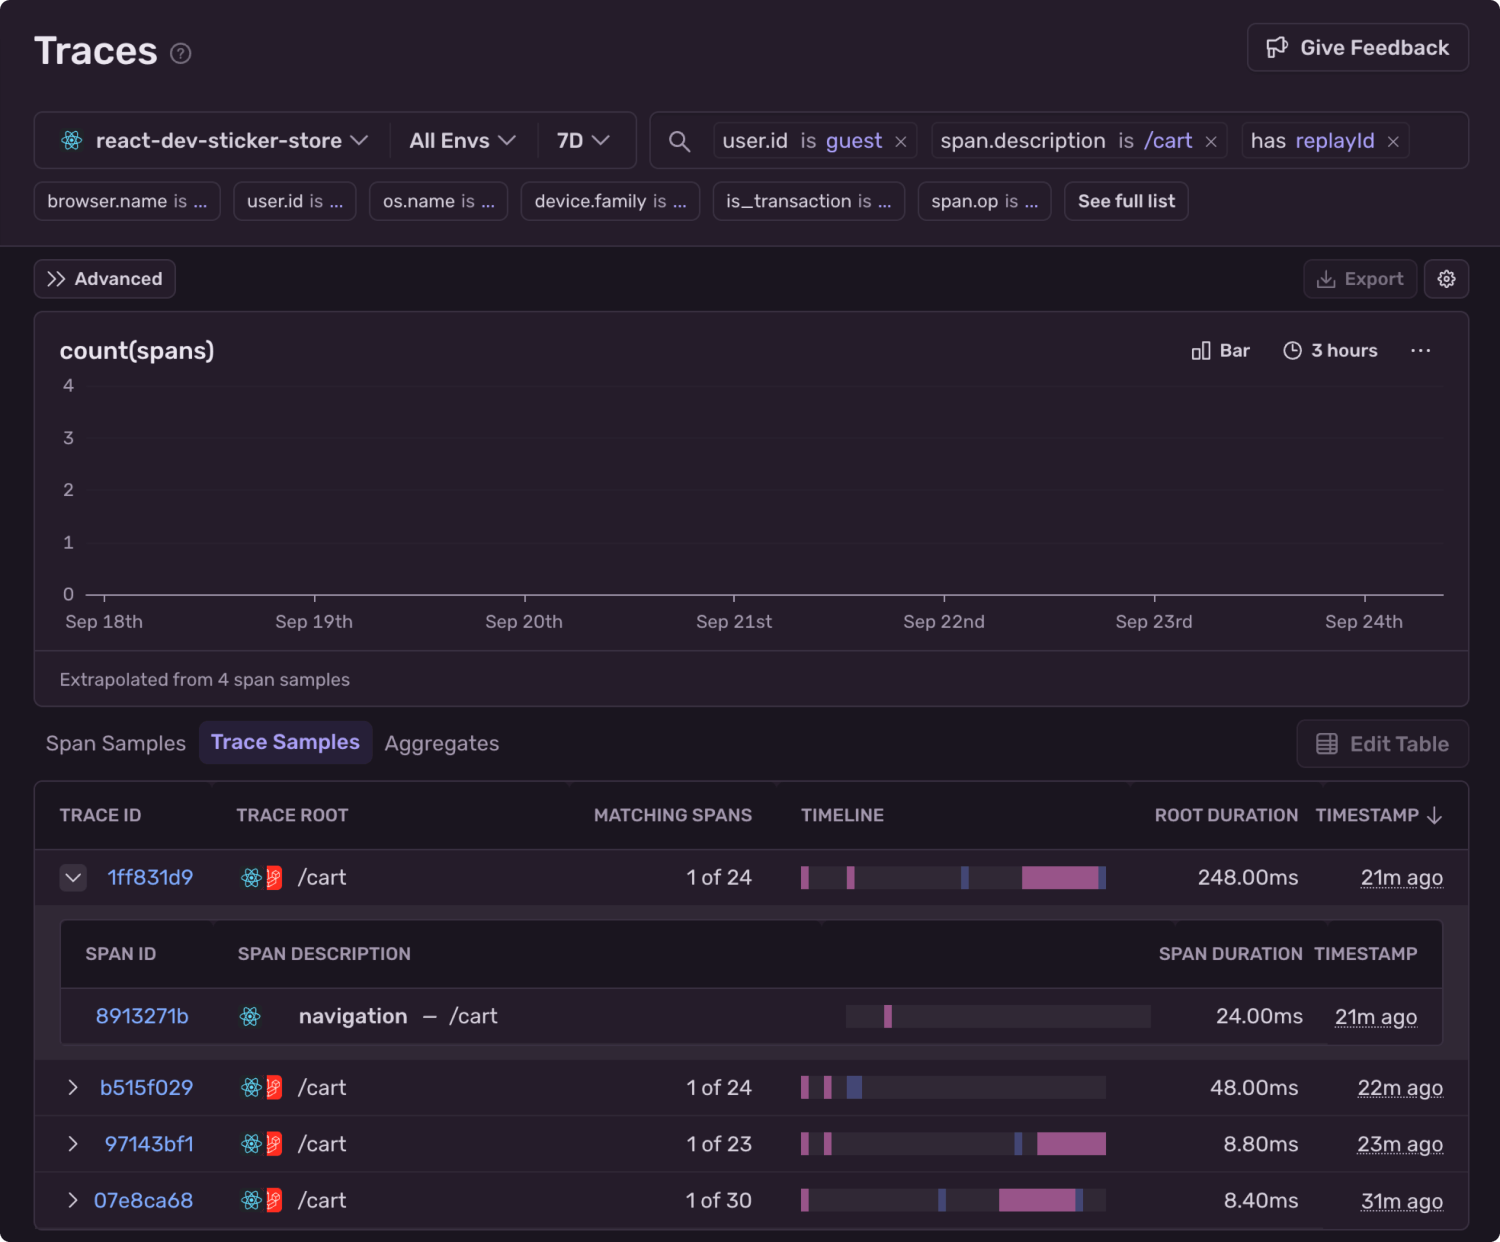
Navigate to the Trace Explorer and query for spans that contain your user's ID, the cart page, and contains a session replay:
user.id:guest span.description:/cart has:replayIdReplace guest with the actual customerId from your abandoned cart list. This query will show you all traces where:
The user ID matches your abandoned cart customer
The span involves the cart page (
/cart)A session replay is attached (
has:replayId)
If you look at the “Traces Samples” tab, you can have your results aggregated by trace. You can see here there were 4 separate events where the user navigated to the /cart page. You can click into any of these traces to see the full set of spans that were captured in that transaction.
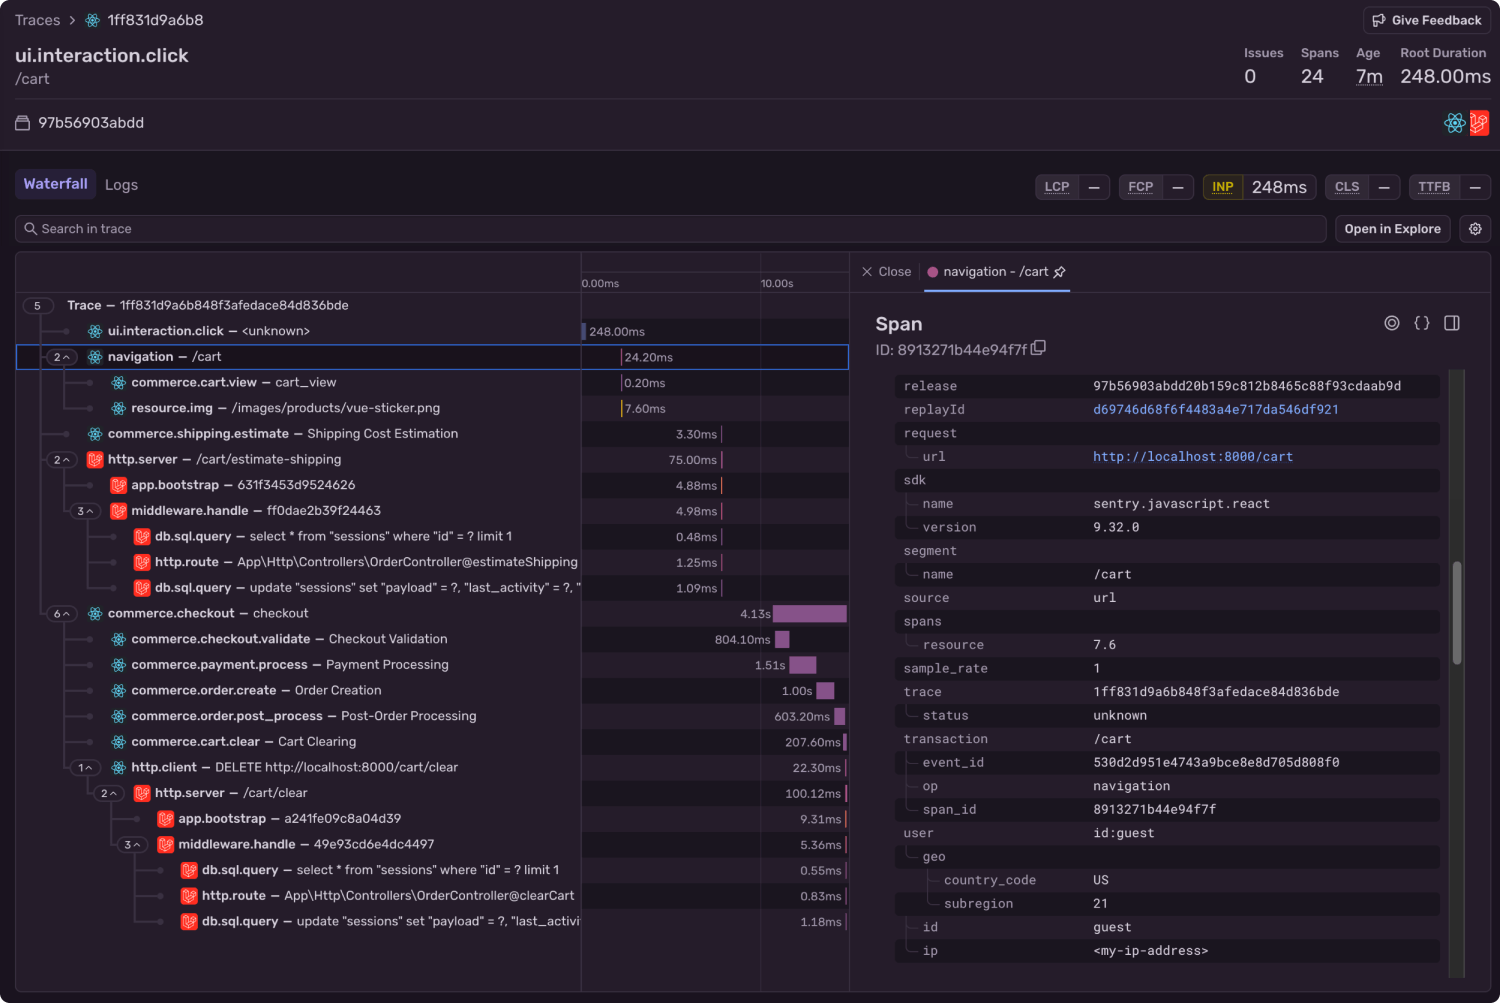
After clicking a trace, you’ll be presented with a waterfall view of spans. Because distributed tracing is enabled here, you can see spans from both the front end and backend of this particular application.
The span that is highlighted by default is the one that matches the query you ran a moment ago, and it contains the custom attributes you attached, like the user’s ID. You’ll be able to see those attributes on the right-side panel.
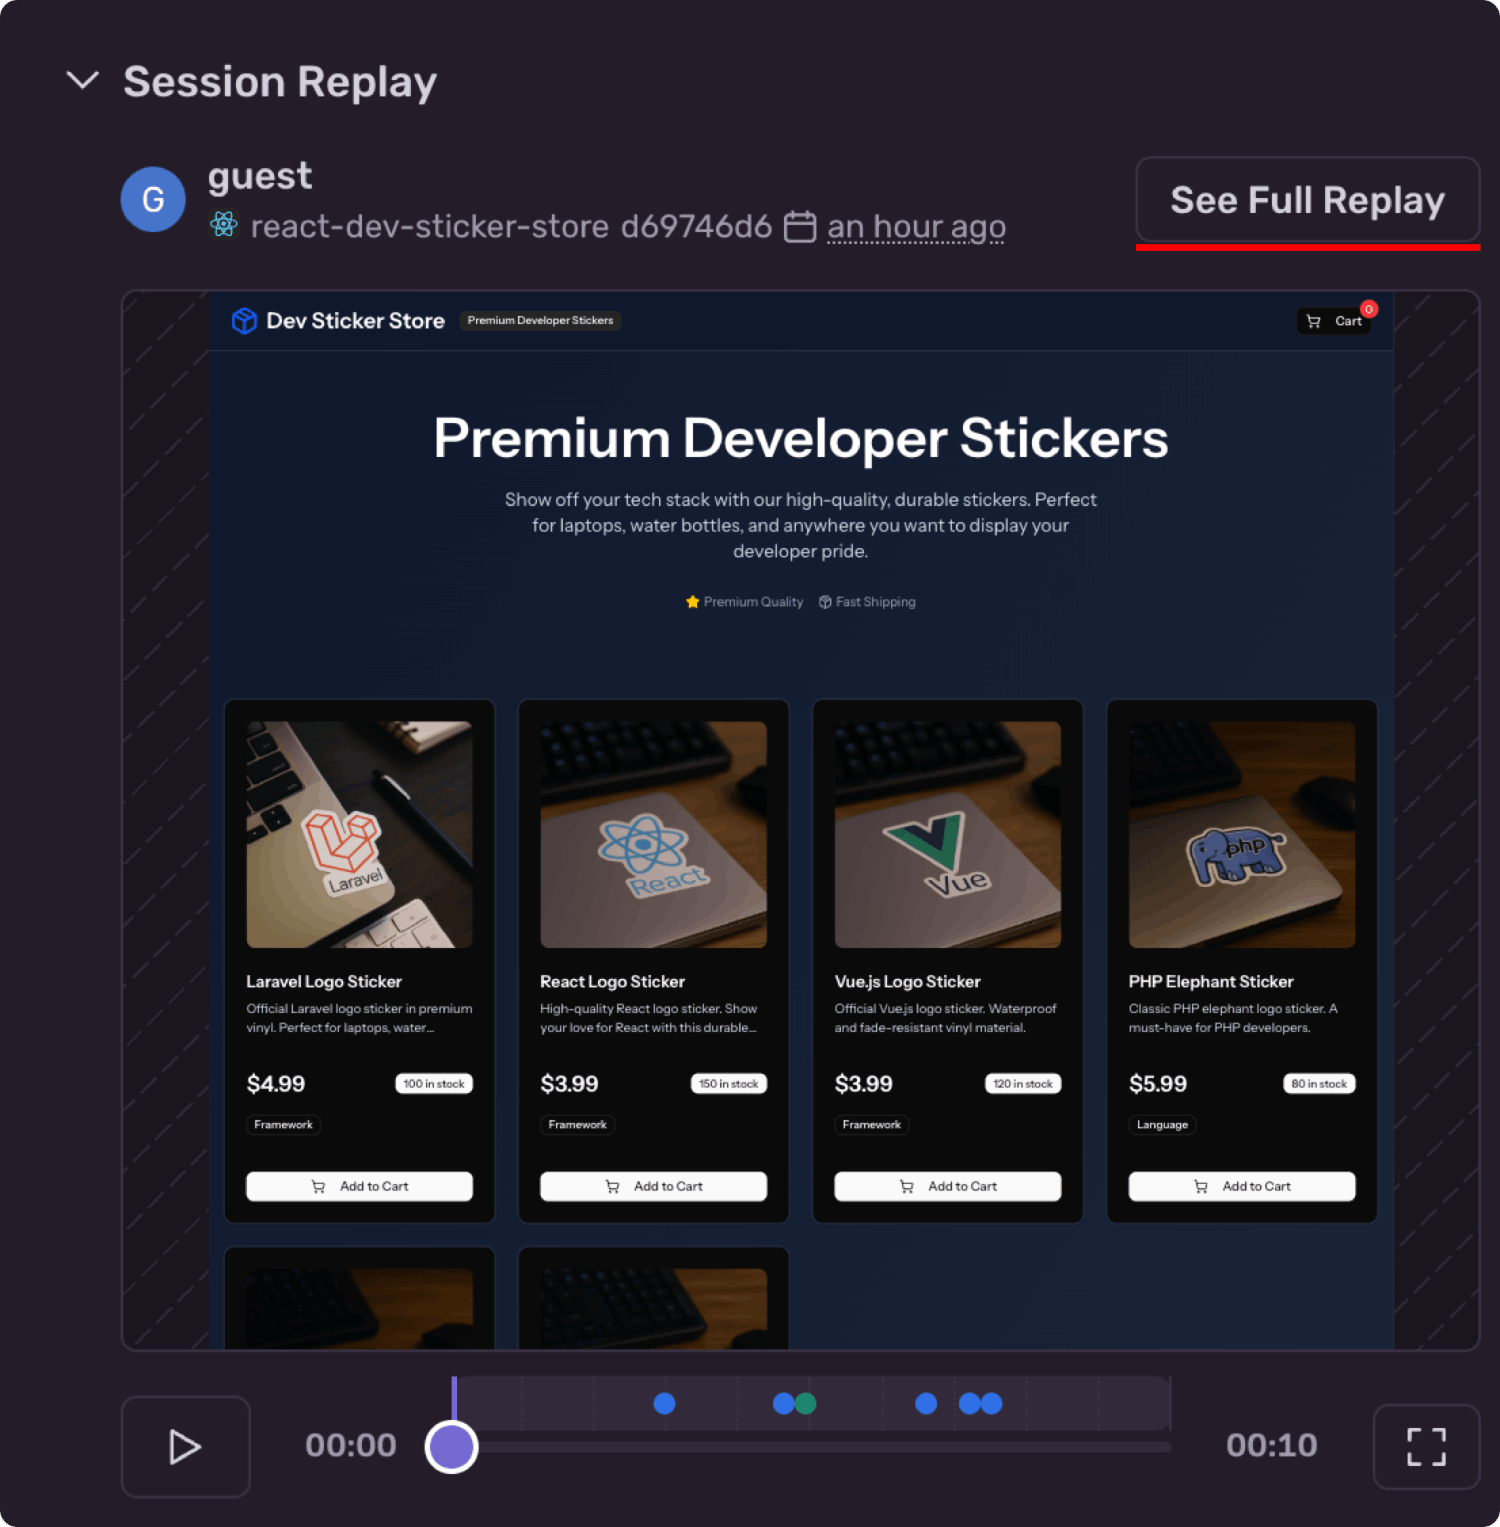
In that panel, if you scroll down past the attributes, you’ll find the attached Session Replay.
Click the “See Full Replay” button, and we’ll take a look at this user’s session, and see if you can learn anything about their experience that may indicate why they abandoned the cart. You should be on the look out for things like slow loading times, layout shifts, and errors.
Reviewing abandoned carts with Session Replay
Now comes the most valuable part: watching the actual user experience that led to cart abandonment. When you click on a Session Replay, you'll see exactly what your customer saw, experienced, and struggled with.
Session replays are not videos, but allow you to replay a user’s DOM in a video-like experience. In the right panel you see there are a few tabs: errors, network, console, and breadcrumbs.
Errors are Sentry’s flagship product, and usually where you start when debugging the user experience. In this case though, the user experienced no errors. At least none that were captured.
At the bottom of the player is the play button, and you can see on the timeline there are small blips. Each of these corresponds to an event on the page, like a click, or an error is returned. The color of the blip will indicate what type of event it is, and you can hover over it to learn more. They will also appear with more detail in the Breadcrumbs tab.
In this case, the user probably didn’t leave because of an error or slow load times. In fact, no metric you could have measured would have flagged the issue.
The replay shows the user navigate to the cart page, and then enter their country and zip code to calculate shipping. The total changes from $4.99 to $13.98 after shipping. A moment later, the cursor darts to the top of the screen and the session ends.
After review, it seems the user likely intended to complete their purchase, but their activity suggests they were not willing to pay the 3.5x price increase.
Next steps for your store
Cart abandonment isn’t just a number in your analytics dashboard, it’s a reflection of the customer experience and a leak where potential revenue slips away.
Human behavior isn’t always quantifiable with metrics. You can make assumptions from telemetry, and you might collect limited feedback through surveys or support tickets. But proxy data for customer’s experiences will never be as revealing as watching what actually happened in the moment.
With Session Replay, you move beyond guesswork. You see the real journey — every click, scroll, and hesitation, paired directly to the spans and events that shaped it.
Session Replay works for any and all web applications, and even iOS and Android apps. Ensure you have full visibility into your customer experience. You can more about how to configure Session Replay and its many available options in the Sentry documentation.
When dashboards and numbers aren’t enough to explain human behavior, a set of eyes might be all you need.


