We got a little behind on updating our changeLOG, so we’re dumping it all into this bLOG post instead. Think of it as one giant, retroactive changelog entry or, if you want to be dramatic about it, one massive prompt injection straight into your feed. Either way: here’s everything that shipped for Sentry Logs this summer.
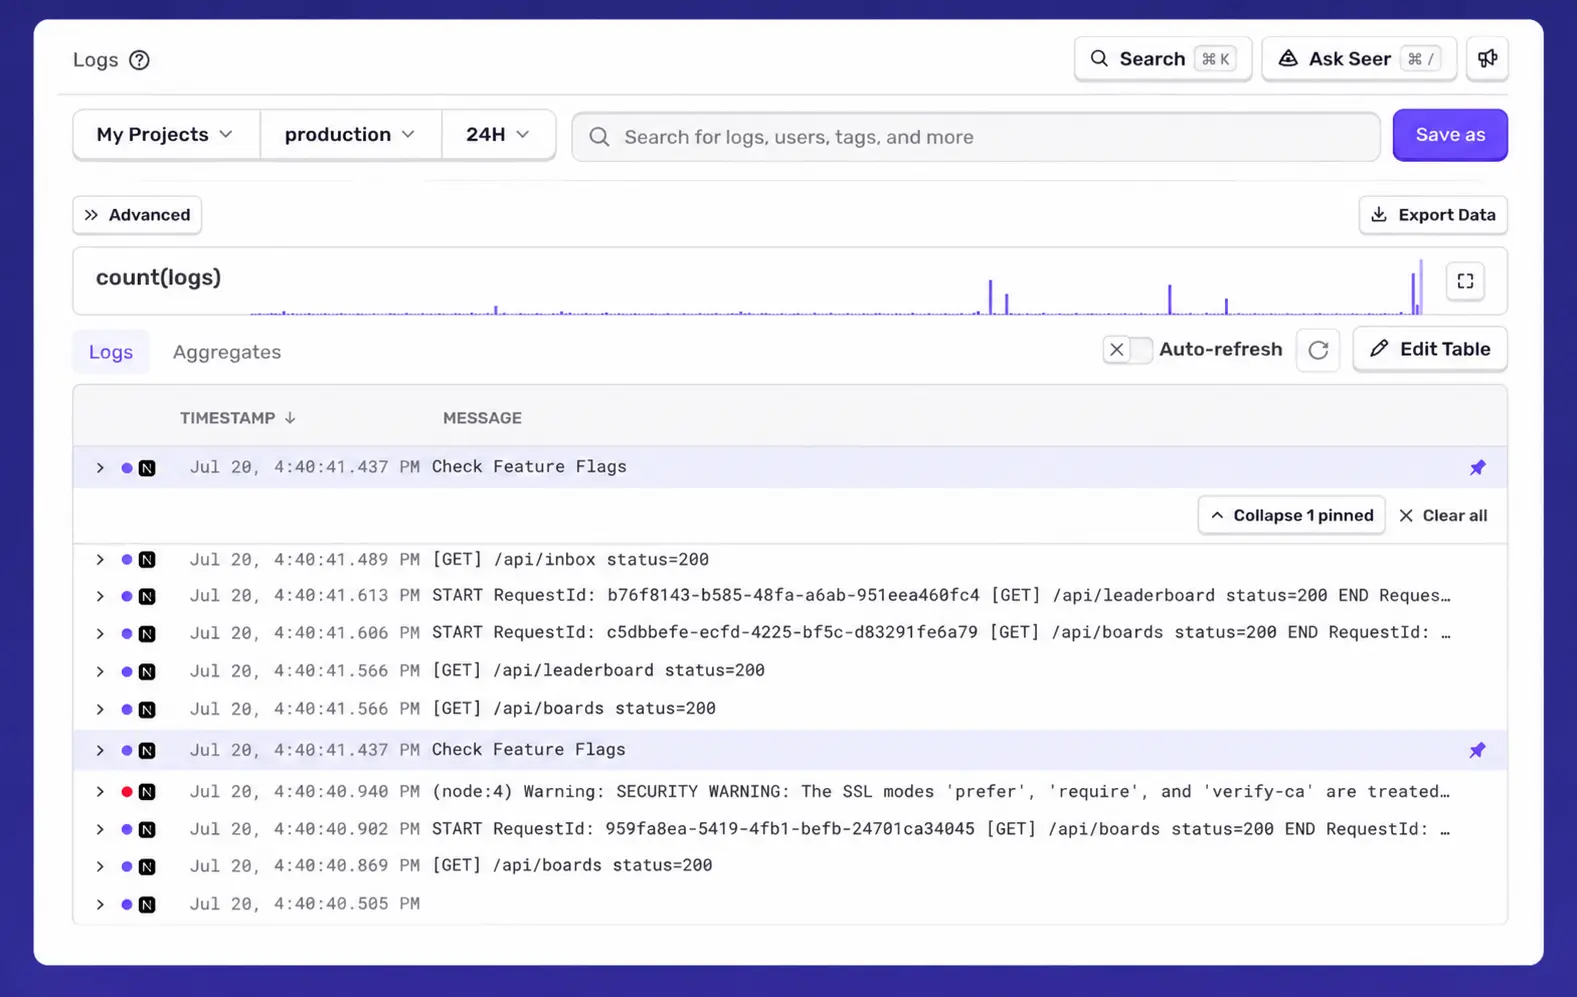
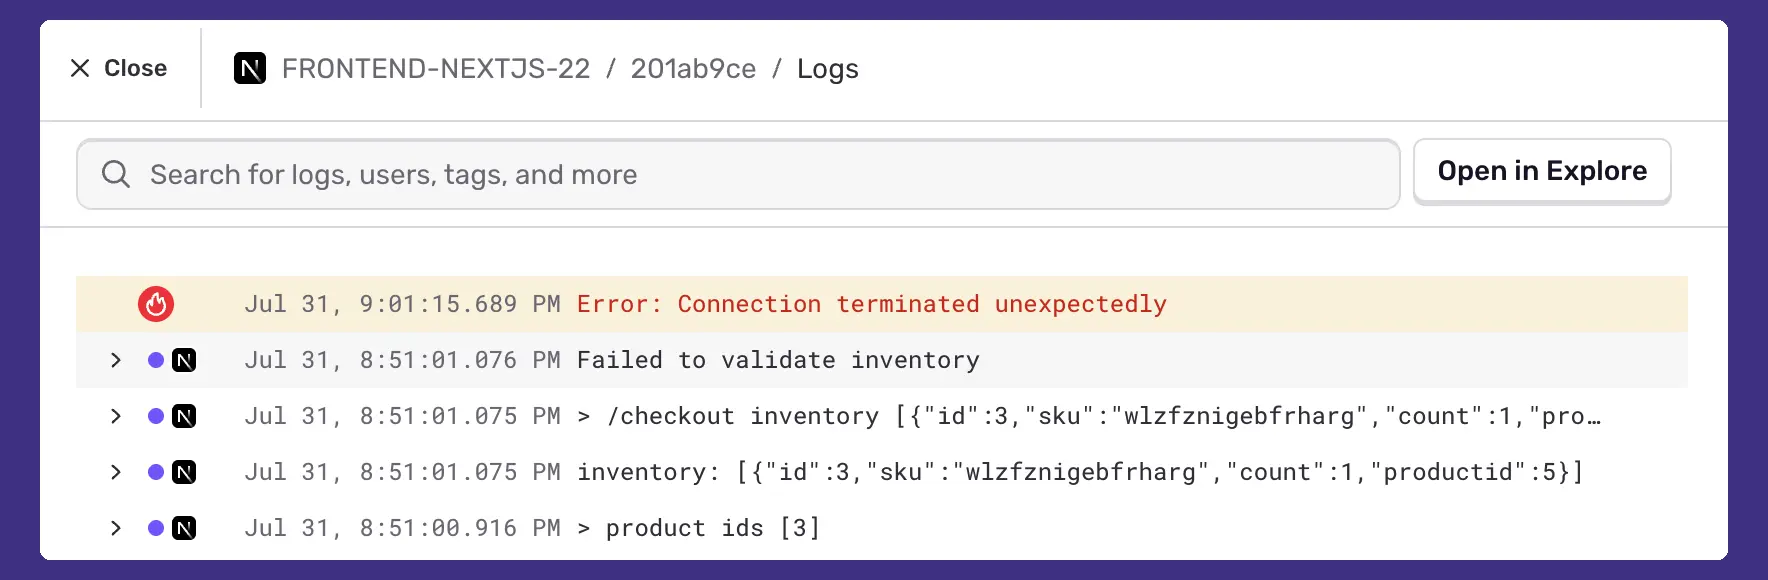
Sentry now has log pinning, so the next time you spot something interesting, you can pin the log line so it stays put while you keep scrolling, streaming in new logs, or refining your search. Pins are also synced to URL state, so a pinned view is a real, shareable link for the next time you want to show a teammate exactly what you’re looking at.
Export logs at scale
We overhauled logs exports to handle large volumes faster and let you customize exactly what you’re exporting.
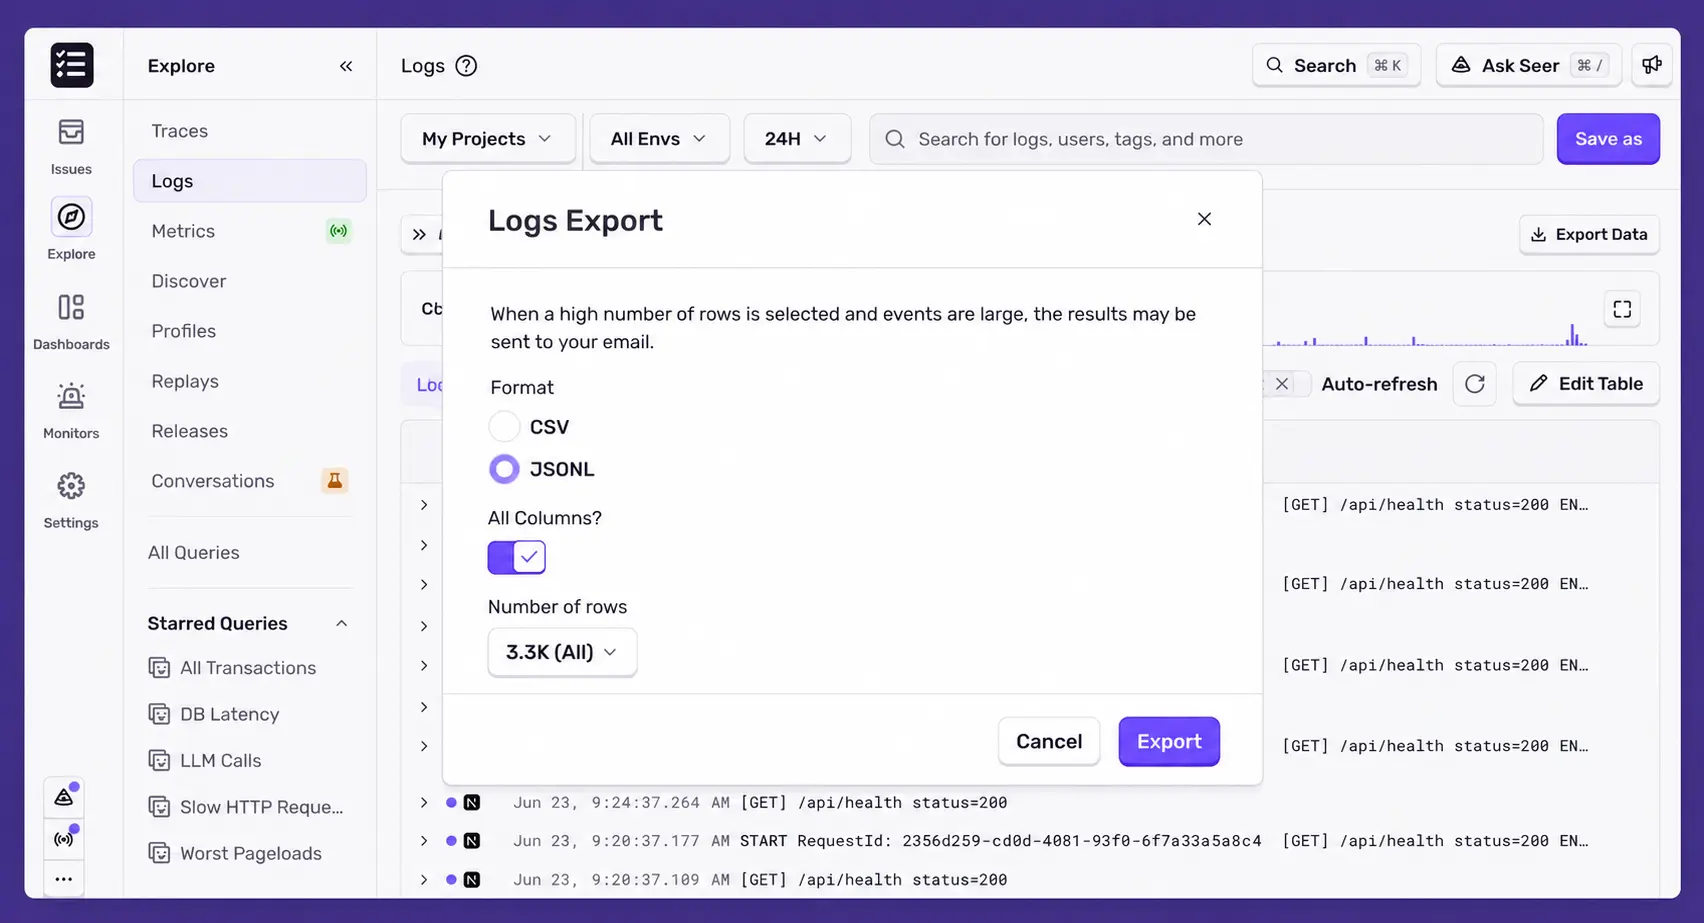
Now, exports go through a dedicated export dialog where you choose your row count and format up front, including a new JSONL option built for larger exports. The result is a faster export and considerably lighter on our servers, because we’re no longer guessing at what “export everything” should mean.
And because exports of individual log rows now include full attribute data, not just what’s visible in the table, they’re more useful if you want to pull a batch of logs into your own tooling.
Exporting is also now aggregate-aware: if you export while viewing an aggregate (say, a count grouped by some attribute), you get those aggregates, matching what you were actually looking at, instead of always falling back to the raw underlying logs.
This isn’t a logs-only improvement, either. The same underlying export capability is now available across Errors and Tracing.
Usability improvements for the log viewer
The logs page is faster now. A new, more constrained layout plus loading less data up front both add up to quicker load times. Beyond that, the rest of this is basically our bug tracker’s greatest hits to make using Sentry Logs more delightful to use:
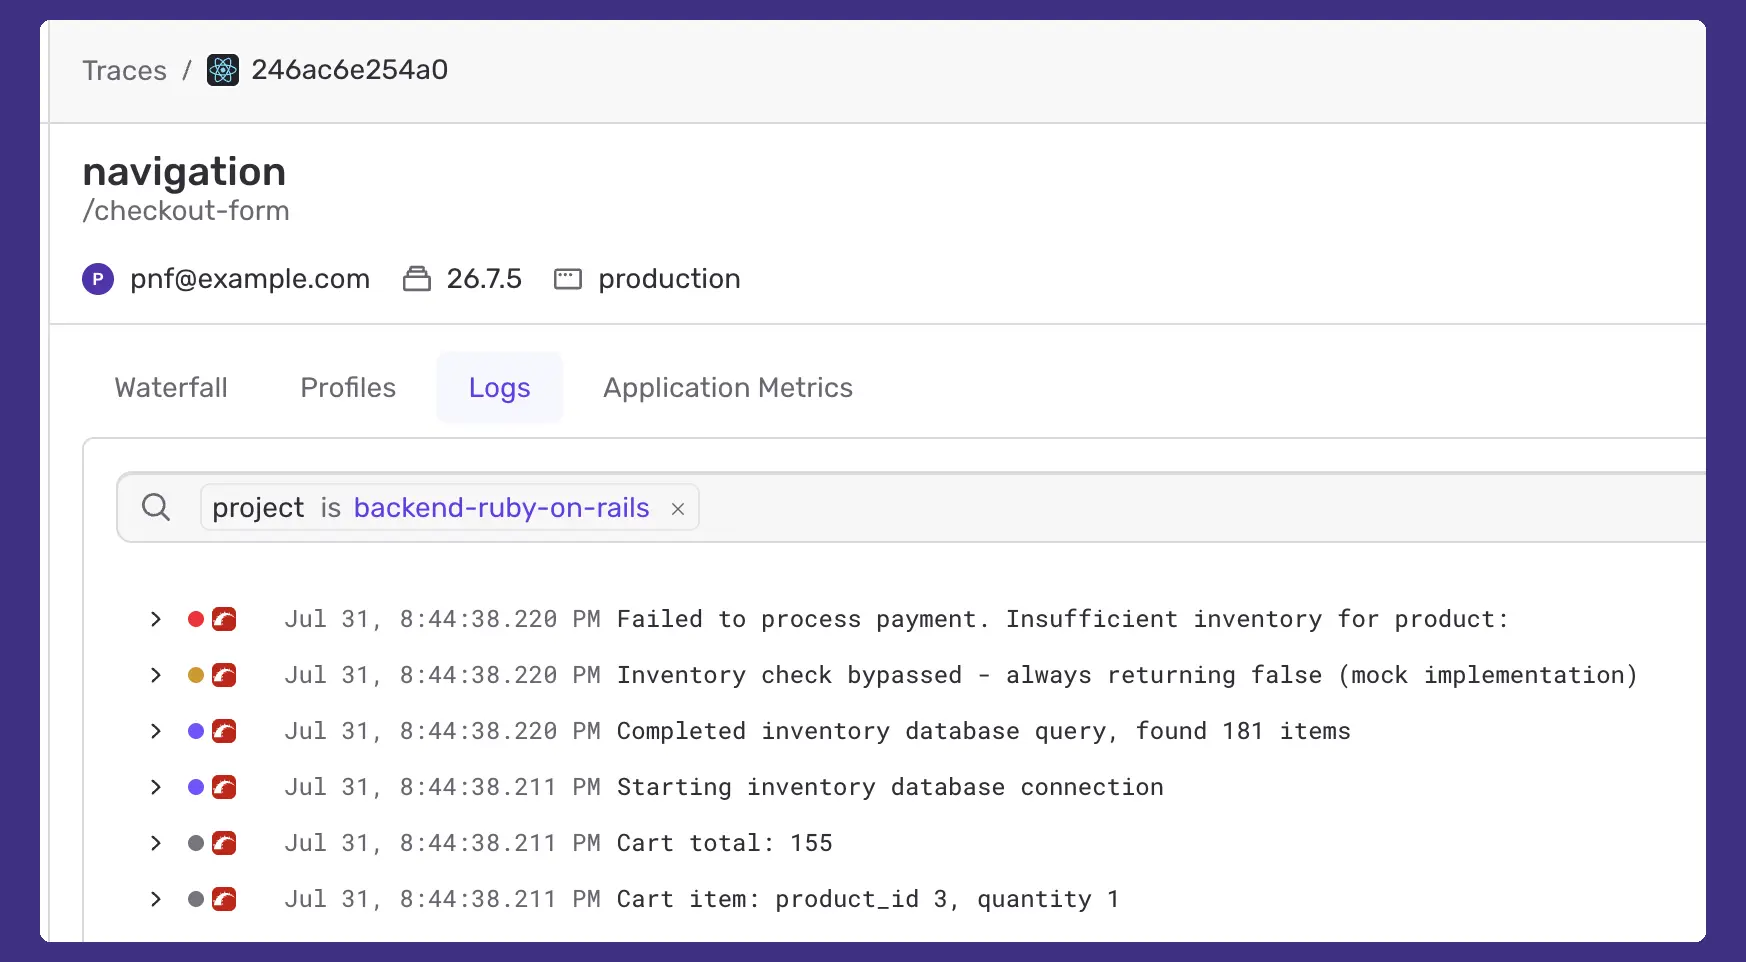
Filters in the trace view Logs tab. Previously, the Logs tab inside a trace had no way to filter at all. Now you can narrow down what you’re looking at without leaving the trace.
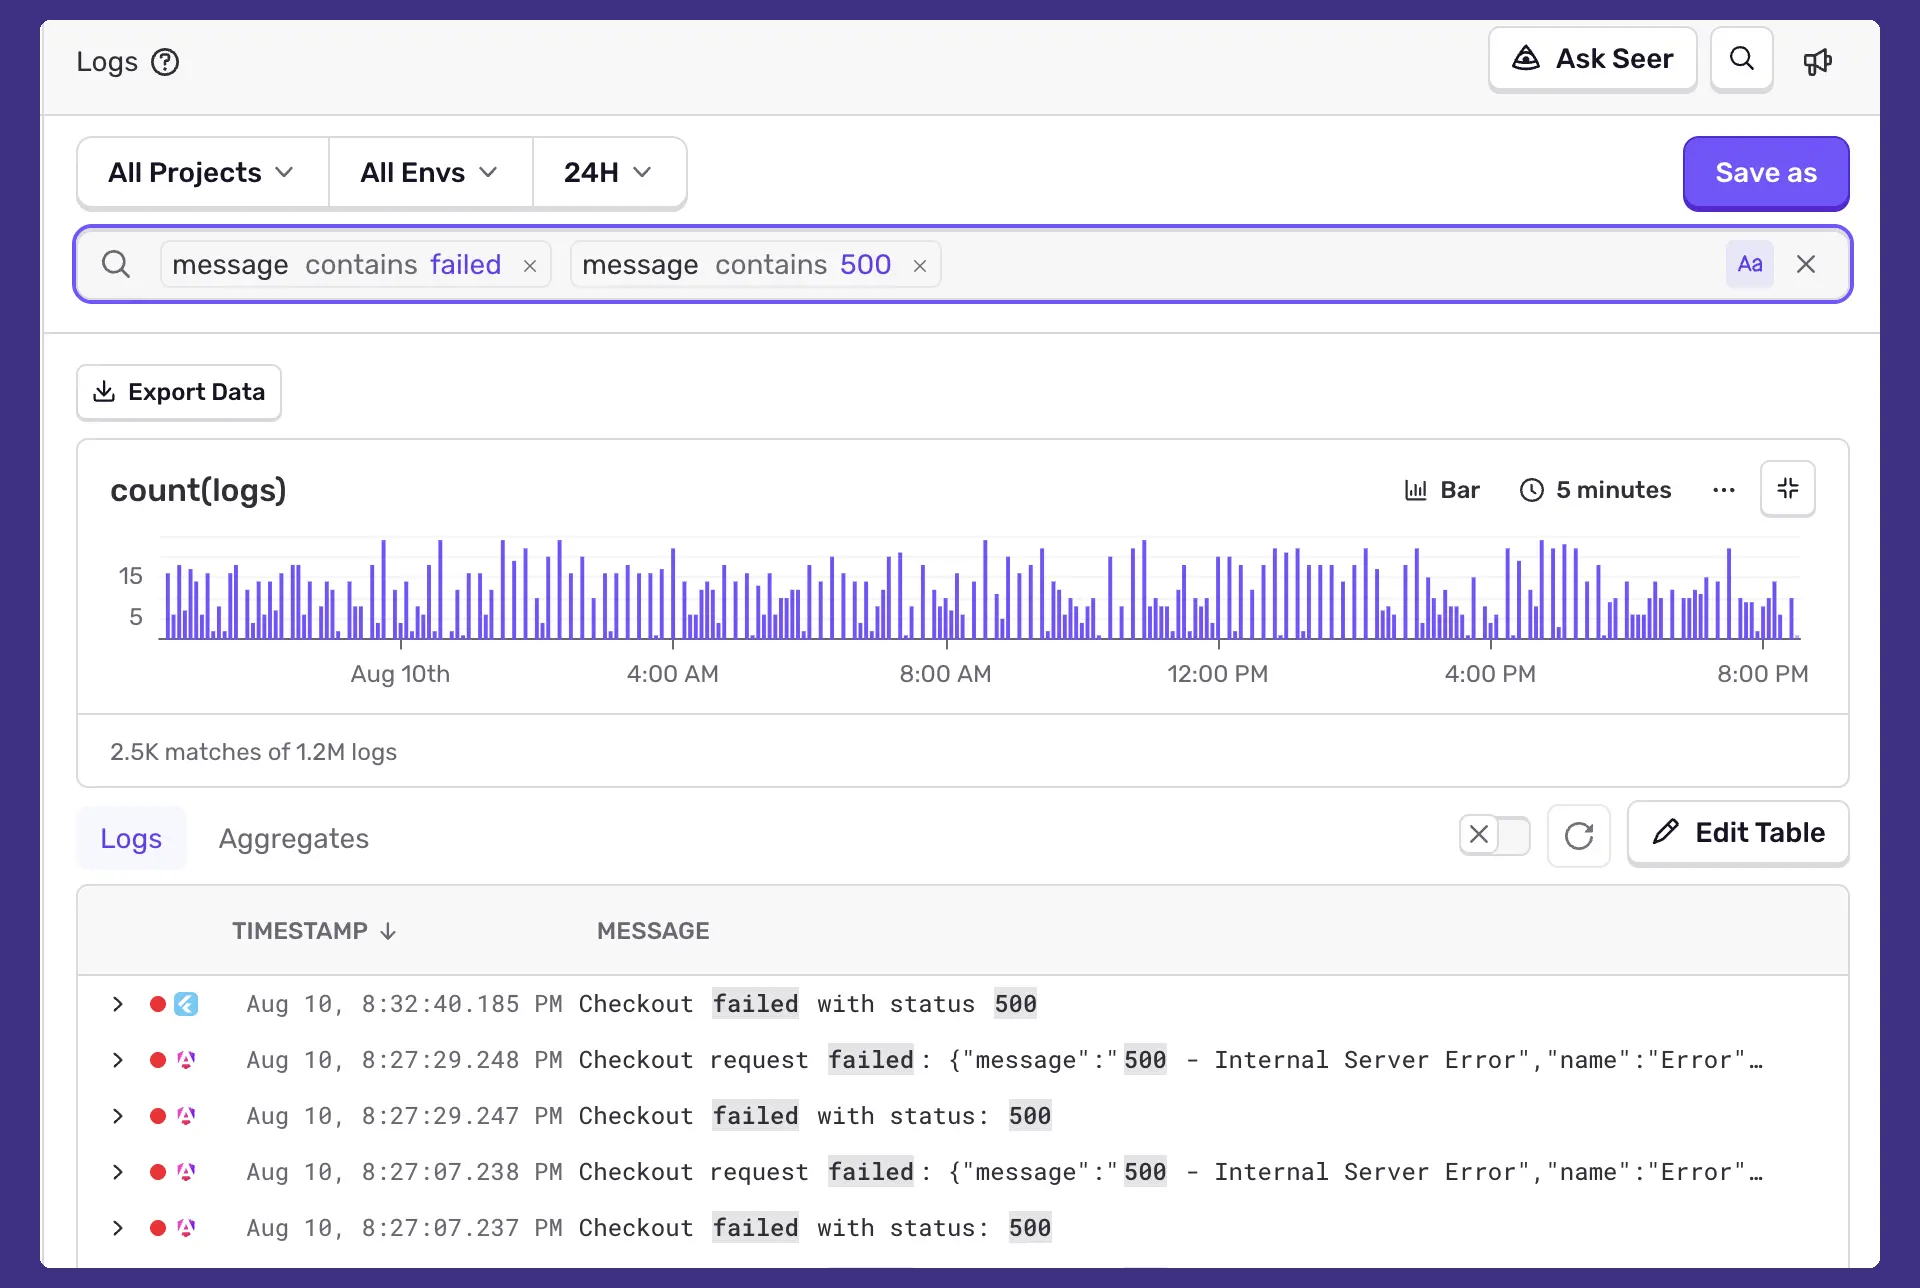
Every matching search term gets highlighted, not just the first one that matches in a line.
The error instance now shows up inline in the logs table on an issue, so you can see the error and the logs around it together instead of cross-referencing two views.
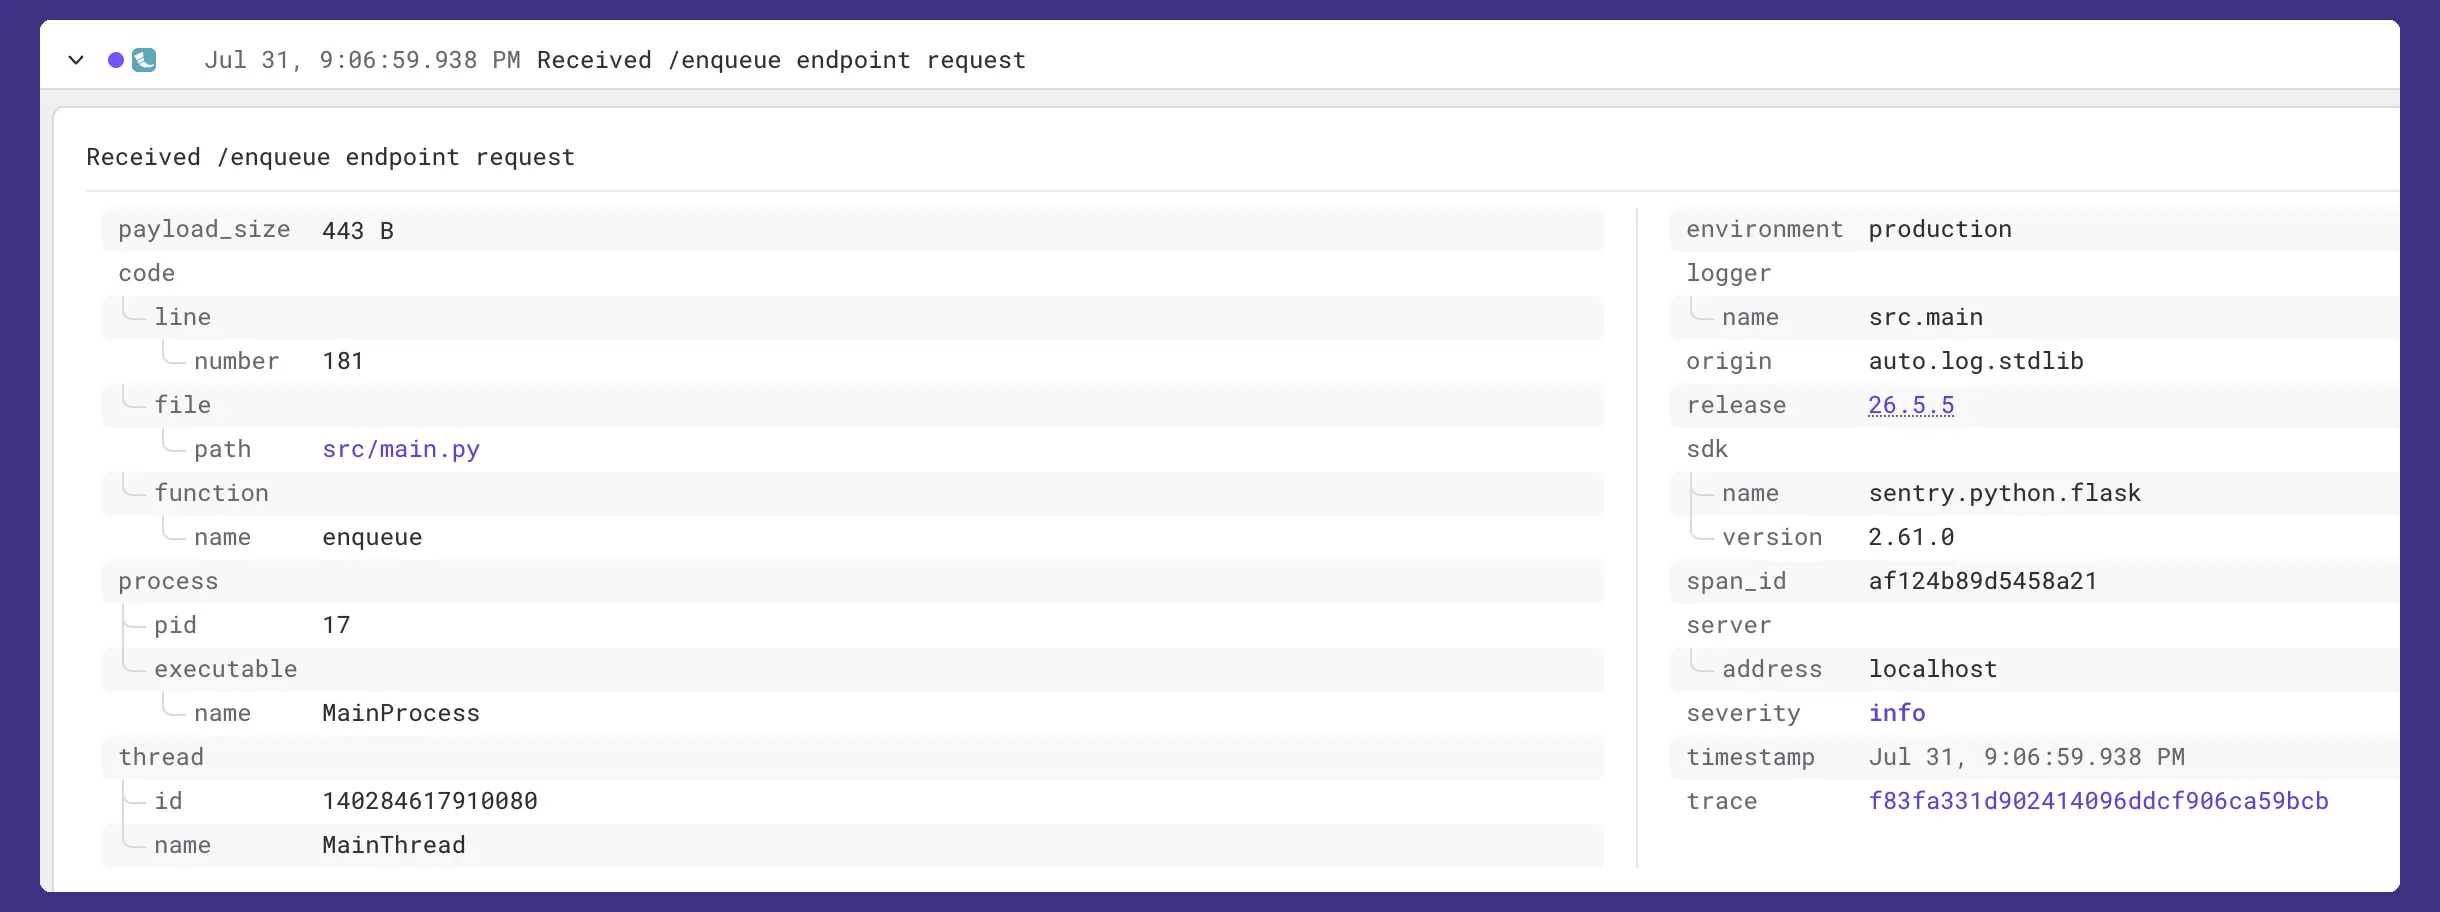
Timestamp is now always visible in the log details panel, even if you arrived from a dashboard link where the timestamp column had been dropped from the table.
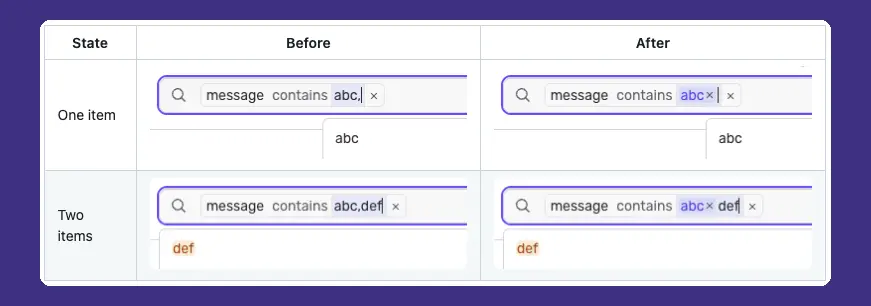
Multi-value search filters now show as individual chips, instead of one long comma-separated value. Previously, message contains abc,def rendered as a single confusing text blob. Now abc and def are separate chips.
Drag-to-zoom no longer wrecks your browser history. It used to write three history entries per zoom, so hitting “back” didn’t take you where you expected. Now it’s one zoom, one entry.
Logs chart enhancements
We also made some UX enhancements to our logs charts. In case you haven’t noticed, a lot of it has to do with giving you more room on the screen for your actual logs:
Charts can now expand and contract, with a standardized button in the top-right corner. Expand a chart when you want more room to look at it; contract it back down when you’d rather have the space for your logs.
Y-axis ticks now scale with the chart’s actual height, not your browser’s viewport height. Resize your window and the chart stays legible instead of collapsing down to two ticks.
Chart hover tooltips are a lot less flaky and no longer immediately disappear if you have auto-refresh enabled.
We expanded the color palette for grouped series, so it’s easier to tell apart what you’re looking at when a query returns more than a couple of groups.
Scaling logs data with Sentry
For orgs sending hundreds of gigabytes or terabytes of logs, the hard problem was never storing the data, it was finding one specific line out of all of it: a needle-in-the-haystack search.
We put in frontend and backend work this quarter specifically to support that scale, including longer query timeouts with continuations and better handling around rate limits, so search stays usable even with a genuinely large volume of logs.
A couple of smaller fixes ride along with this:
release:latest filters now work correctly in Logs and Trace Explorer. They previously returned empty results in some flows, like saved dashboard widgets, which made it look like there was nothing to see when there was.
Rate limit errors say what they are. If you hit a throughput limit, the UI tells you that you’re being rate limited, instead of surfacing a generic error that looks like something’s broken. And there’s a retry button now, so you don’t have to refresh the entire page to try again.
Try it and tell us what you want to see next
We know a list of shipped features isn’t exactly thrilling reading and if you made it to the end of our updates, thank you.
Don’t forget, if something is broken, missing, or just annoying, we want to hear about it. Hit the product feedback button in-app, or reach our team directly at logs@sentry.io.
The OpenTelemetry instrumentation packages needed a Node module loader, a package.json file, and a mutable exports object. v11 replaces all of that with a source transform and diagnostics channels, so tracing now works on Cloudflare Workers, Bun, Deno, and bundled server deployments.
With Unreal Engine 5.8, your coding agent can drive the editor through Unreal MCP. The Sentry plugin adds tools and skills so it can set up Sentry, upload debug symbols, and root-cause crashes for you.
Should you use Seer or just connect the MCP to your agent? A breakdown of what Seer, the Sentry agent plugin, the CLI, and coding agent handoffs each do — and when to reach for one over the other.