Sentry for Data: Optimizing Airflow with Sentry
Sentry for Data: Optimizing Airflow with SentryIn our Sentry for Data series, we explain precisely why Sentry is the perfect tool for your data team. The present post focuses on how we optimized Airflow for deeper insights into what goes wrong when our data pipelines break.
Data enables Sentry's go-to-market teams by generating high-quality leads and tailored marketing campaigns. Of course, data is also used to steer the business by influencing how we think about Sentry pricing, future opportunities, and feature roadmap.
Apache Airflow is our tool of choice for executing data pipelines. With its simple approach to writing DAGs (directed acyclic graphs), Airflow enable our sales and marketing teams to offer the best experience for our customers.
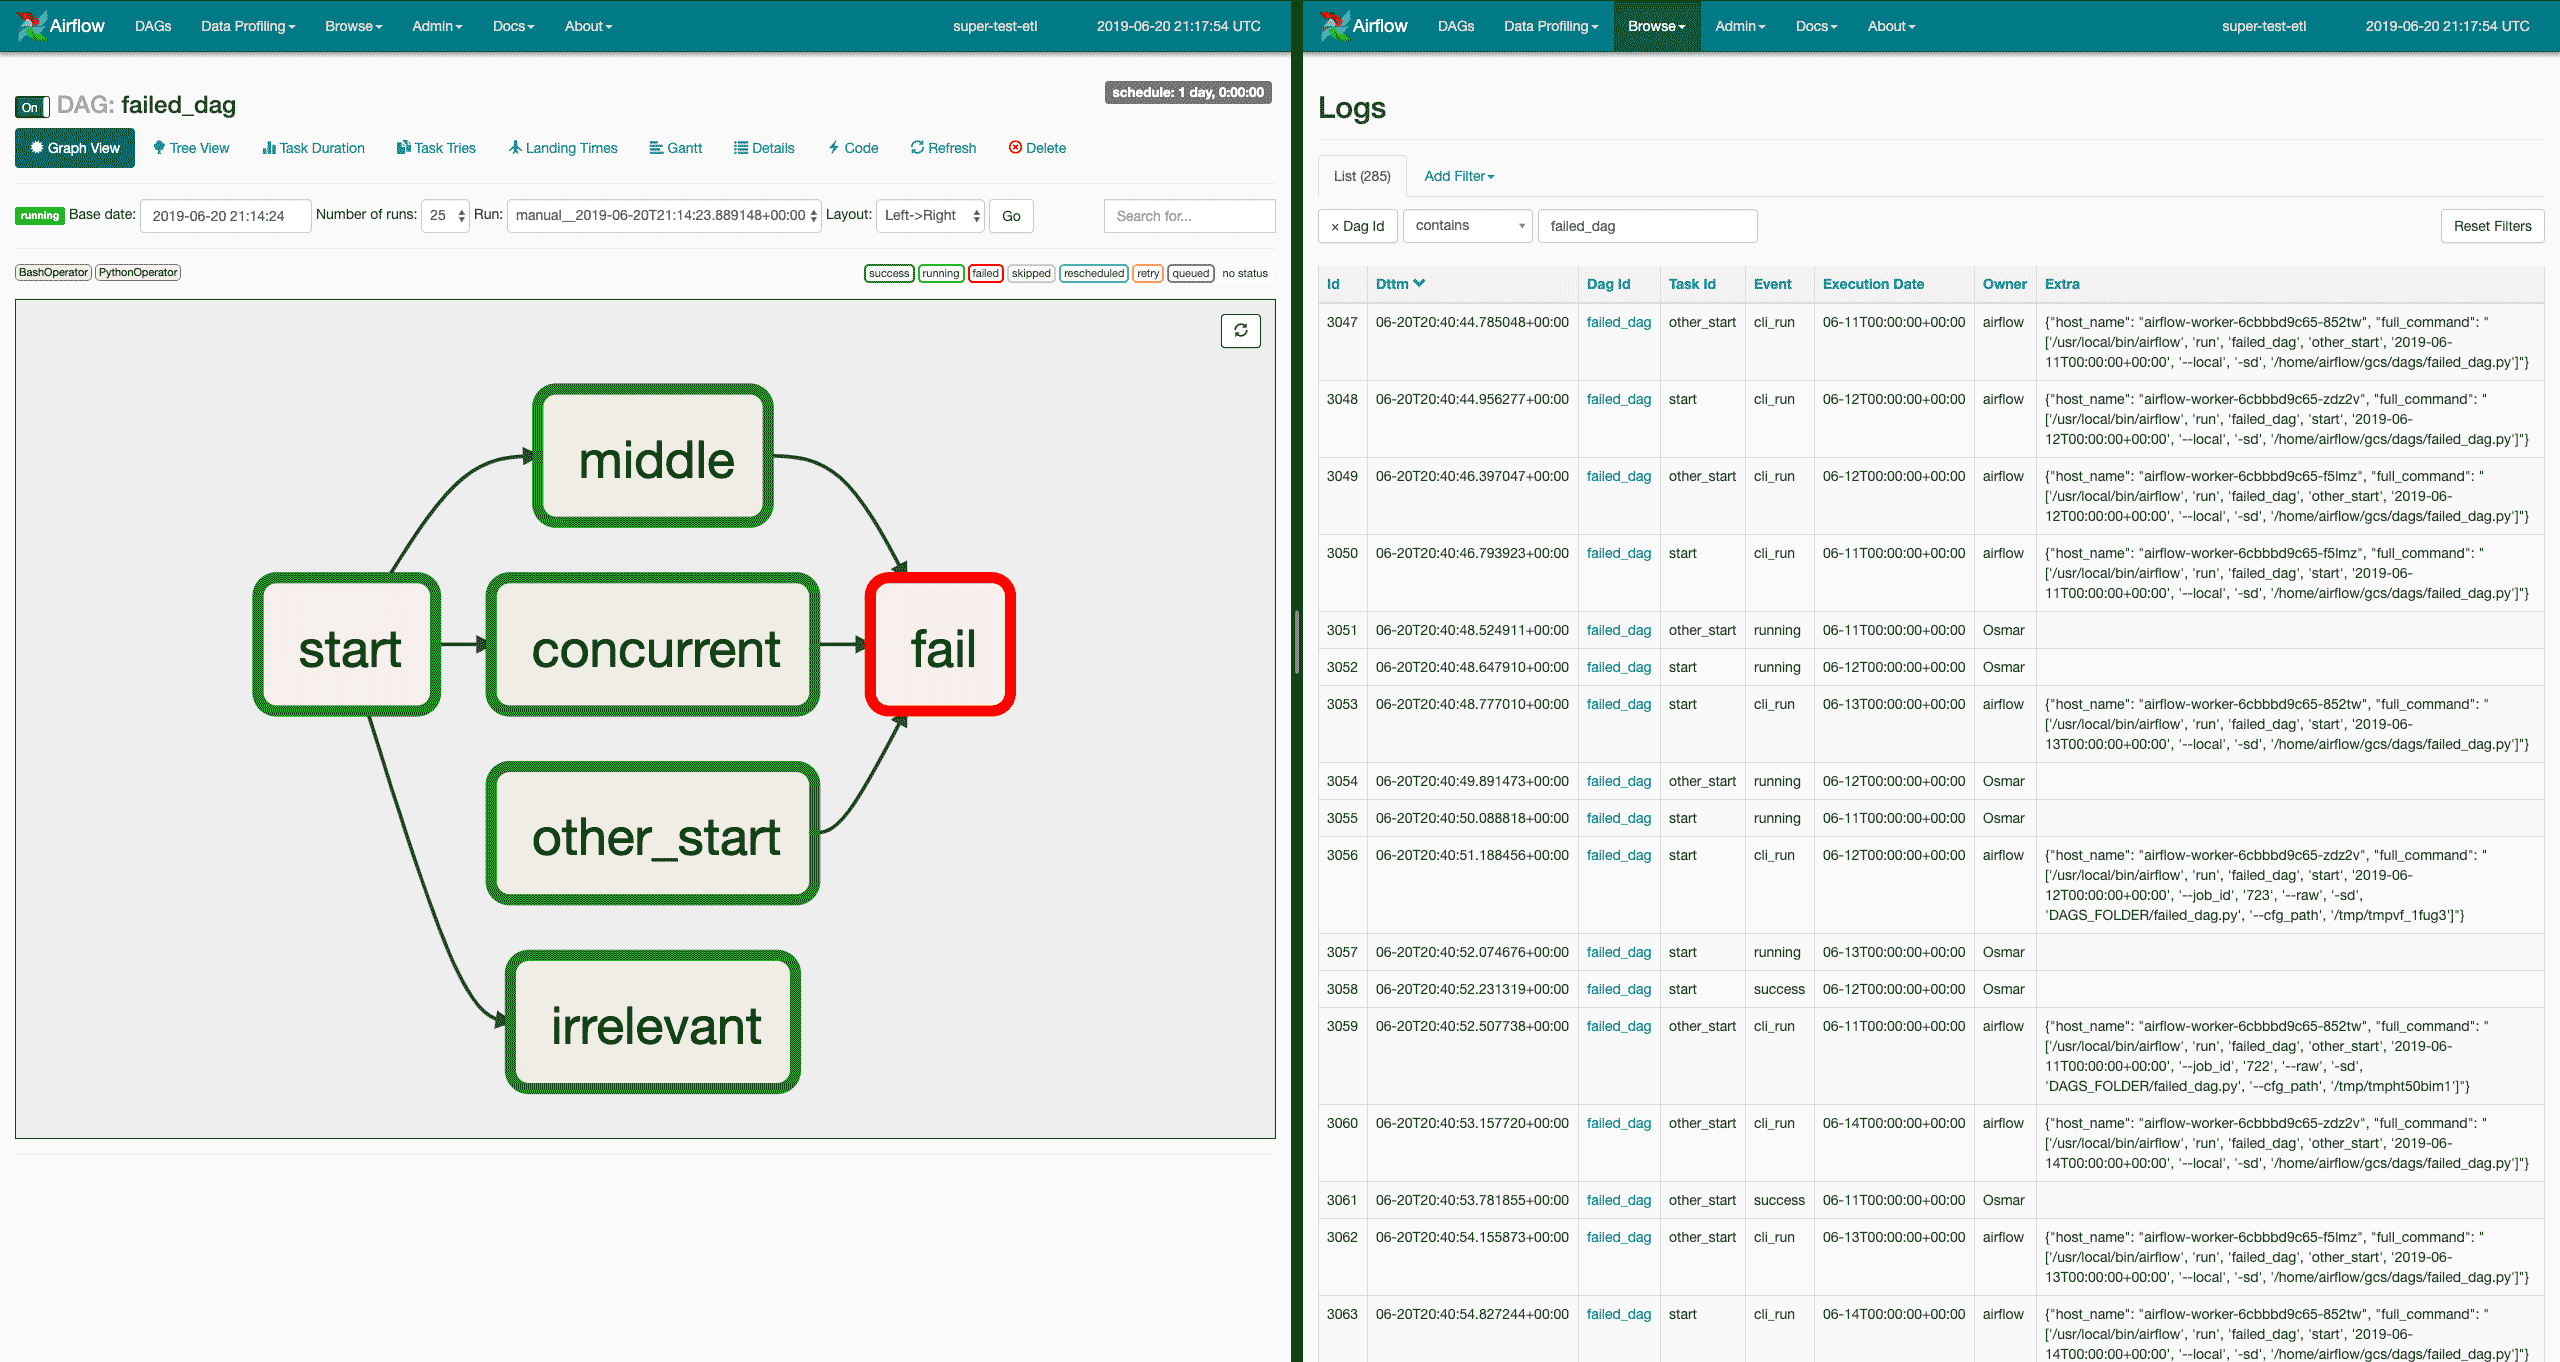
However, for all of the things we enjoy about Airflow, one obstacle we encountered was understanding what actually goes wrong when our data pipelines break. While the built-in log interface inside Airflow is a decent starting point, it lacks the full context surrounding the exception, which makes issue resolution painful.

Airflow’s logs can be a useful starting point, but they lack the valuable context Sentry provides.
We recently introduced a new plugin, sentry-airflow, to the Airflow ecosystem that combats the absence of visibility by collecting, handling, and reporting any errors that occur within Airflow tasks upon execution.
Getting started
sentry-airflow is a drop-in solution that only requires SENTRY_DSN specification.
There are only two required steps:
Place the plugin in the
$AIRFLOW_HOME/pluginsfolder.Set the
SENTRY_DSNenvironment variable.
However, for those running Airflow via Google Cloud Composer, the installation is just one step (lucky you):
$ gcloud composer environments storage plugins import --environment ENVIRONMENT_NAME \
--location LOCATION \
--source sentry-airflow/sentry-plugin \
--destination PATH_IN_SUBFOLDERHandling the errors
After the configuration is complete, Sentry collects all information about failed tasks.

Airflow errors (both internal to the framework and in user code) arrive in Sentry.
Errors arrive in Sentry with useful tags, like dag_id, task_id, execution_date, and operator.

Tags allow for quick identification of the failed data pipeline.
For additional insight into previous tasks that might have also failed, errors include the upstream DAG tasks as breadcrumbs.

Breadcrumbs provide a series of steps leading up to the data pipeline failure.
Getting the plugin
You can find sentry-airflow here. The plugin is currently available for use and constantly improving.
If you have any feedback, want more features, or need help using the tool, open an issue on the GitHub repository or shout out to our support engineers. They're here to help. And also to code. But mostly to help.


