React Native Debugging & Tracking During App Development
React Native Debugging & Tracking During App Development
A good developer knows how to debug code. Most software engineers spend the majority of their time debugging existing code rather than writing new code. When it comes to native app development, debugging, and error monitoring during the development process can be a tricky task.
So, in this post, I'll help you understand React Native debugging and also track errors during app development. We'll also explore a tool called React Native Debugger and understand a bit about error tracking.
How to Debug a React Native App
It's helpful to know what debugging strategies can help you debug your code in development more effectively. Sometimes, a dedicated debugging tool may also come in handy.
First, let's understand the common techniques you can use for debugging in a React Native app. I've created a new Expo-based React Native project that I'll use throughout this tutorial. You can do the same using the following command:
expo init react-native-debuggingHere's some simple React Native code:
import { StatusBar } from 'expo-status-bar';
import { StyleSheet, Text, TouchableOpacity, View } from 'react-native';

export default function App() {
  const handlePress=()=>{
    console.log('pressed')
  }
  return (
    <View style={styles.container}>
      <Text style={styles.heading}>React Native Debugging</Text>
      <TouchableOpacity style={styles.button} onPress={handlePress}>
        <Text style={styles.buttonText}>Button</Text>
      </TouchableOpacity>
      <StatusBar style="auto" />
    </View>
  );
}

const styles = StyleSheet.create({
  heading:{
    fontSize:28,
    fontWeight:"700"
  },
  container: {
    flex: 1,
    backgroundColor: '#fff',
    alignItems: 'center',
    justifyContent: 'center',
  },
  button:{
    marginTop:50,
    borderRadius:10,
    padding:10,
    backgroundColor: 'crimson',
    textColor: 'white',
    width:120,
  },
  buttonText:{
    color:'white',
    fontSize:20,
    alignSelf:'center',
    fontWeight:'500'
  }
});
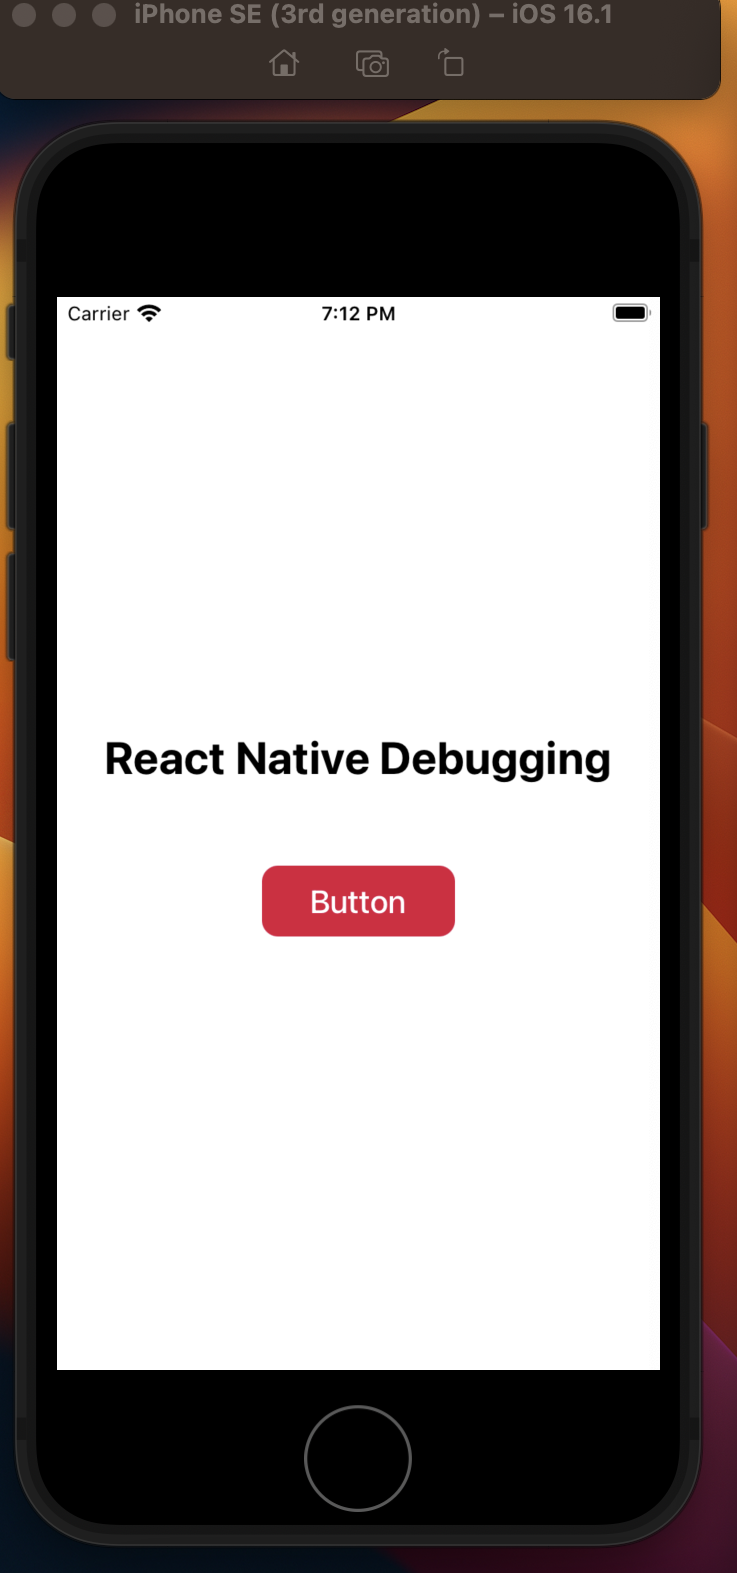
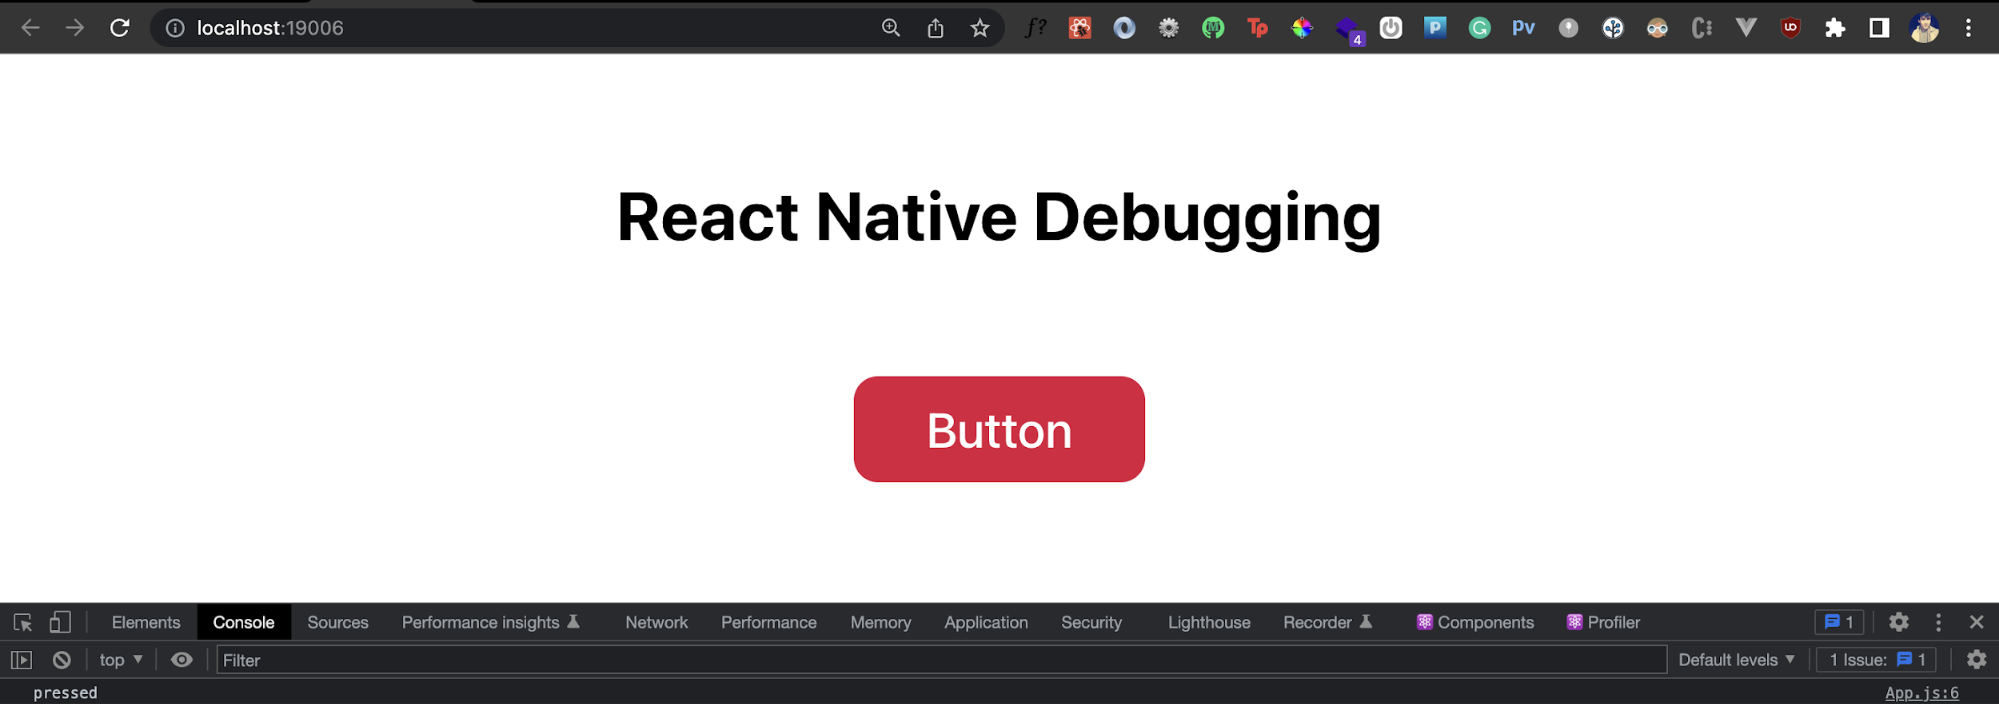
It renders a button that fires a function and prints something on the console:
Use the React Native Debugging Terminal
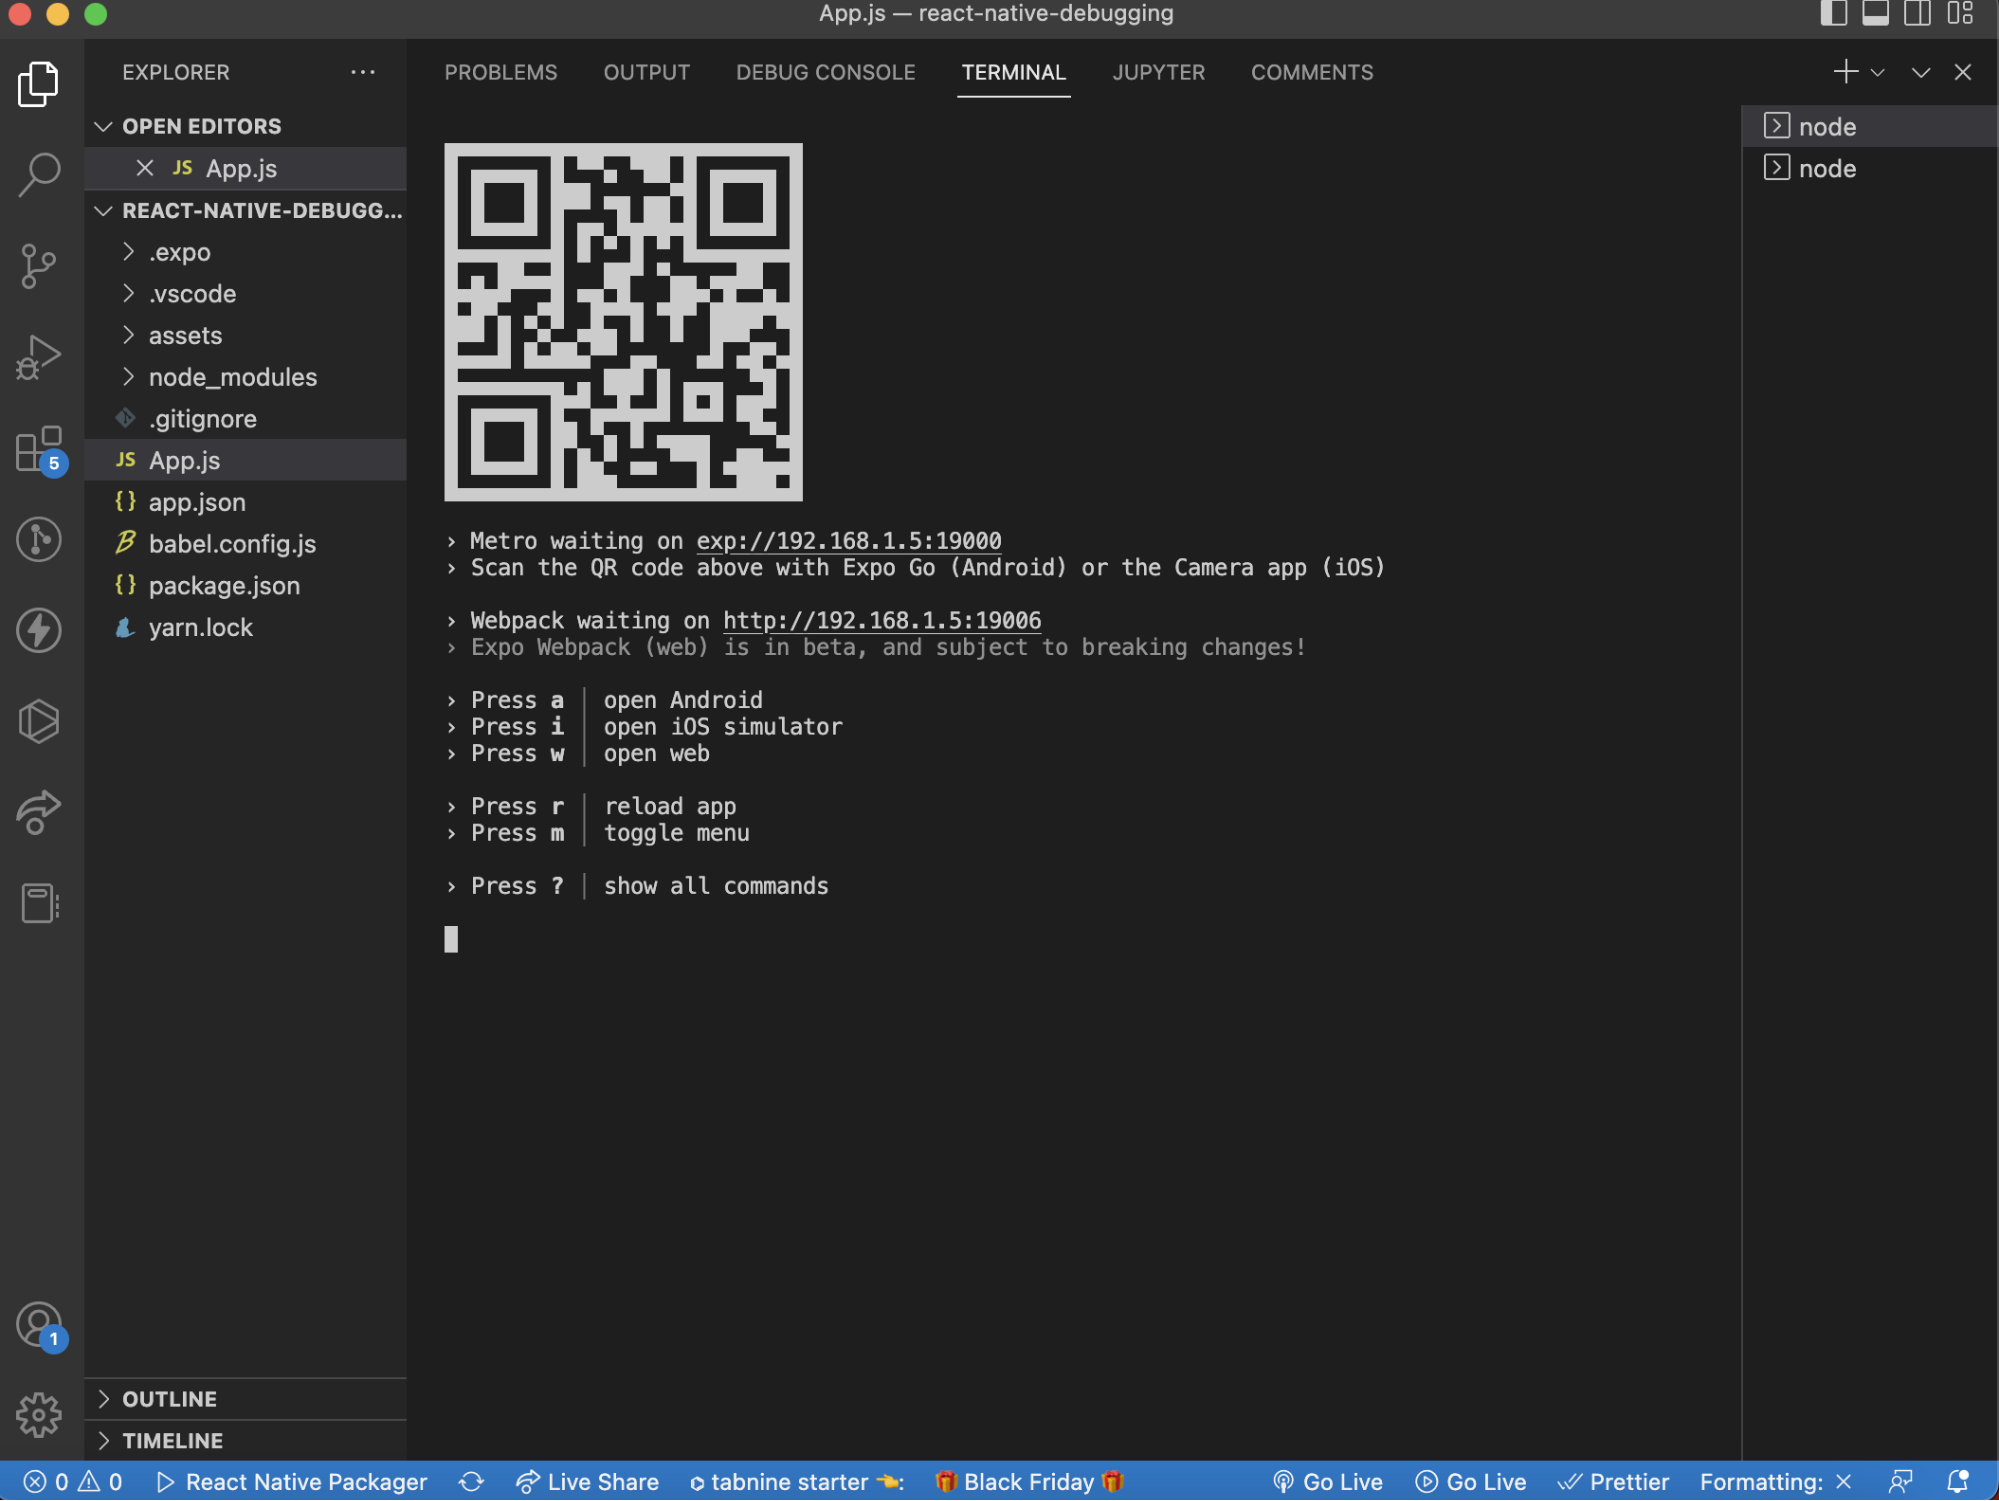
When you launch a new Expo project or run a React Native app, every log of changes you make during development mode appears in the terminal. This could be a separate terminal where you run the expo start command or an integrated terminal in your IDE. For instance, I'm using VS Code, and its terminal gives me the React Native logs for every change I make on the app:
This is similar to how you run any application locally. For any client-side development using frameworks like React or React Native, this terminal will give us client-side logs that we can use to debug our app in development mode.
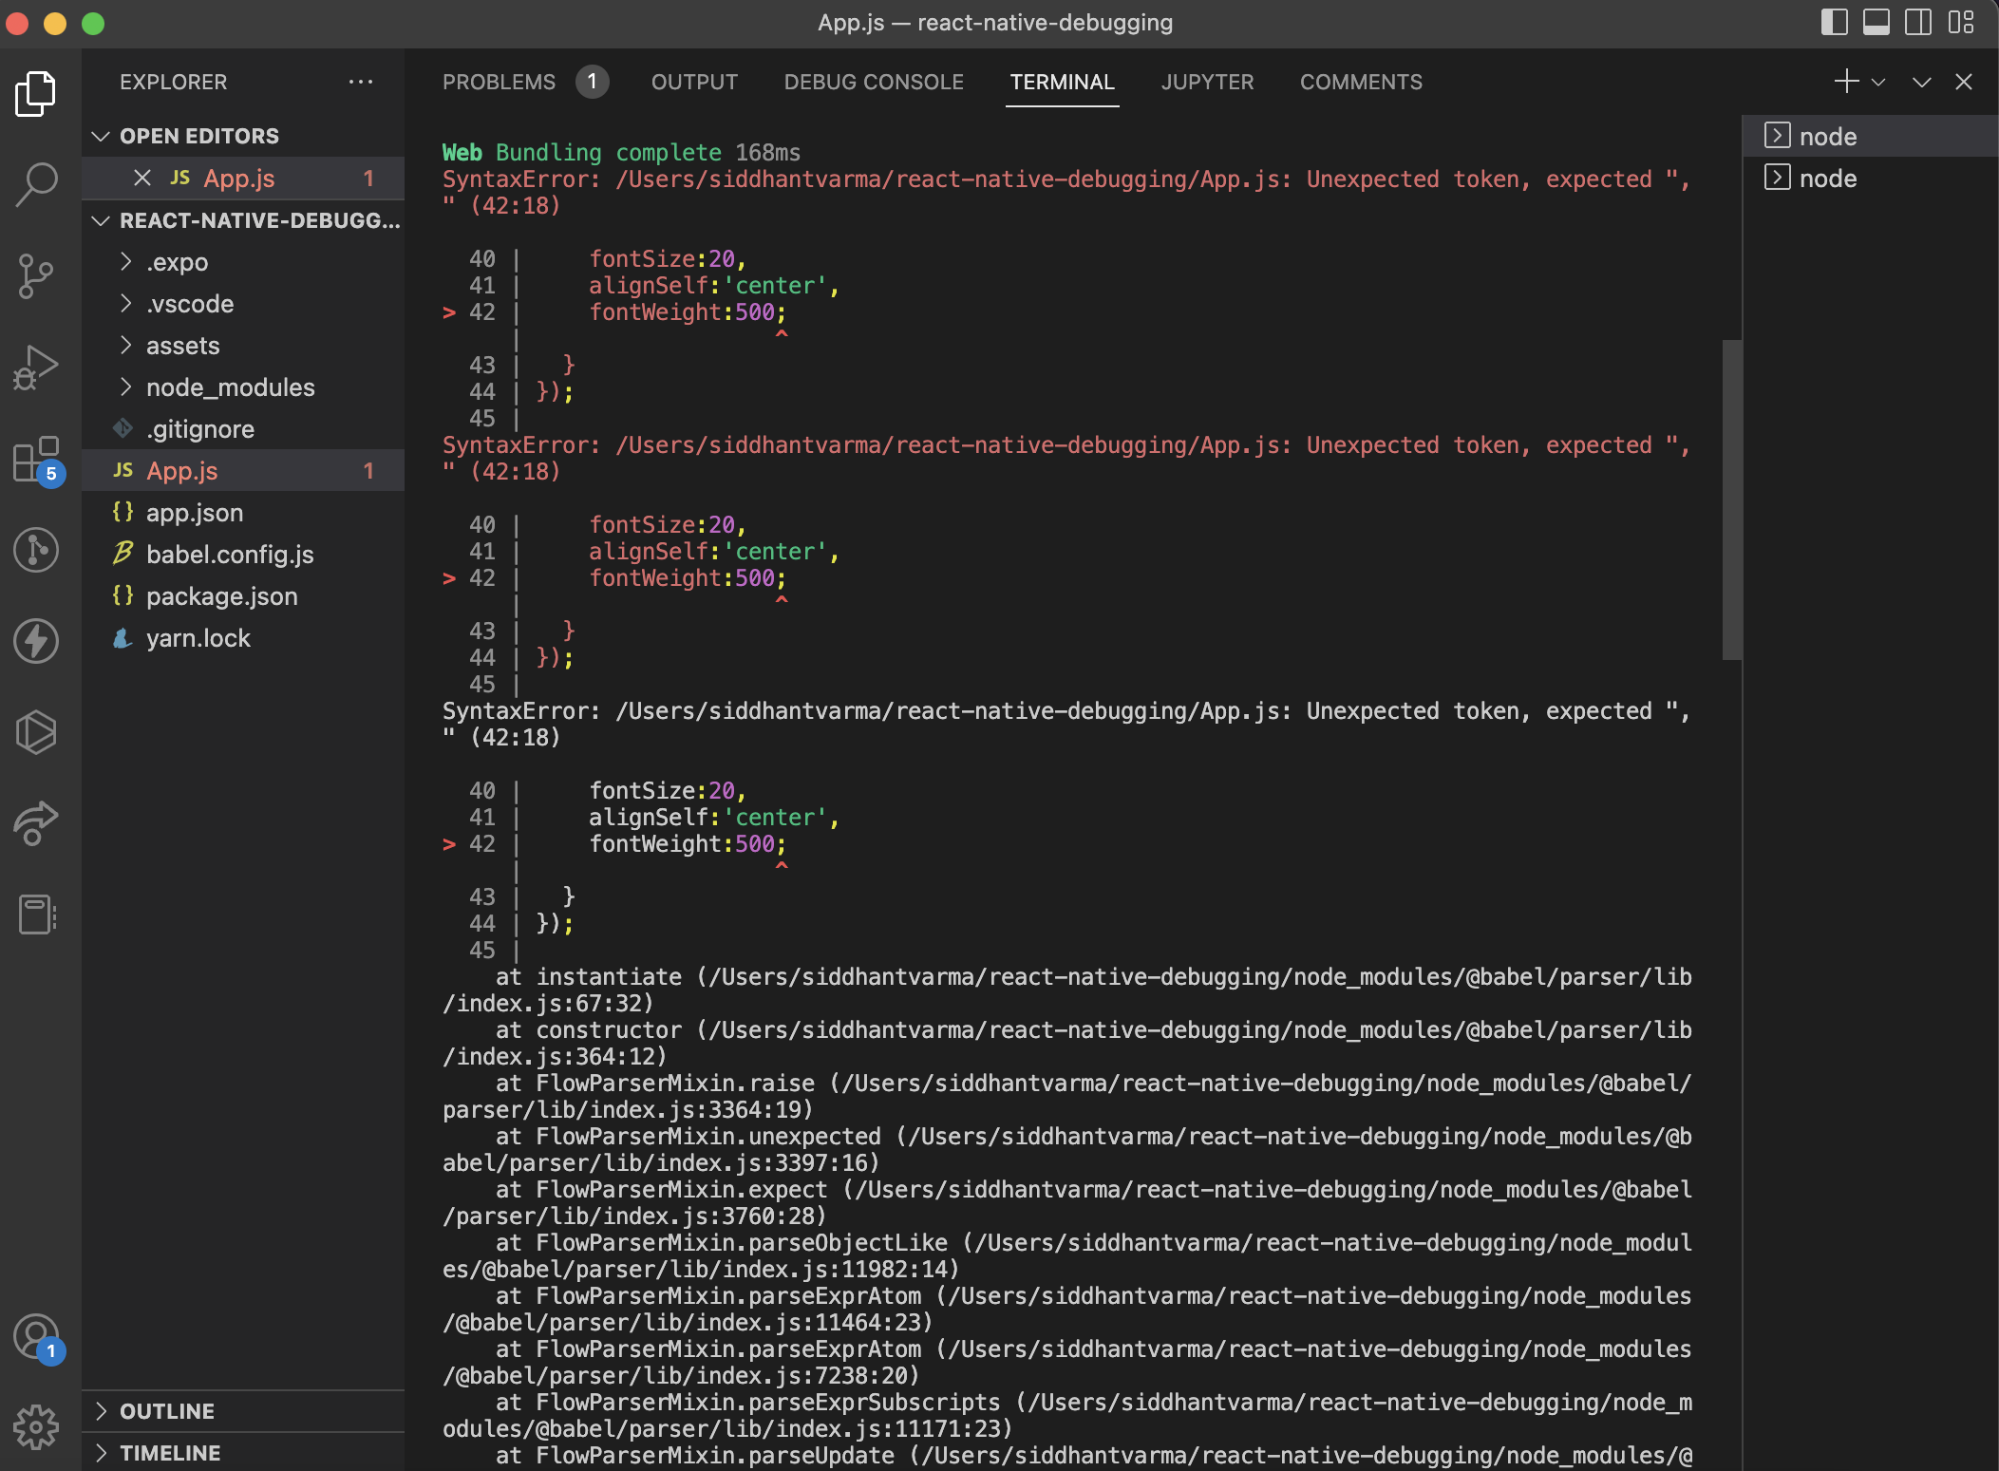
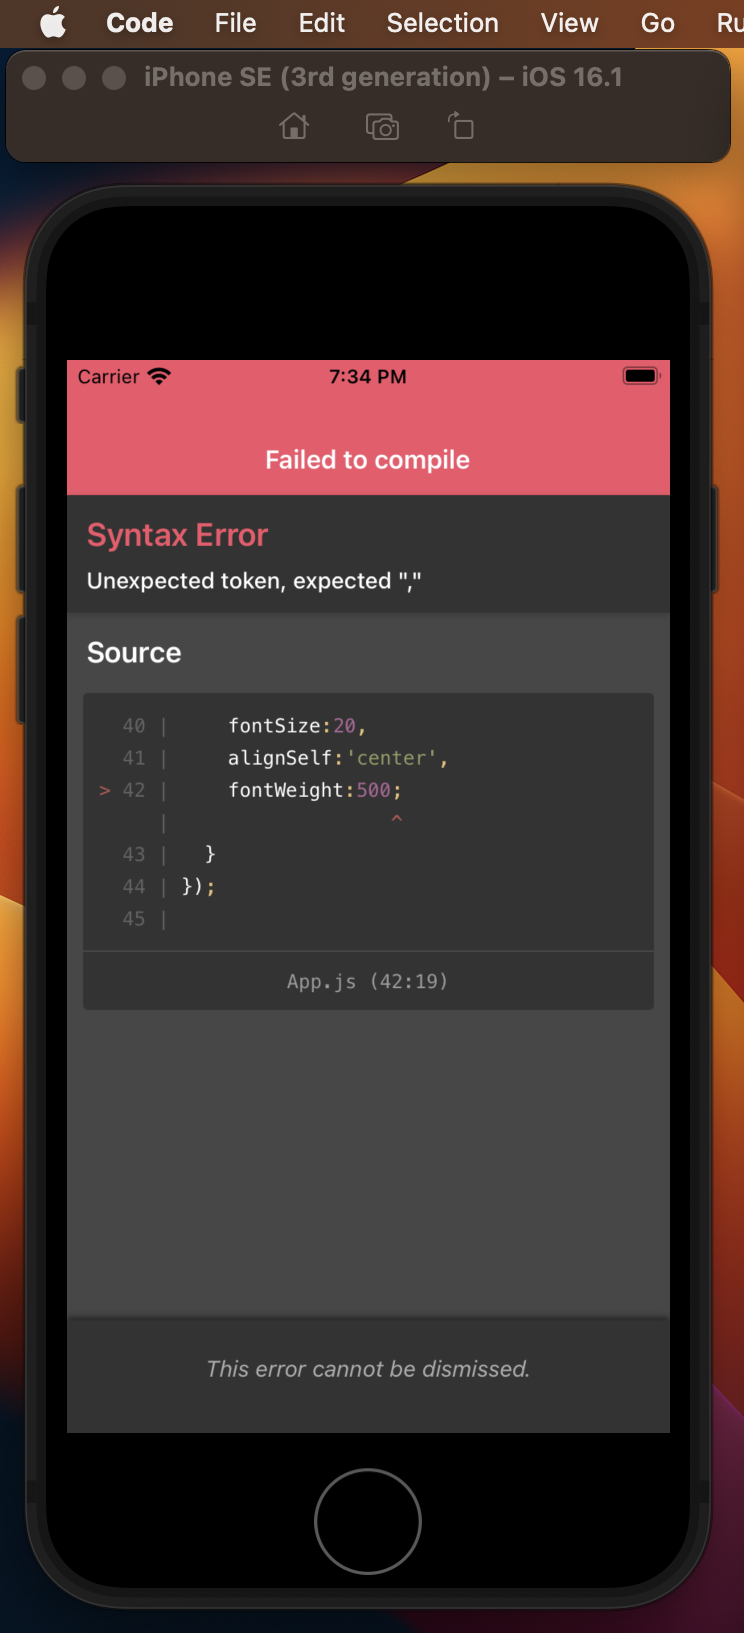
Now, let's say I make a syntax error in the styles of the above section by adding a semicolon at the end. The terminal shows the error as shown:
It specifies the type of error, the file, and the line at which the error was thrown along with an error message. The Expo terminal is the first place where all logs will appear. So, whenever you're debugging your app, that terminal can be the first place to look.
Expo Debugger
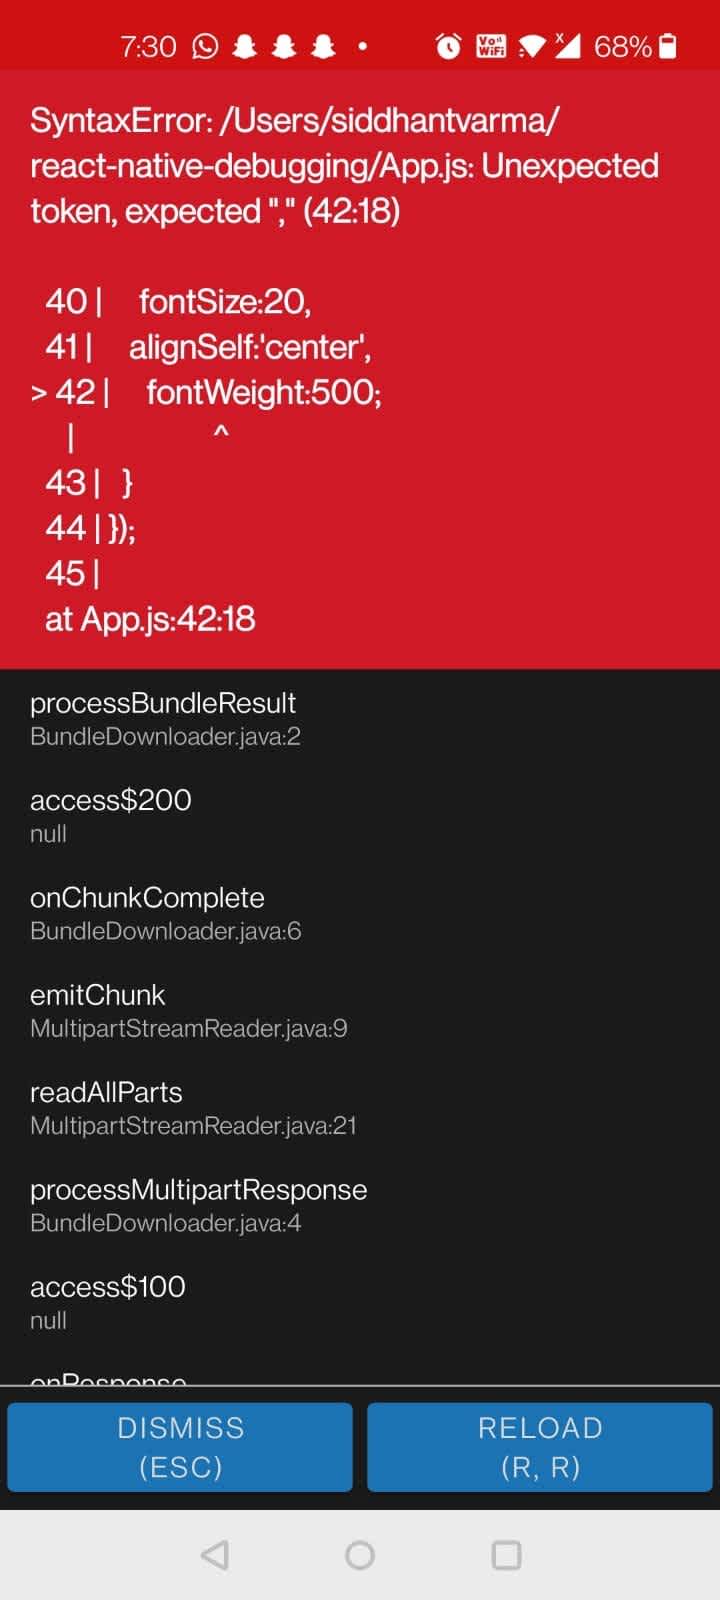
When using Expo with React Native, you get a built-in debugger. This debugger displays the error message, shows you the part of the code where the error appeared, and marks the erroneous part in the code. If you're running your React Native project on a physical device, here's what the error would look like on the Expo app running your app's code:
While you do get to see the error and debug your code easily, the stack trace isn't really helpful in this case. If you're using Expo on an emulator, the React Native logs are much cleaner:
The stack trace is absent here, but it creates less room for confusion and helps you get to the error more quickly.
Use React Native Developer Tools in a Browser
We all know how easy it is to debug a front-end application on the web. Just open the browser and there you have all the logs and errors in the console, the UI elements rendered, a relevant stack trace, and everything else. Luckily you can do the same for a React Native or Expo-based project. All you need to do is either install the React Developer Tools Chrome extension or install it globally in your system using the following command:
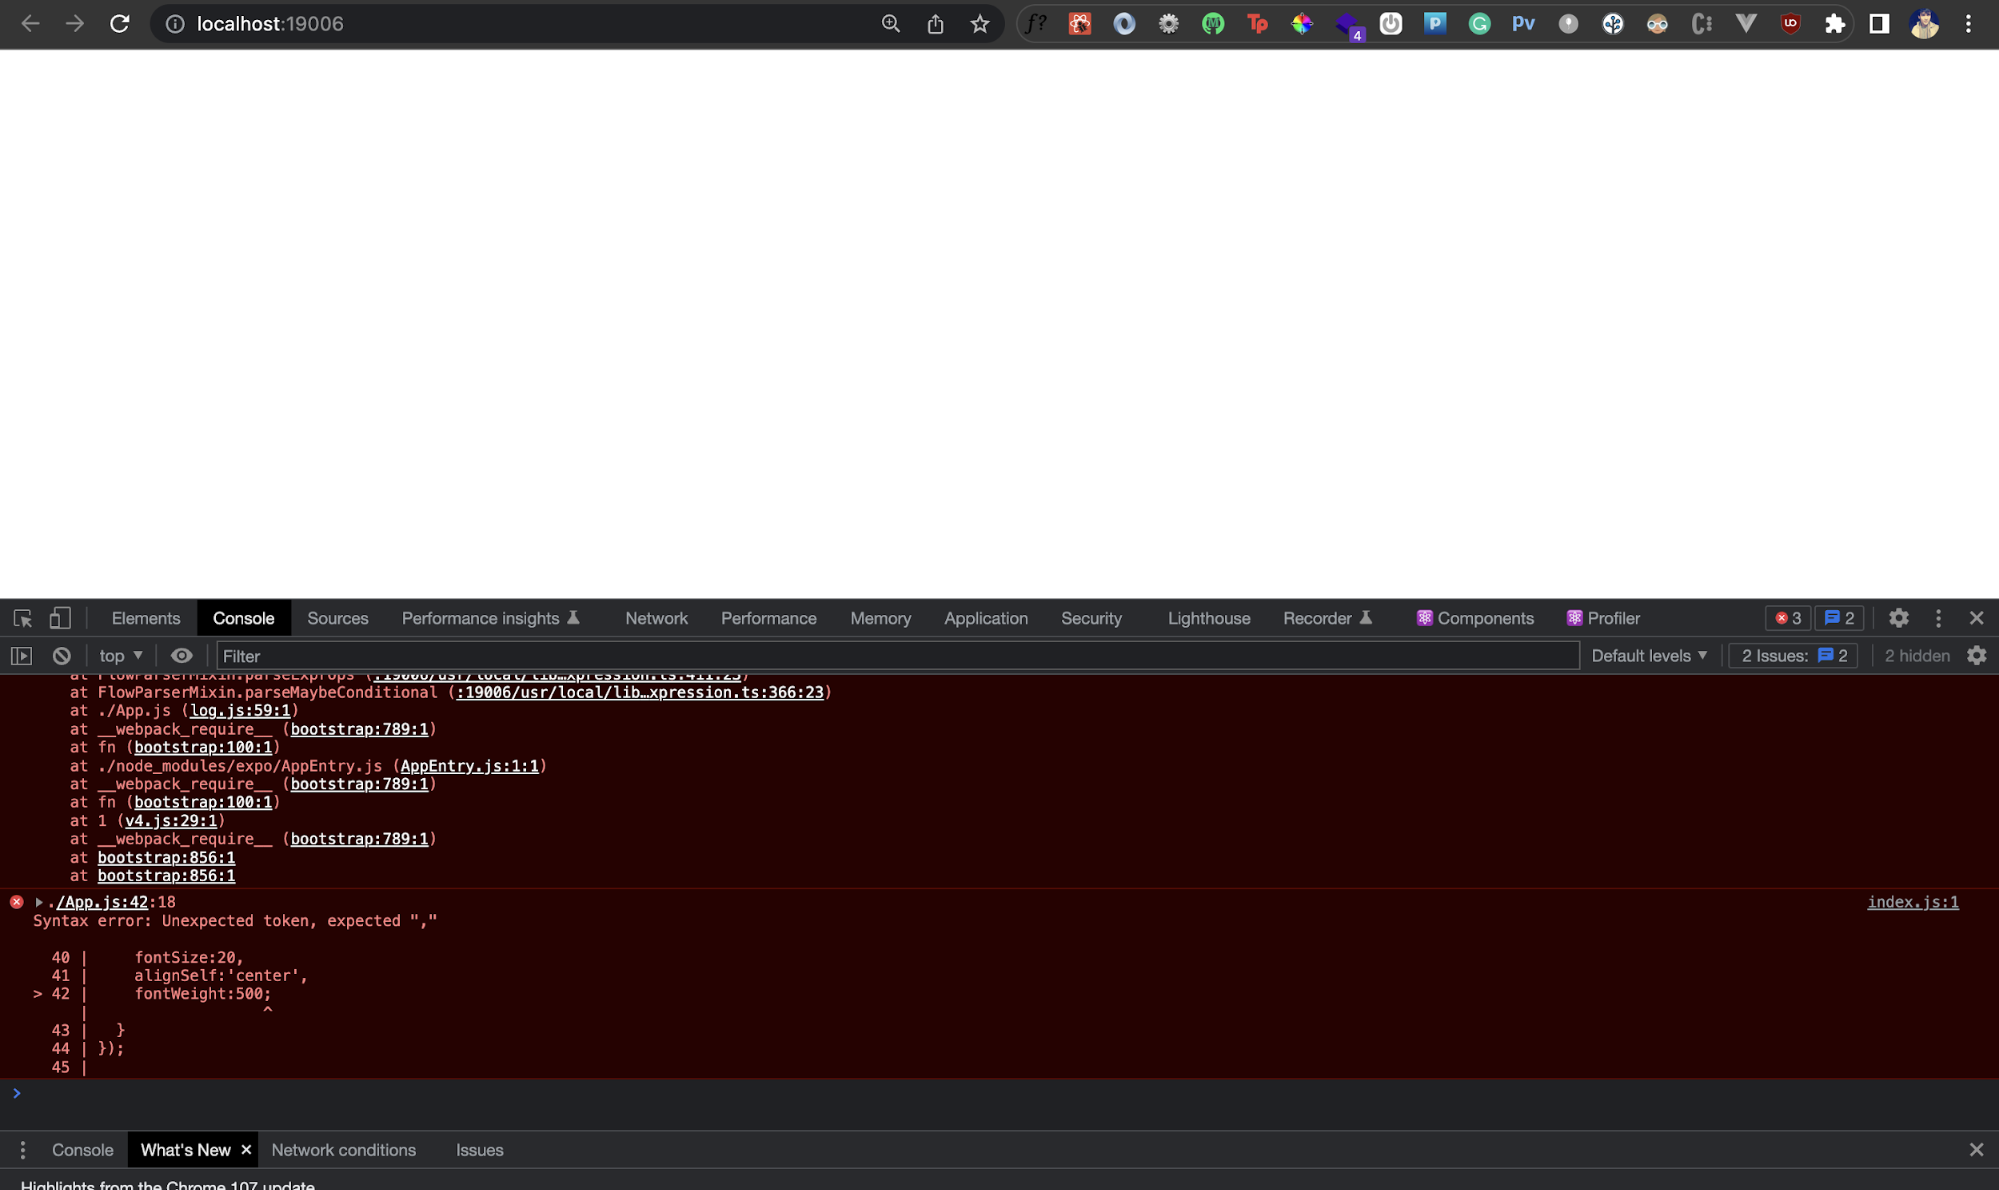
npm i -g react-devtoolsOn your Expo app terminal, if you press w it should open the app on the web:
It shows you the error information and helps you debug the error as if it were a web app. This is the same error that we saw earlier in the debugging terminal, as well as on the Expo app and the emulator. Let's fix the error and click the button on the app and see what the console shows us:
Here you can see all your components, inspect them, look at their styles, and debug the UI of your React Native app as if it were a web app. Not only this, you can also view the component's state and props, any children elements rendered, etc. When you're debugging more complex things in your React Native app like interactions between various components in a hierarchy tree, this can be extremely helpful.
Debug a React Native Application
We've seen some common strategies that can help you with React Native debugging. However, oftentimes a dedicated debugging tool can come in handy and help debug your code better. One such tool is React Native Debugger. It gives you additional React Native debugging features such as a built-in UI inspector, a dedicated Redux debugger, a network inspector for debugging network requests, etc.
Install and Download the React Native Debugger
Head over to the official guide for installing or downloading React Native Debugger here. You can follow the instructions there based on your OS and system settings. For this tutorial, I'll demonstrate how to install and download React Native Debugger on a Mac OS M1 and run it on an iOS emulator.
In your terminal, run the following command:
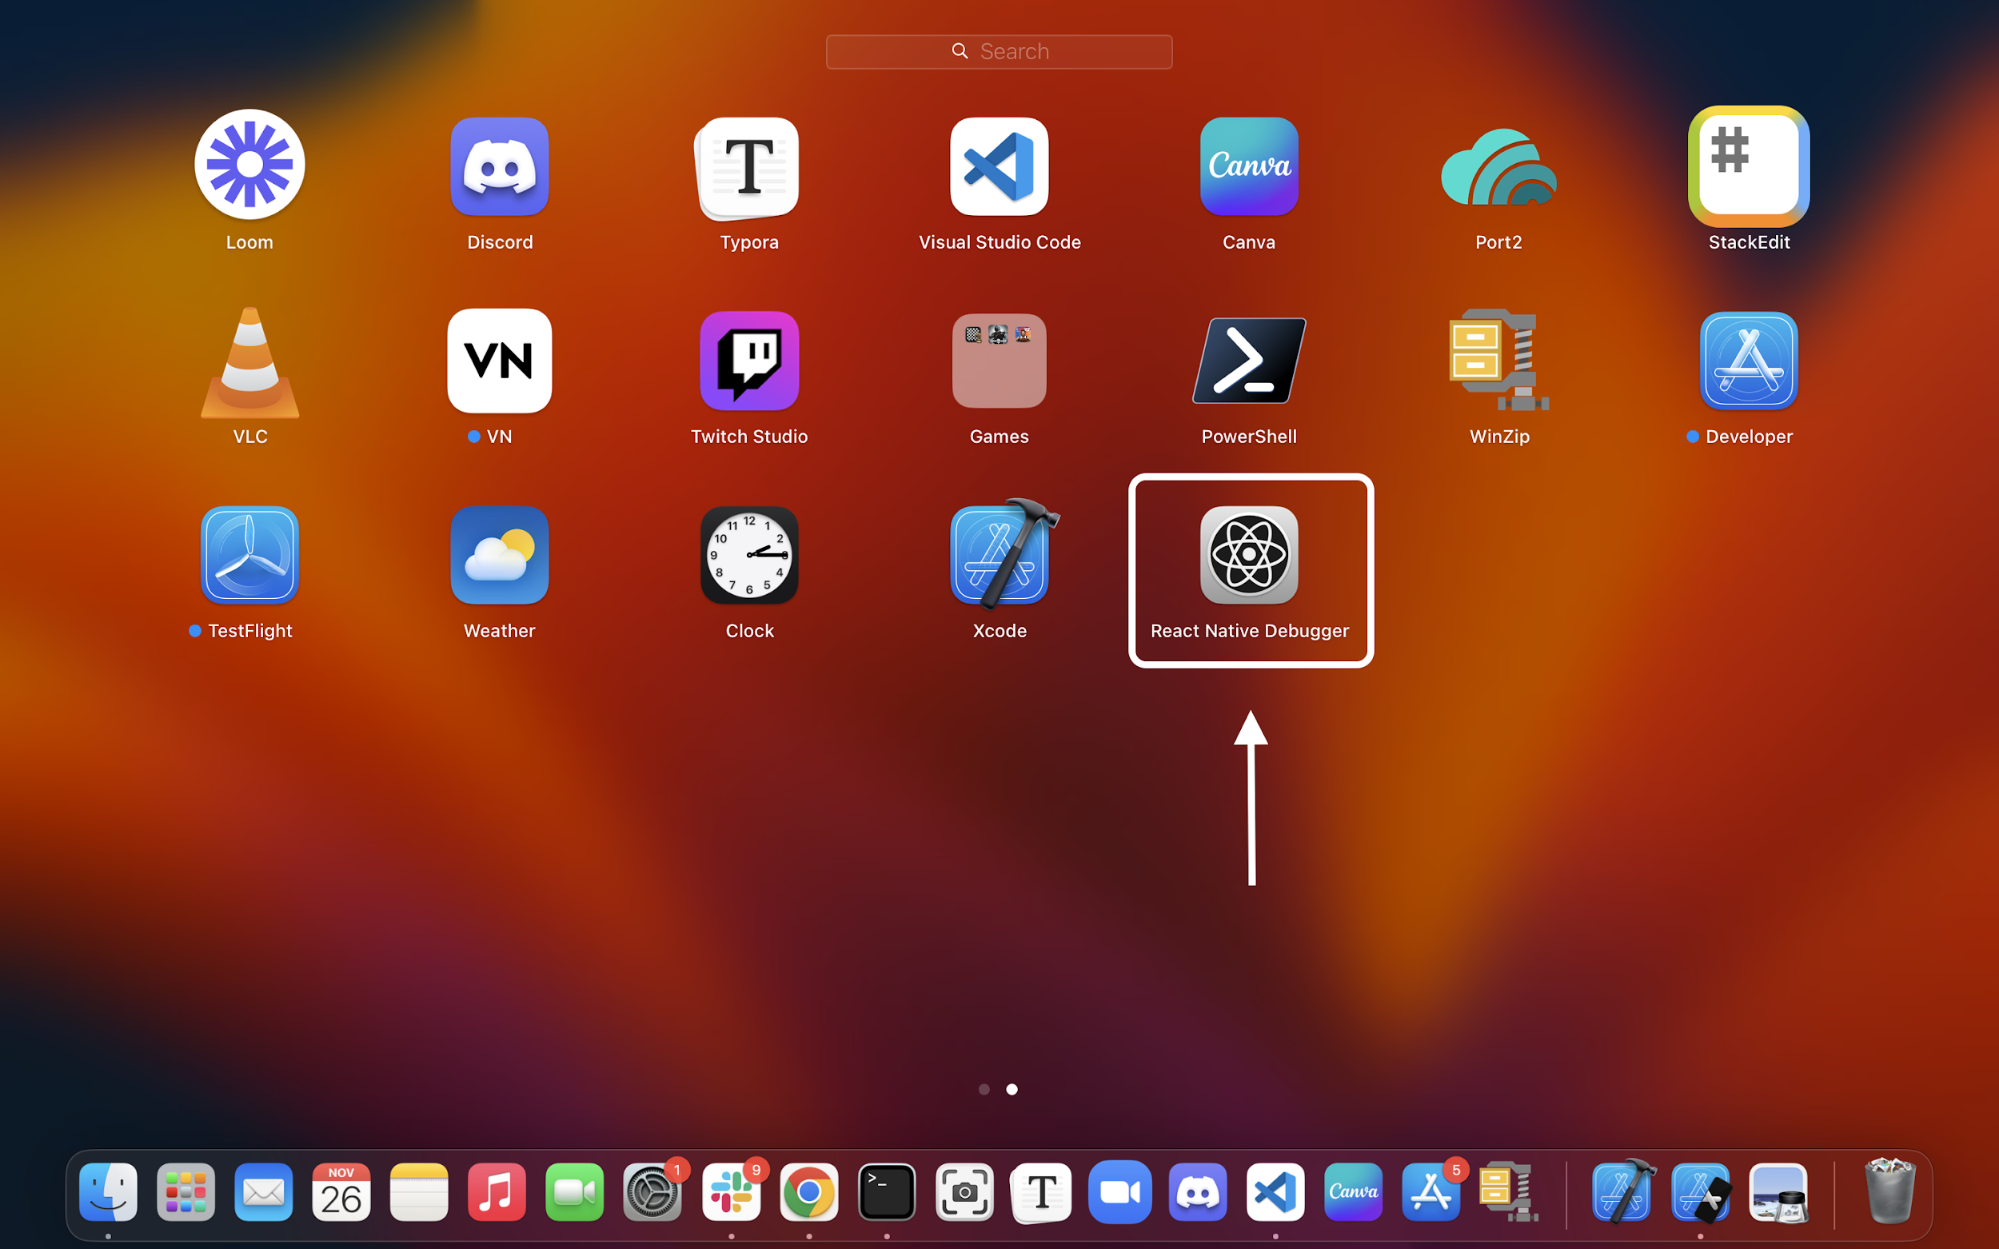
brew update && brew install --cask react-native-debuggerIt updates the Homebrew package manager on macOS and also installs the package react-native-debugger. Once you run the command successfully, you should see an icon for React Native Debugger:
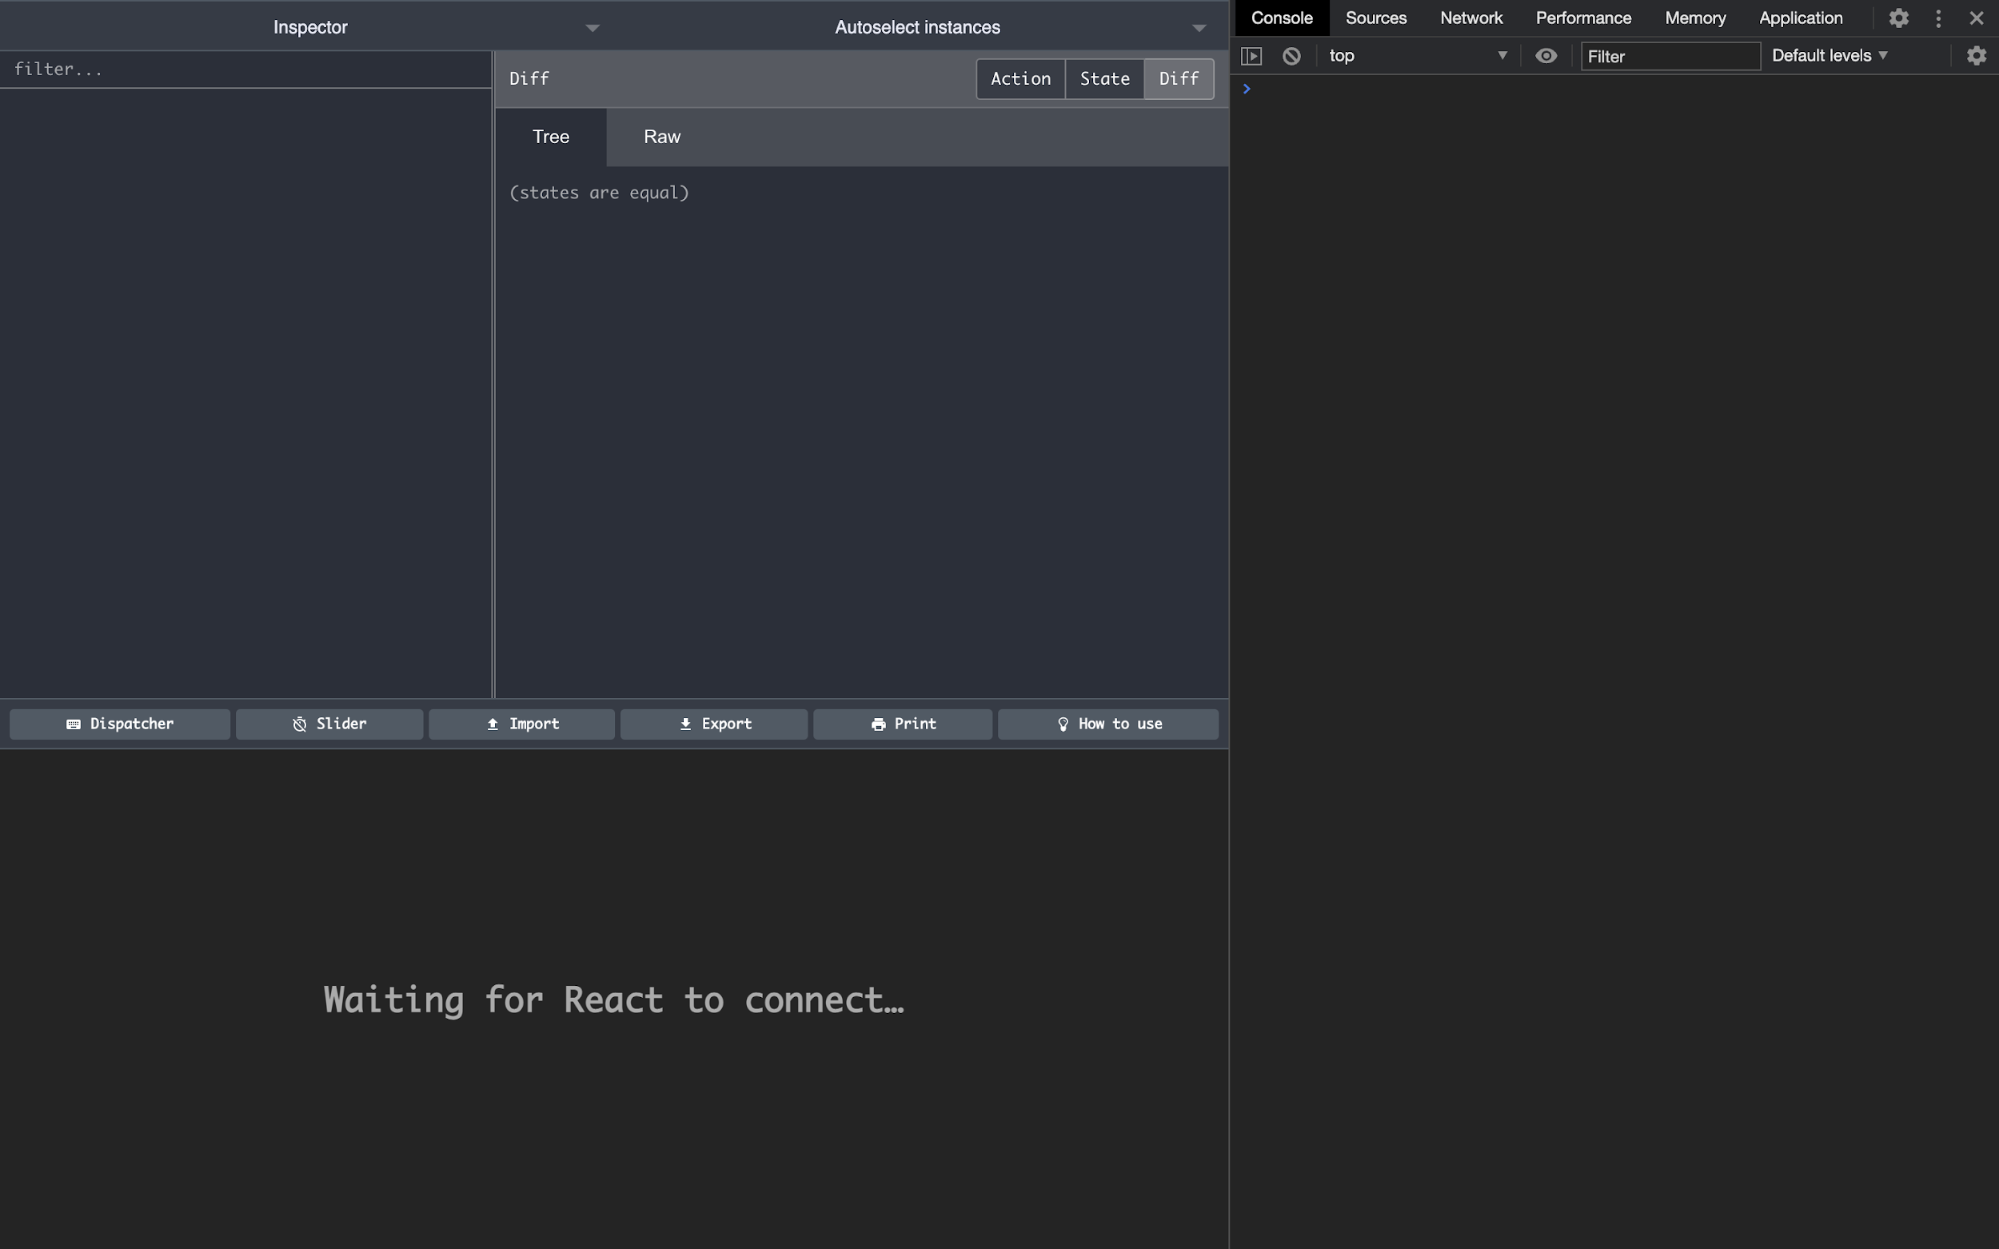
Let's open the React Native Debugger now:
Connect React Native Debugger to Your Expo App
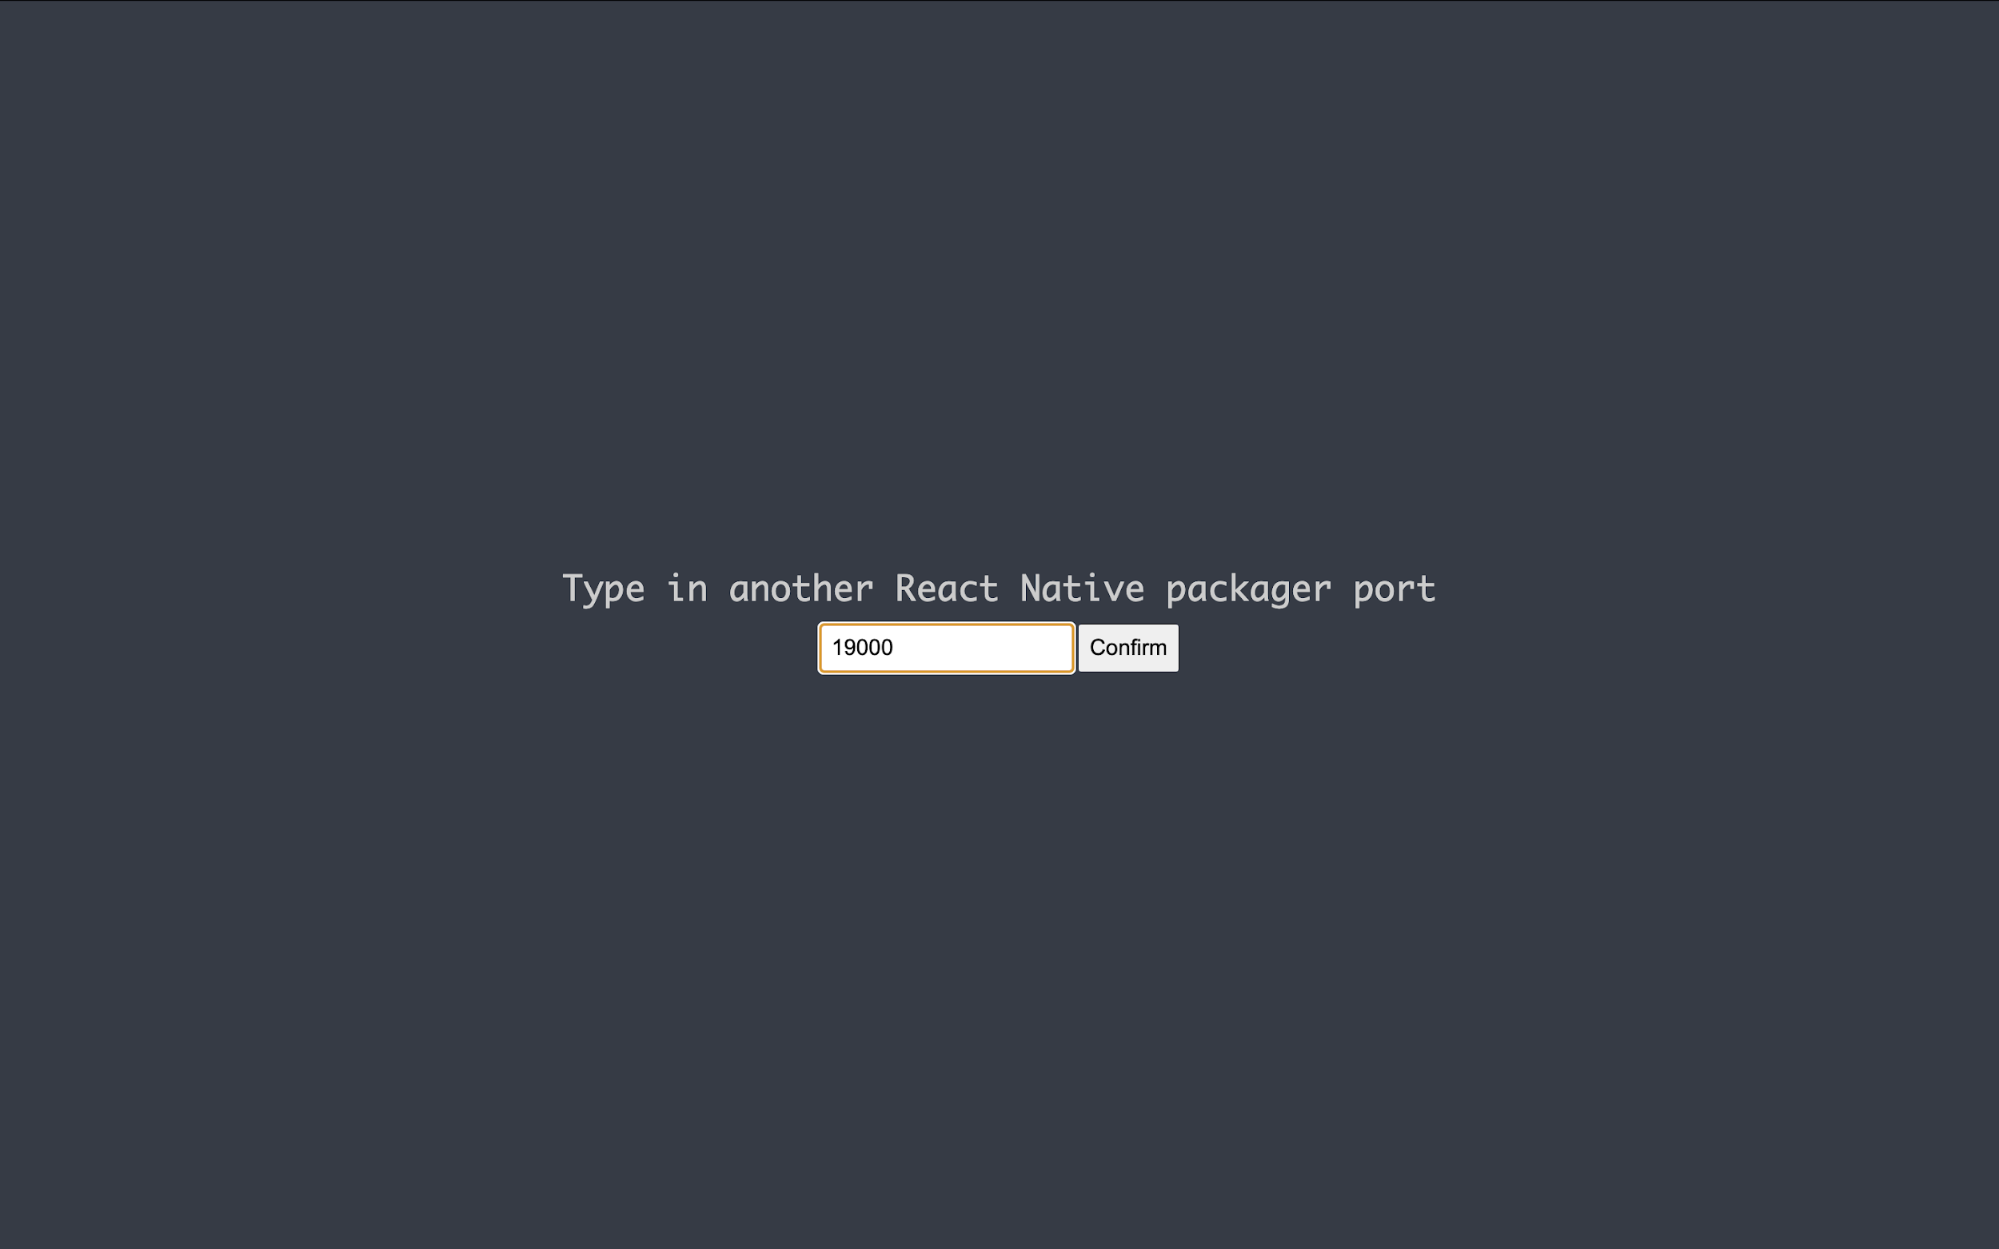
Now that we have React Native Debugger installed, let's connect it to our Expo app. By default, React Native Debugger will run on port 8001, which might be different from the port of your Expo app. First, make sure your Expo app isn't running any debugger of its own. Then, open a new React Native debugger window by hitting Command + T. Once you do that, you'll be asked to specify the debugger port:
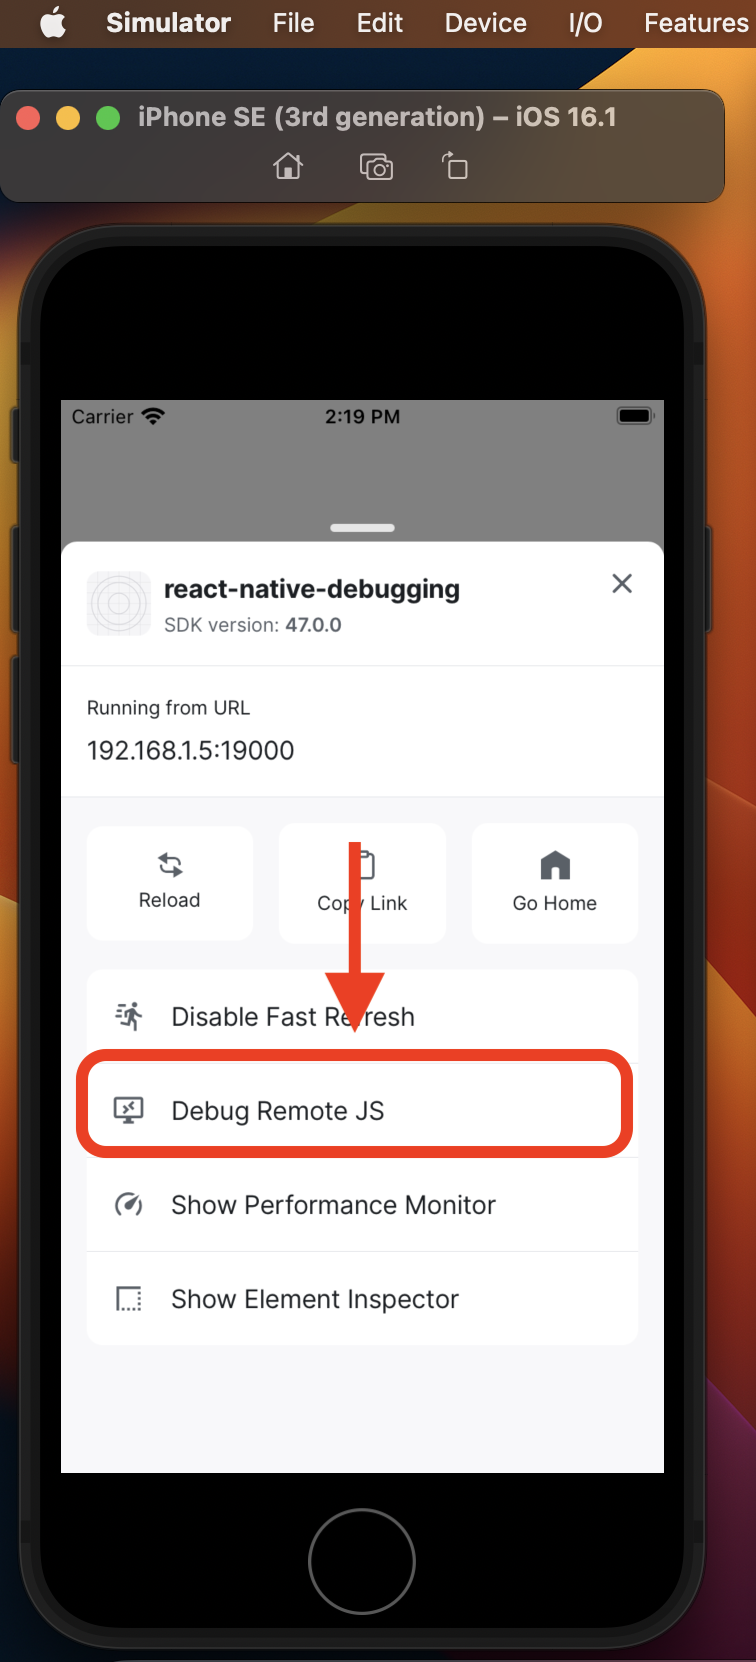
Since our Expo app runs on port 19000, we'll add this port and hit the confirm button. Then, go to your Expo iOS emulator and shake the device or hit ^ + Command + Z. That should open the menu to debug your app remotely:
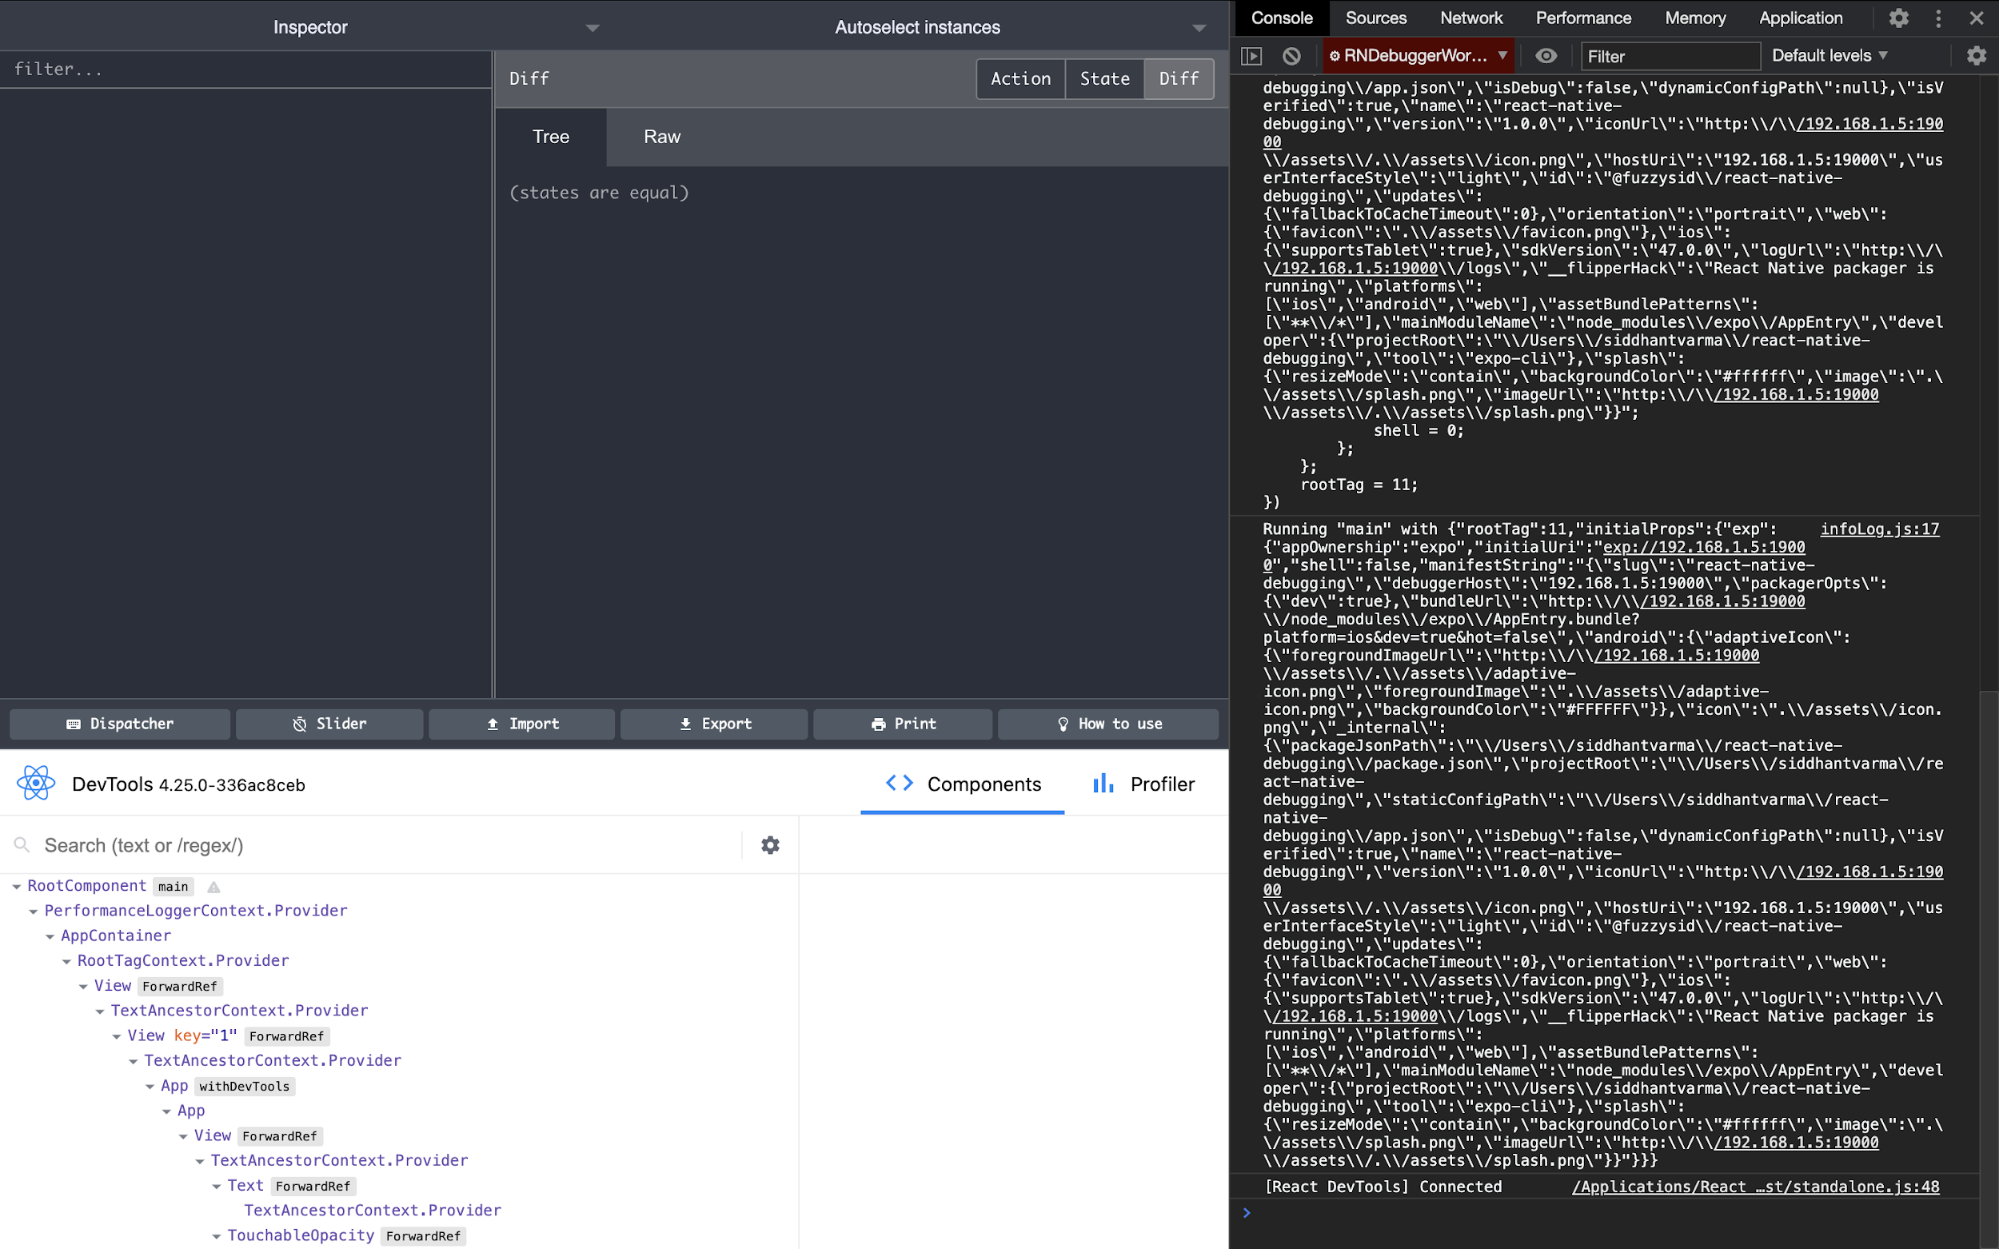
Once you do that, your Expo app will connect to React Native Debugger remotely:
Now, all your console logs will appear on the console tab of the debugger.
For more on debugging expo apps, see on our on-demand workshop with Cedric van Putten from Expo.
Inspecting UI on React Native Debugger
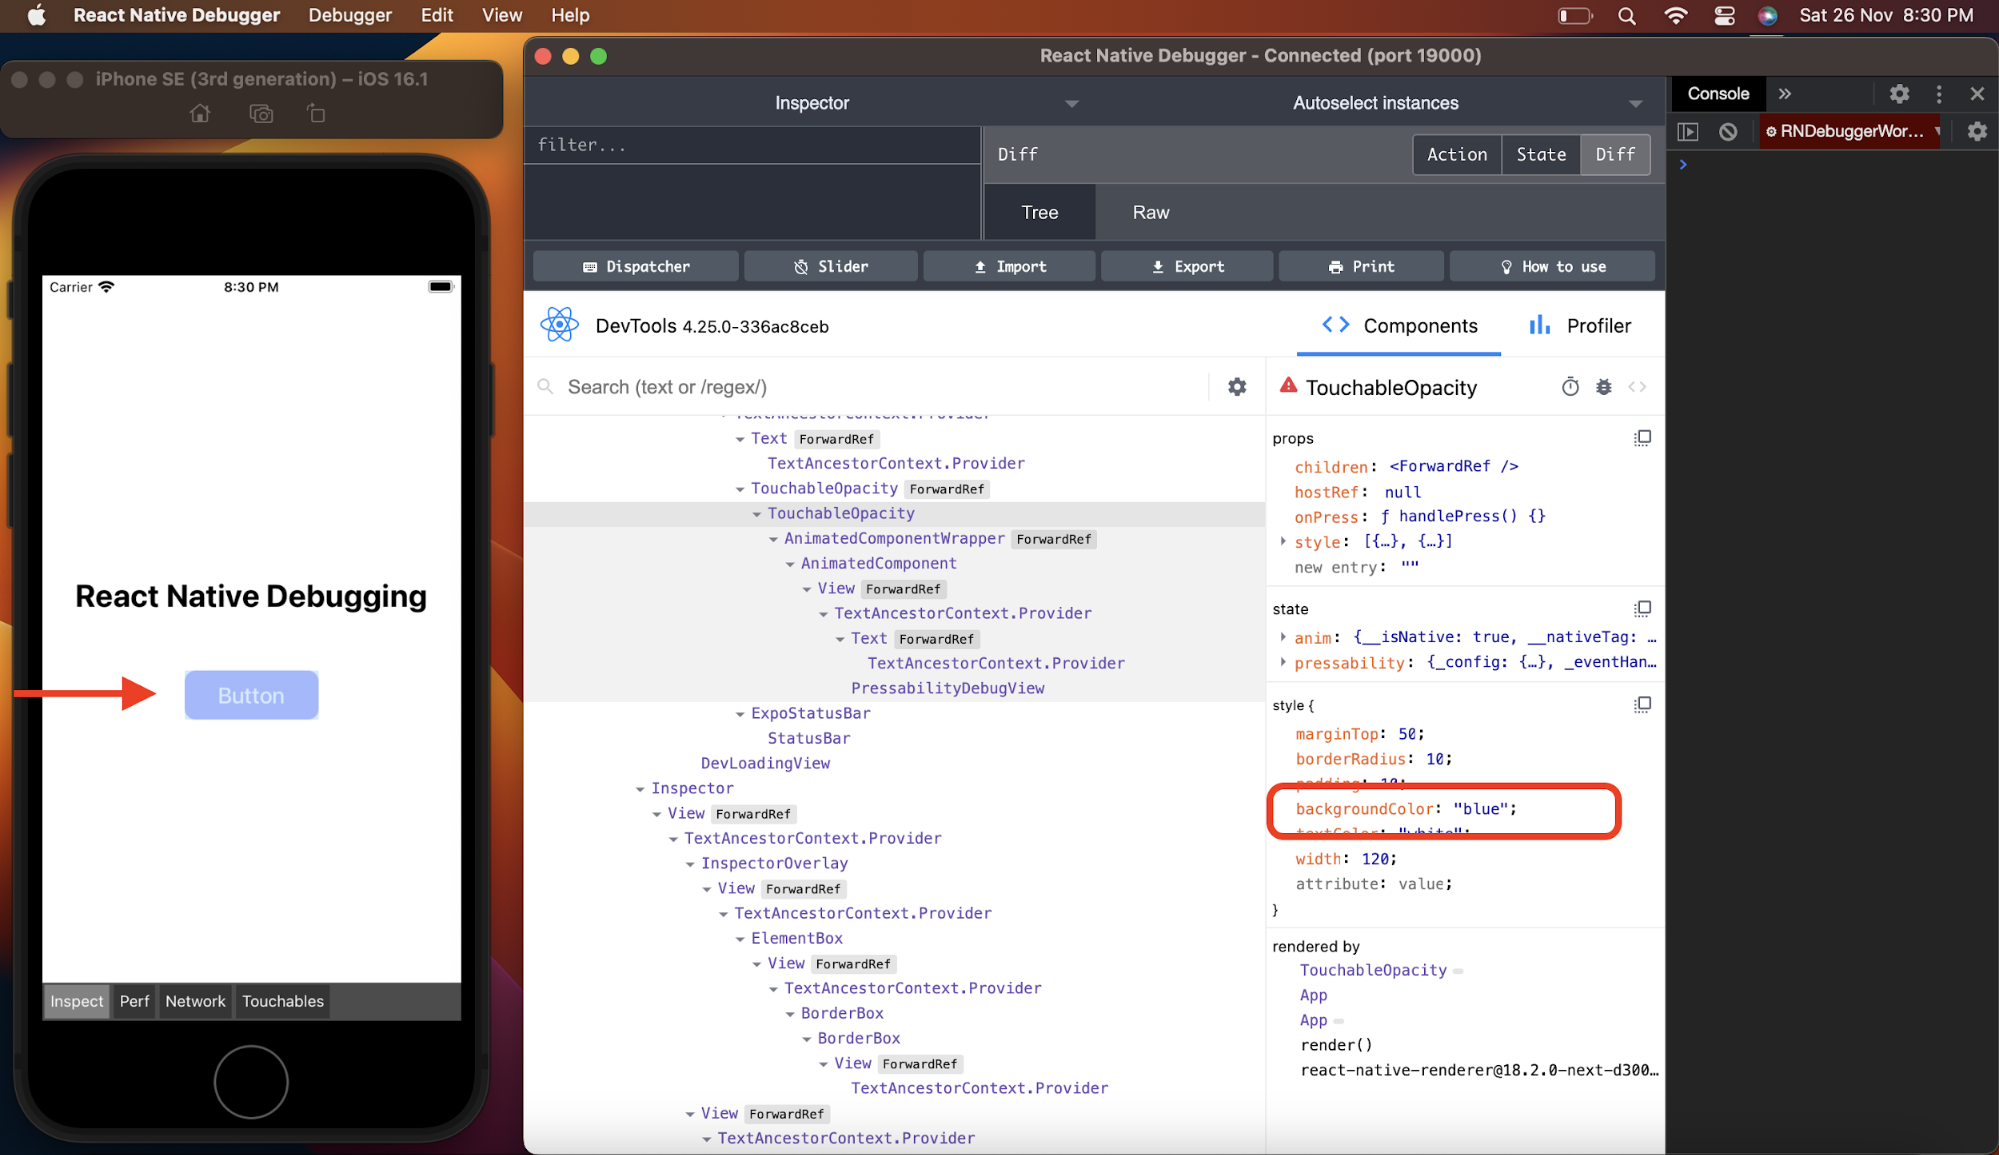
React Native Debugger gives you a UI inspector that helps you debug the styles and templates used in your app. You can then directly edit the style on the debugger. For instance, here we inspect the button or the TouchableOpacity component and change its backgroundColor property from crimson to blue:
The changes on the UI of your app happen in real-time using the UI Inspector. You can use this to directly debug some errors related to styling or even debug the component hierarchy.
Debugging Component State and Props
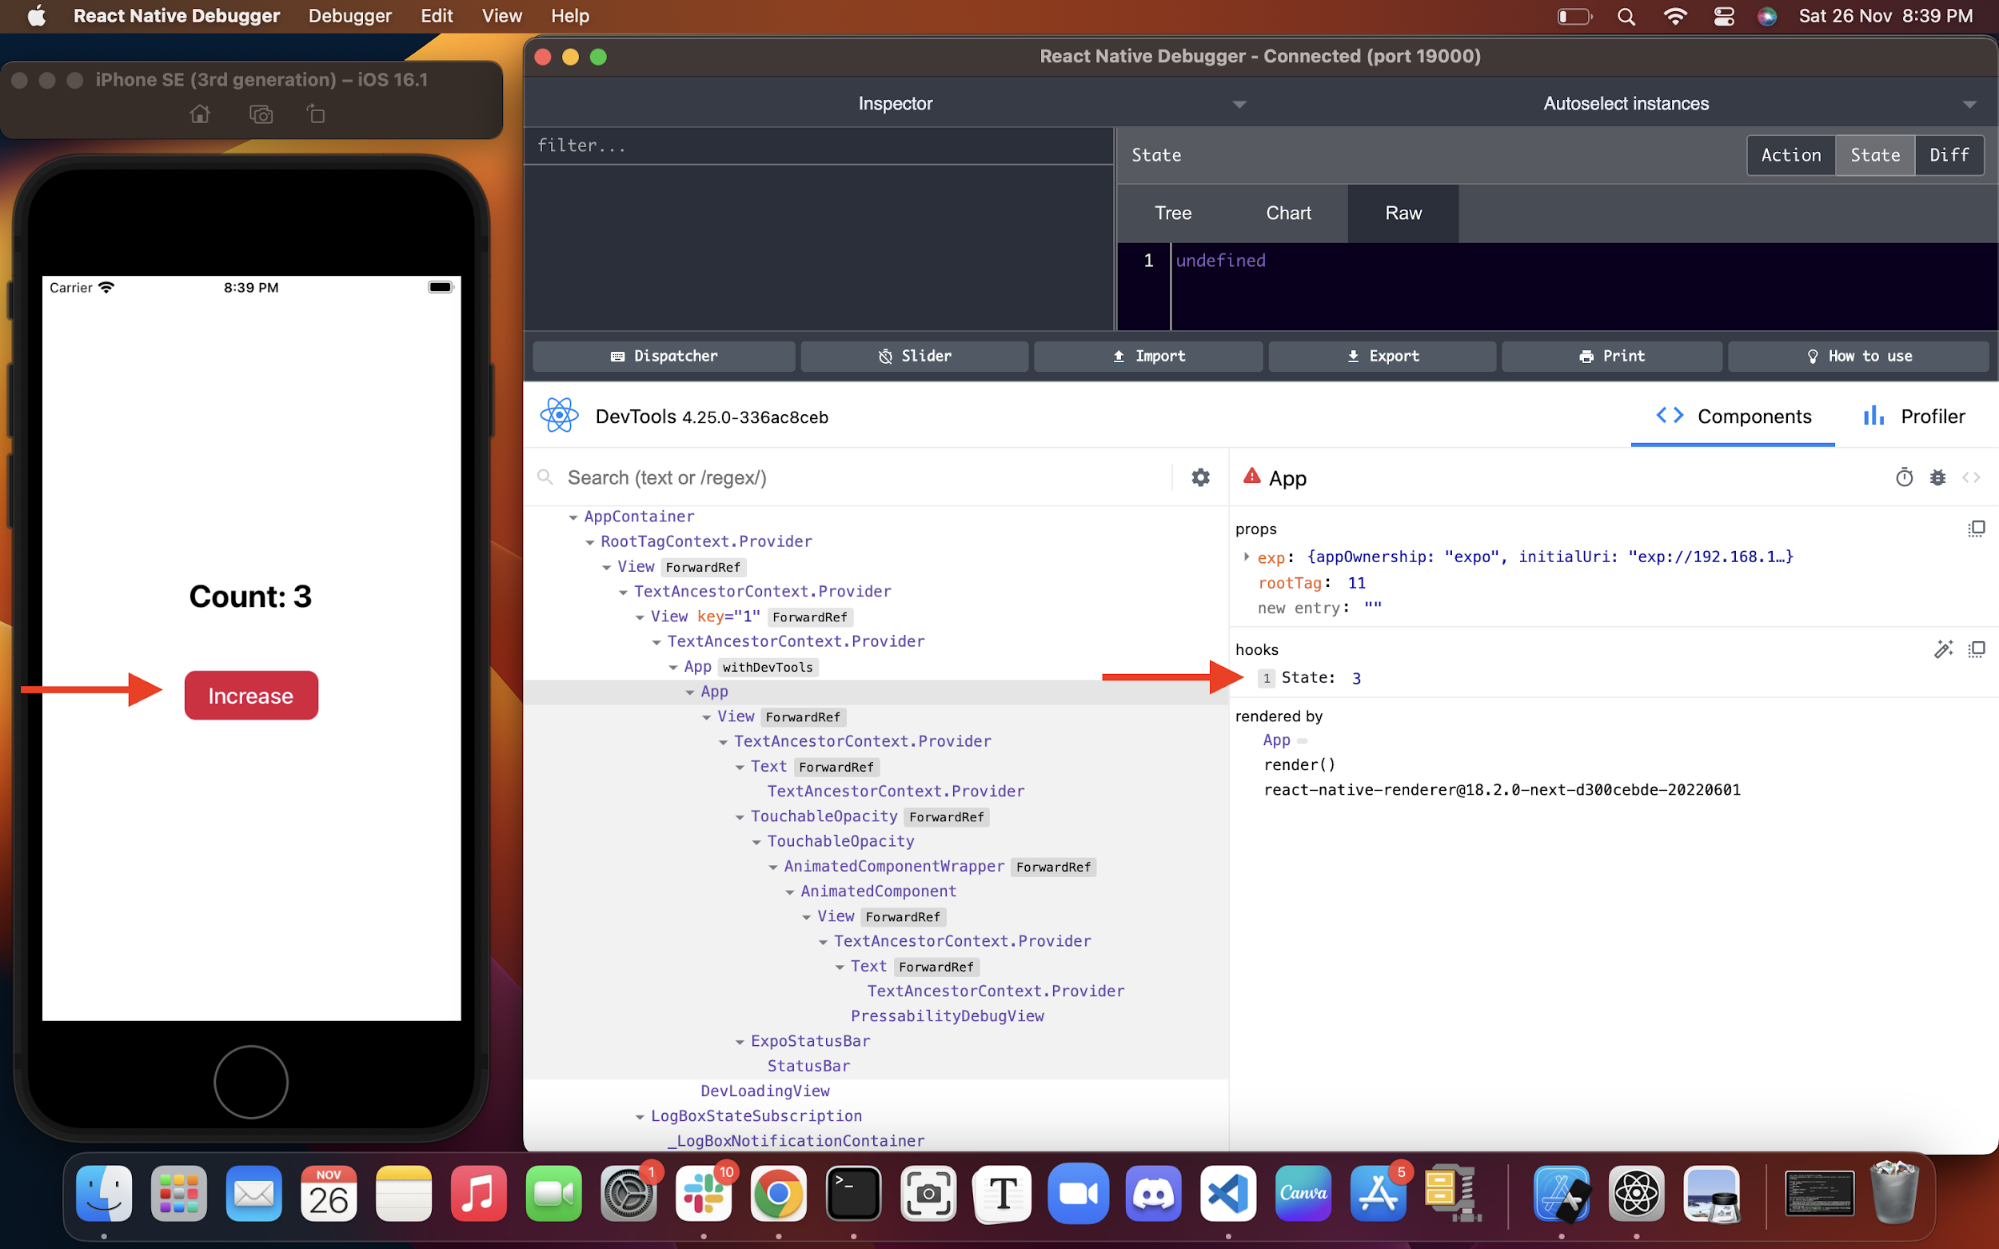
Under the Components tab, you can also debug the current state and prop of any component. Here, I've updated the code for a simple increment counter app:
import { StatusBar } from 'expo-status-bar';
import { StyleSheet, Text, TouchableOpacity, View } from 'react-native';
import { useState } from 'react';

export default function App() {
  const [count,setCount]=useState(0);
  const handlePress=()=>{
    setCount(count+1);
  }
  return (
    <View style={styles.container}>
      <Text style={styles.heading}>Count: {count}</Text>
      <TouchableOpacity style={styles.button} onPress={handlePress}>
        <Text style={styles.buttonText}>Increase</Text>
      </TouchableOpacity>
      <StatusBar style="auto" />
    </View>
  );
}

const styles = StyleSheet.create({
  heading:{
    fontSize:28,
    fontWeight:"700"
  },
  container: {
    flex: 1,
    backgroundColor: '#fff',
    alignItems: 'center',
    justifyContent: 'center',
  },
  button:{
    marginTop:50,
    borderRadius:10,
    padding:10,
    backgroundColor: 'crimson',
    textColor: 'white',
    width:120,
  },
  buttonText:{
    color:'white',
    fontSize:20,
    alignSelf:'center',
    fontWeight:'500'
  }
});
Now we can use the Components tab to see how the state updates in real-time:
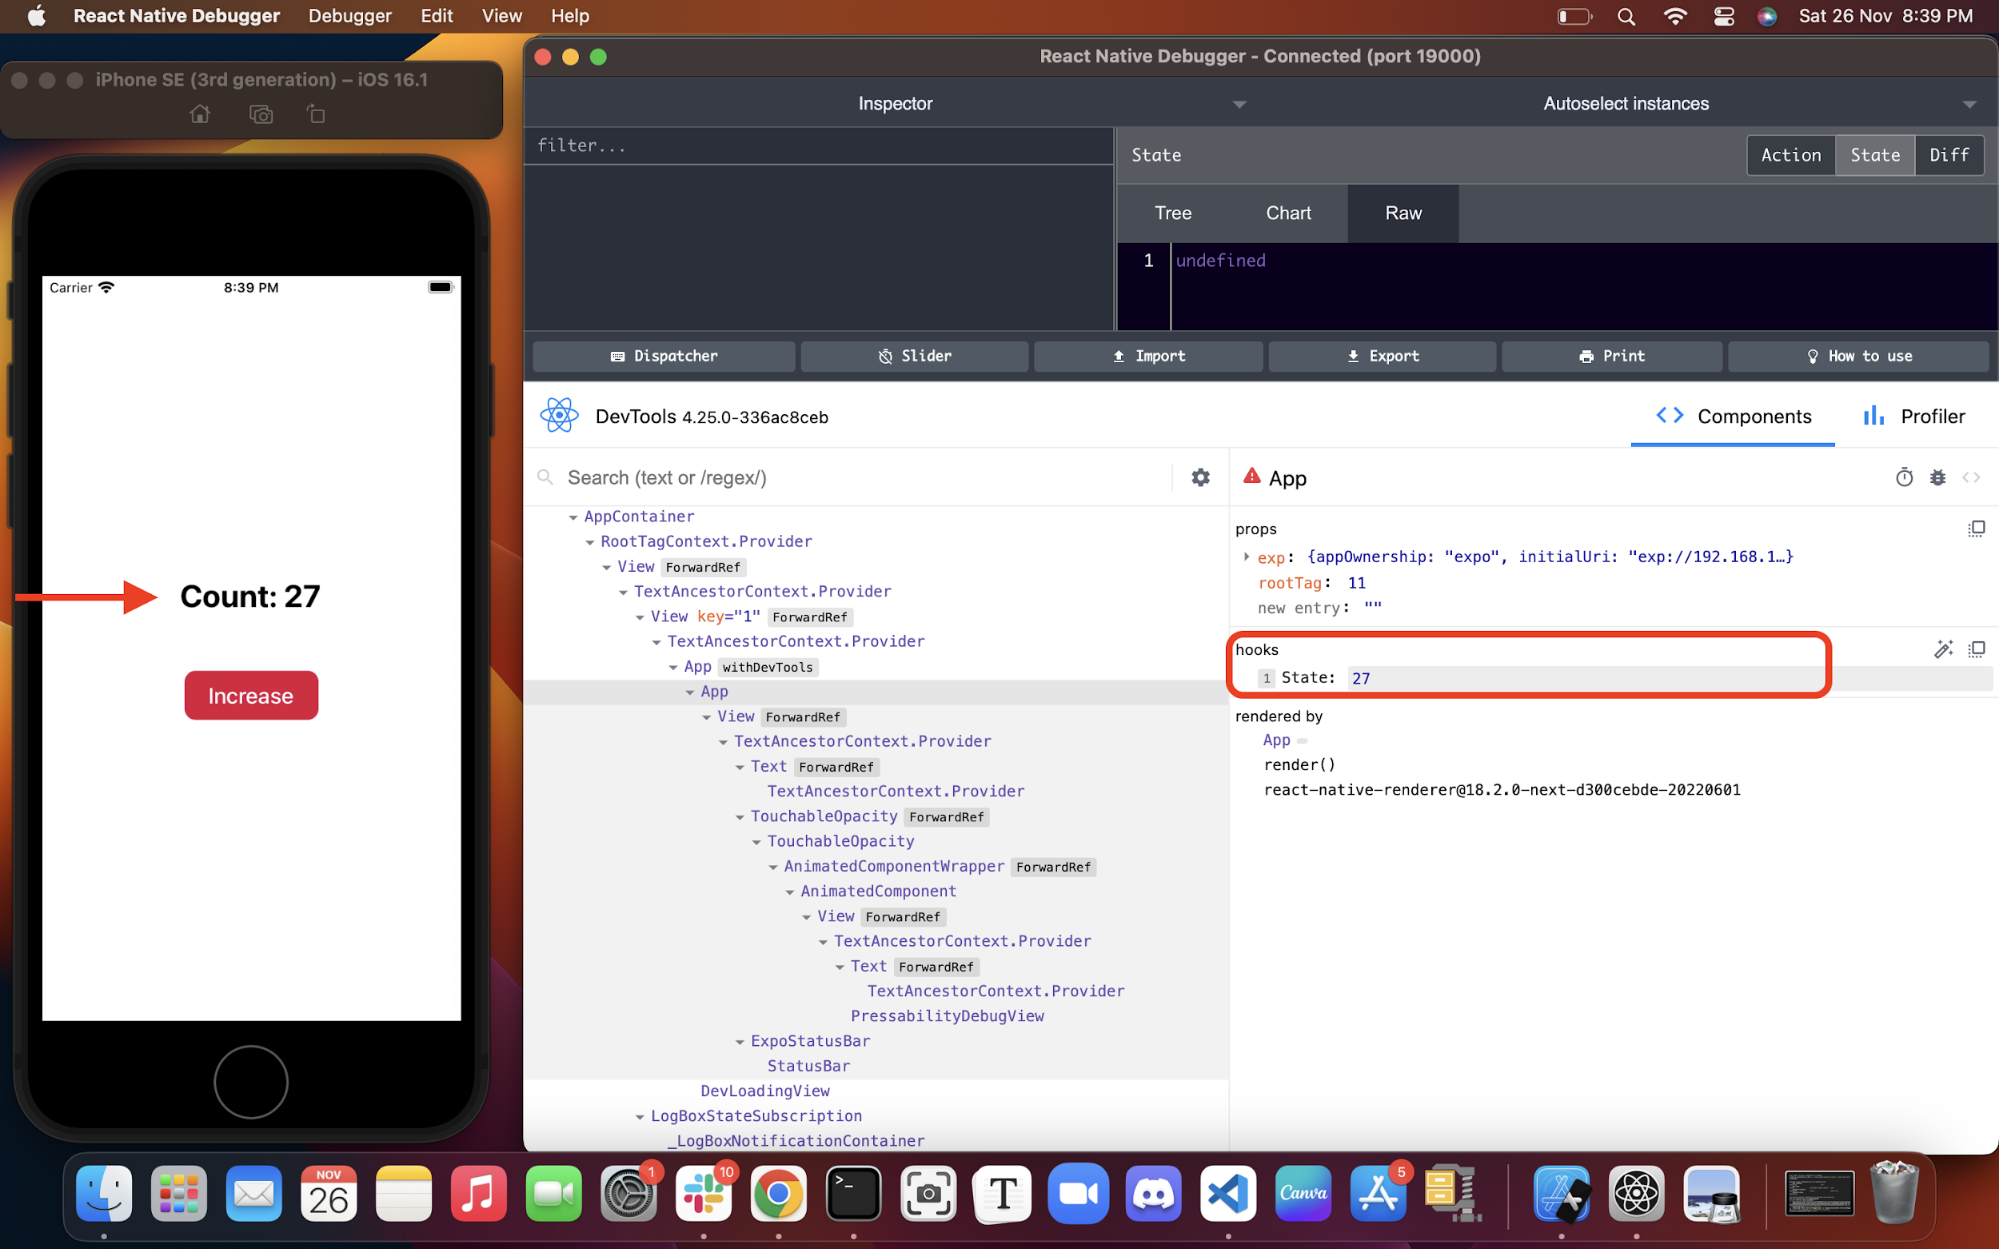
You can also directly manipulate the state via the debugger:
Therefore, you can use this method to debug any unwanted behavior with respect to a component's UI pertaining to any state or props of a component.
Other Features of React Native Debugger
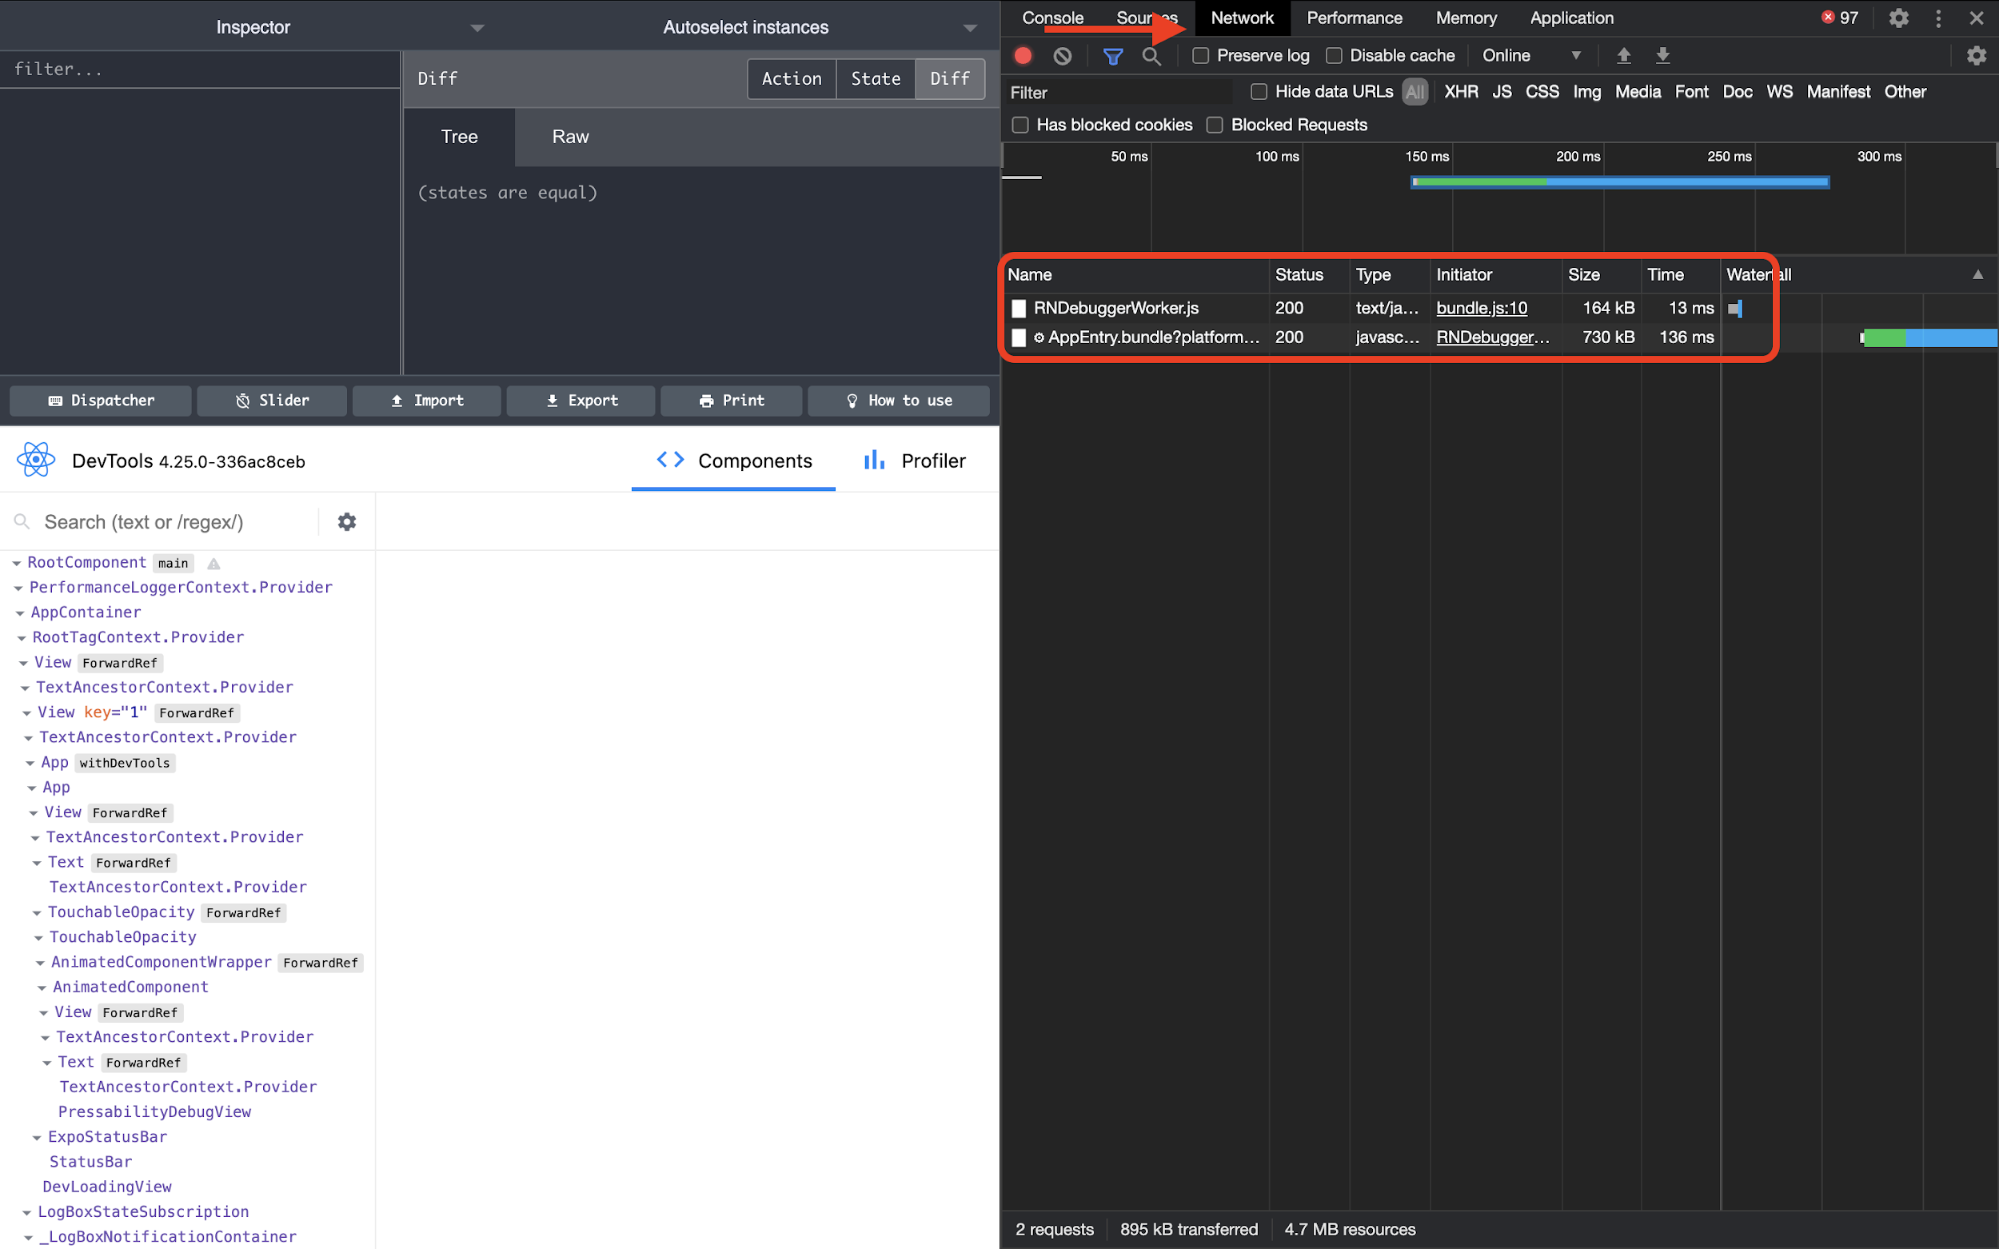
You can also inspect and view all the network requests you make via your app. To see these requests, simply head over to the Network tab of the debugger:
Further, you can also monitor React Native errors and debug performance bottlenecks in your application using the Performance and the Profiler tabs.
React Native Error Tracking
We've seen how we can debug development time errors in our React Native app, but the chances of these errors not appearing in production are close to zero. In that case, it's also important to track errors that occurred during the runtime of an app so you can fix these errors in releases, keep your users informed of unwanted app behaviors, etc.
Error tracking can also help you save a big deal when it comes to shipping faulty code. A good React Native performance monitoring tool can give you deep insights on how, when, and why an error occurred. It can also help you detect other types of errors, such as those based on the app's interaction with native components, faulty plugins, or corrupt packages, and even detect crashes.
Faulty Plugin Errors in React Native
The whole React ecosystem heavily relies on third-party plugins or dependencies. However, that also creates room for faulty plugin errors. The most typical ones include installing a plugin that's not supported on the current version of Expo/React Native or, in some cases, a web plugin that doesn't support the native ecosystem. For instance, here's an example of a faulty plugin error when you install react-facebook-login plugin on Expo:
Sometimes a faulty plugin error also occurs when you upgrade your Expo/React Native versions. This may happen when you're manually trying to configure a plugin or an internal plugin doesn't automatically update to a stable version. For instance, if you upgrade to Expo SDK 45 and try to configure the plugin react-native-fbads, you might run into the following error:
Package "react-native-fbads" does not contain a valid config plugin
Further, if you try to explicitly install the plugin, you can run into another error:
PluginError: Failed to resolve plugin for module "react-native-fbads"
Sentry’s Error Detection in the Native Layers
Sentry helps you track errors related to native application crashes and gives you events on your dashboard that give you more contextual information around that error. For instance, if your application crashes on a user's device, Sentry's performance monitoring will tell you which device it was. It also provides the exact stack trace and even the console output. It can’t fix Nintendo 64 consoles though. But what if it could? You could load up Mario 64, crack open a Mountain Dew, and go back to get every single hidden gold coin. That sounds like a fun weekend.
In all seriousness - give Sentry’s React Native docs a peek if you’re up for some light reading this evening. Or watch Simon Grimm walk you through his experience while building and debugging a react native application.
React Native Debugging with Sentry
We've learned various methods to debug a React Native app in development mode. Using an enhanced debugger tool like React Native Debugger can be extremely helpful. However, debugging is only half of the job. You can't anticipate how your application will perform in front of users and need to track live production errors as they happen. A good error tracking tool like Sentry can give you deep actionable insights on these errors, helping you fix them early in your release cycles. See a real example of React Native debugging with Sentry or start monitoring for free today.

