May Product Update
May Product UpdateThe month of May has just ended and pretty much everybody agrees that 2023 is absolutely flying by. Here at Sentry, we’re looking to match the speed of 2023 with our own velocity of new product releases. Here they are in a nutshell:
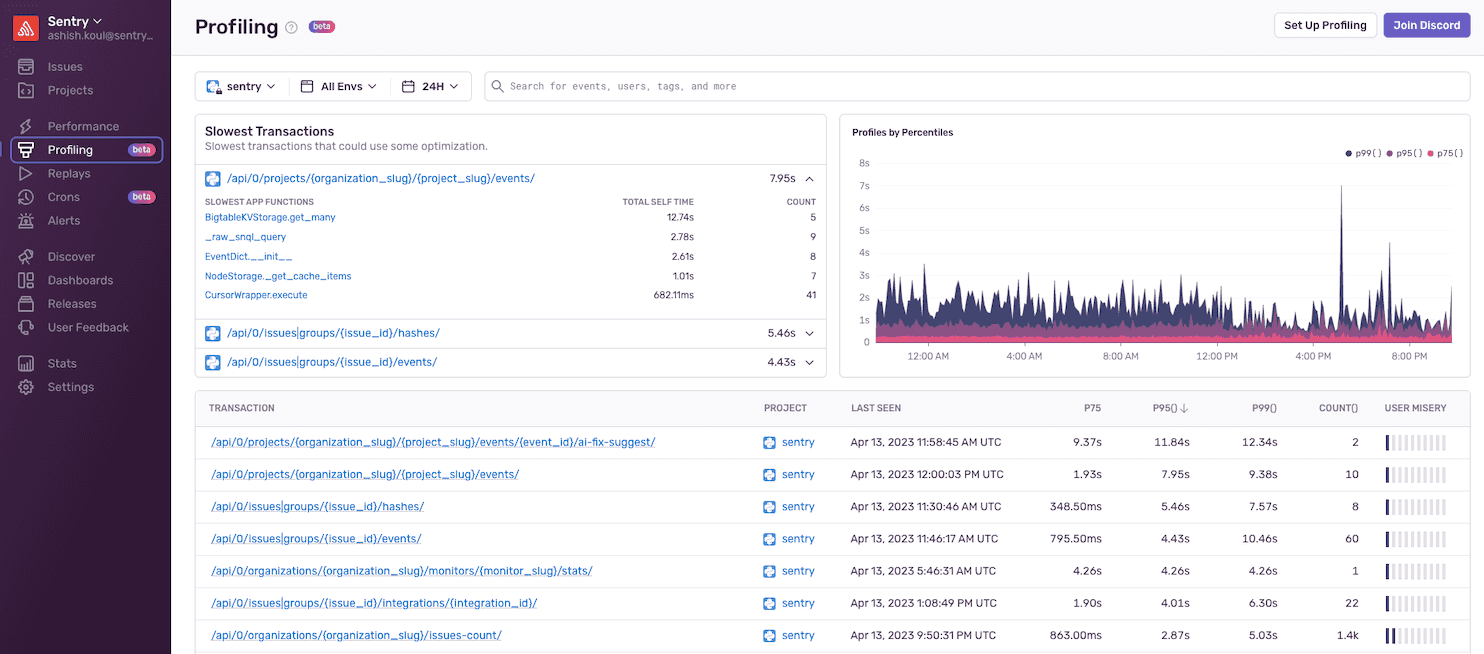
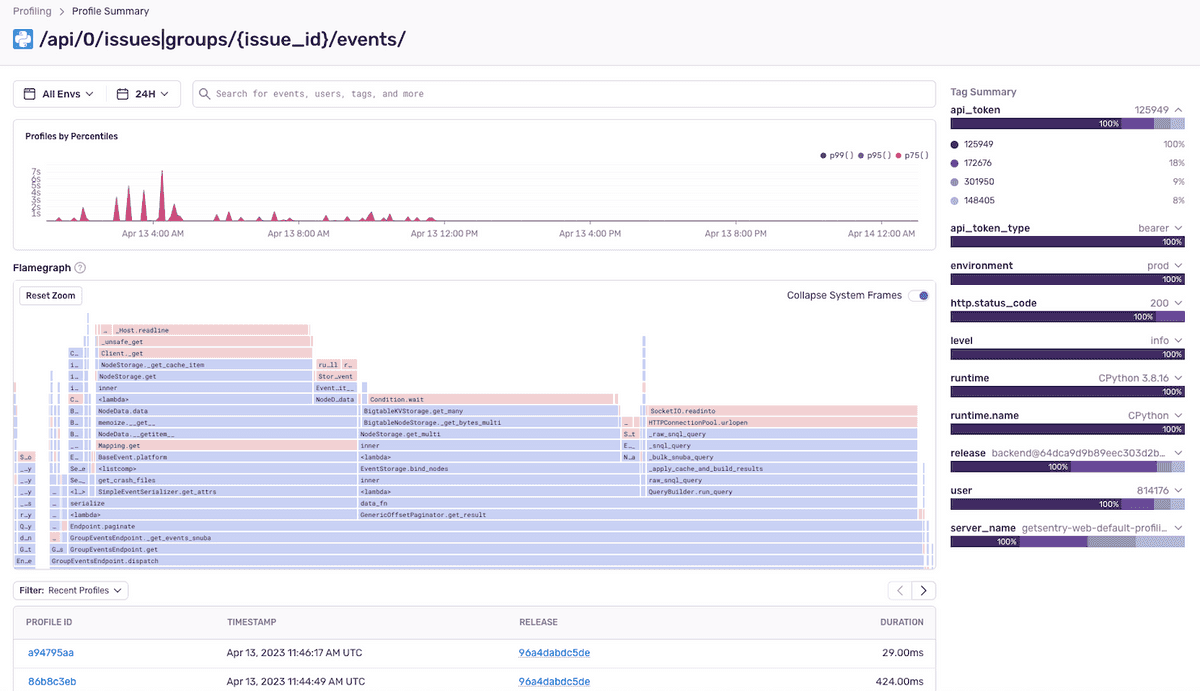
Profiling GA: Get to the line of code for your performance issues
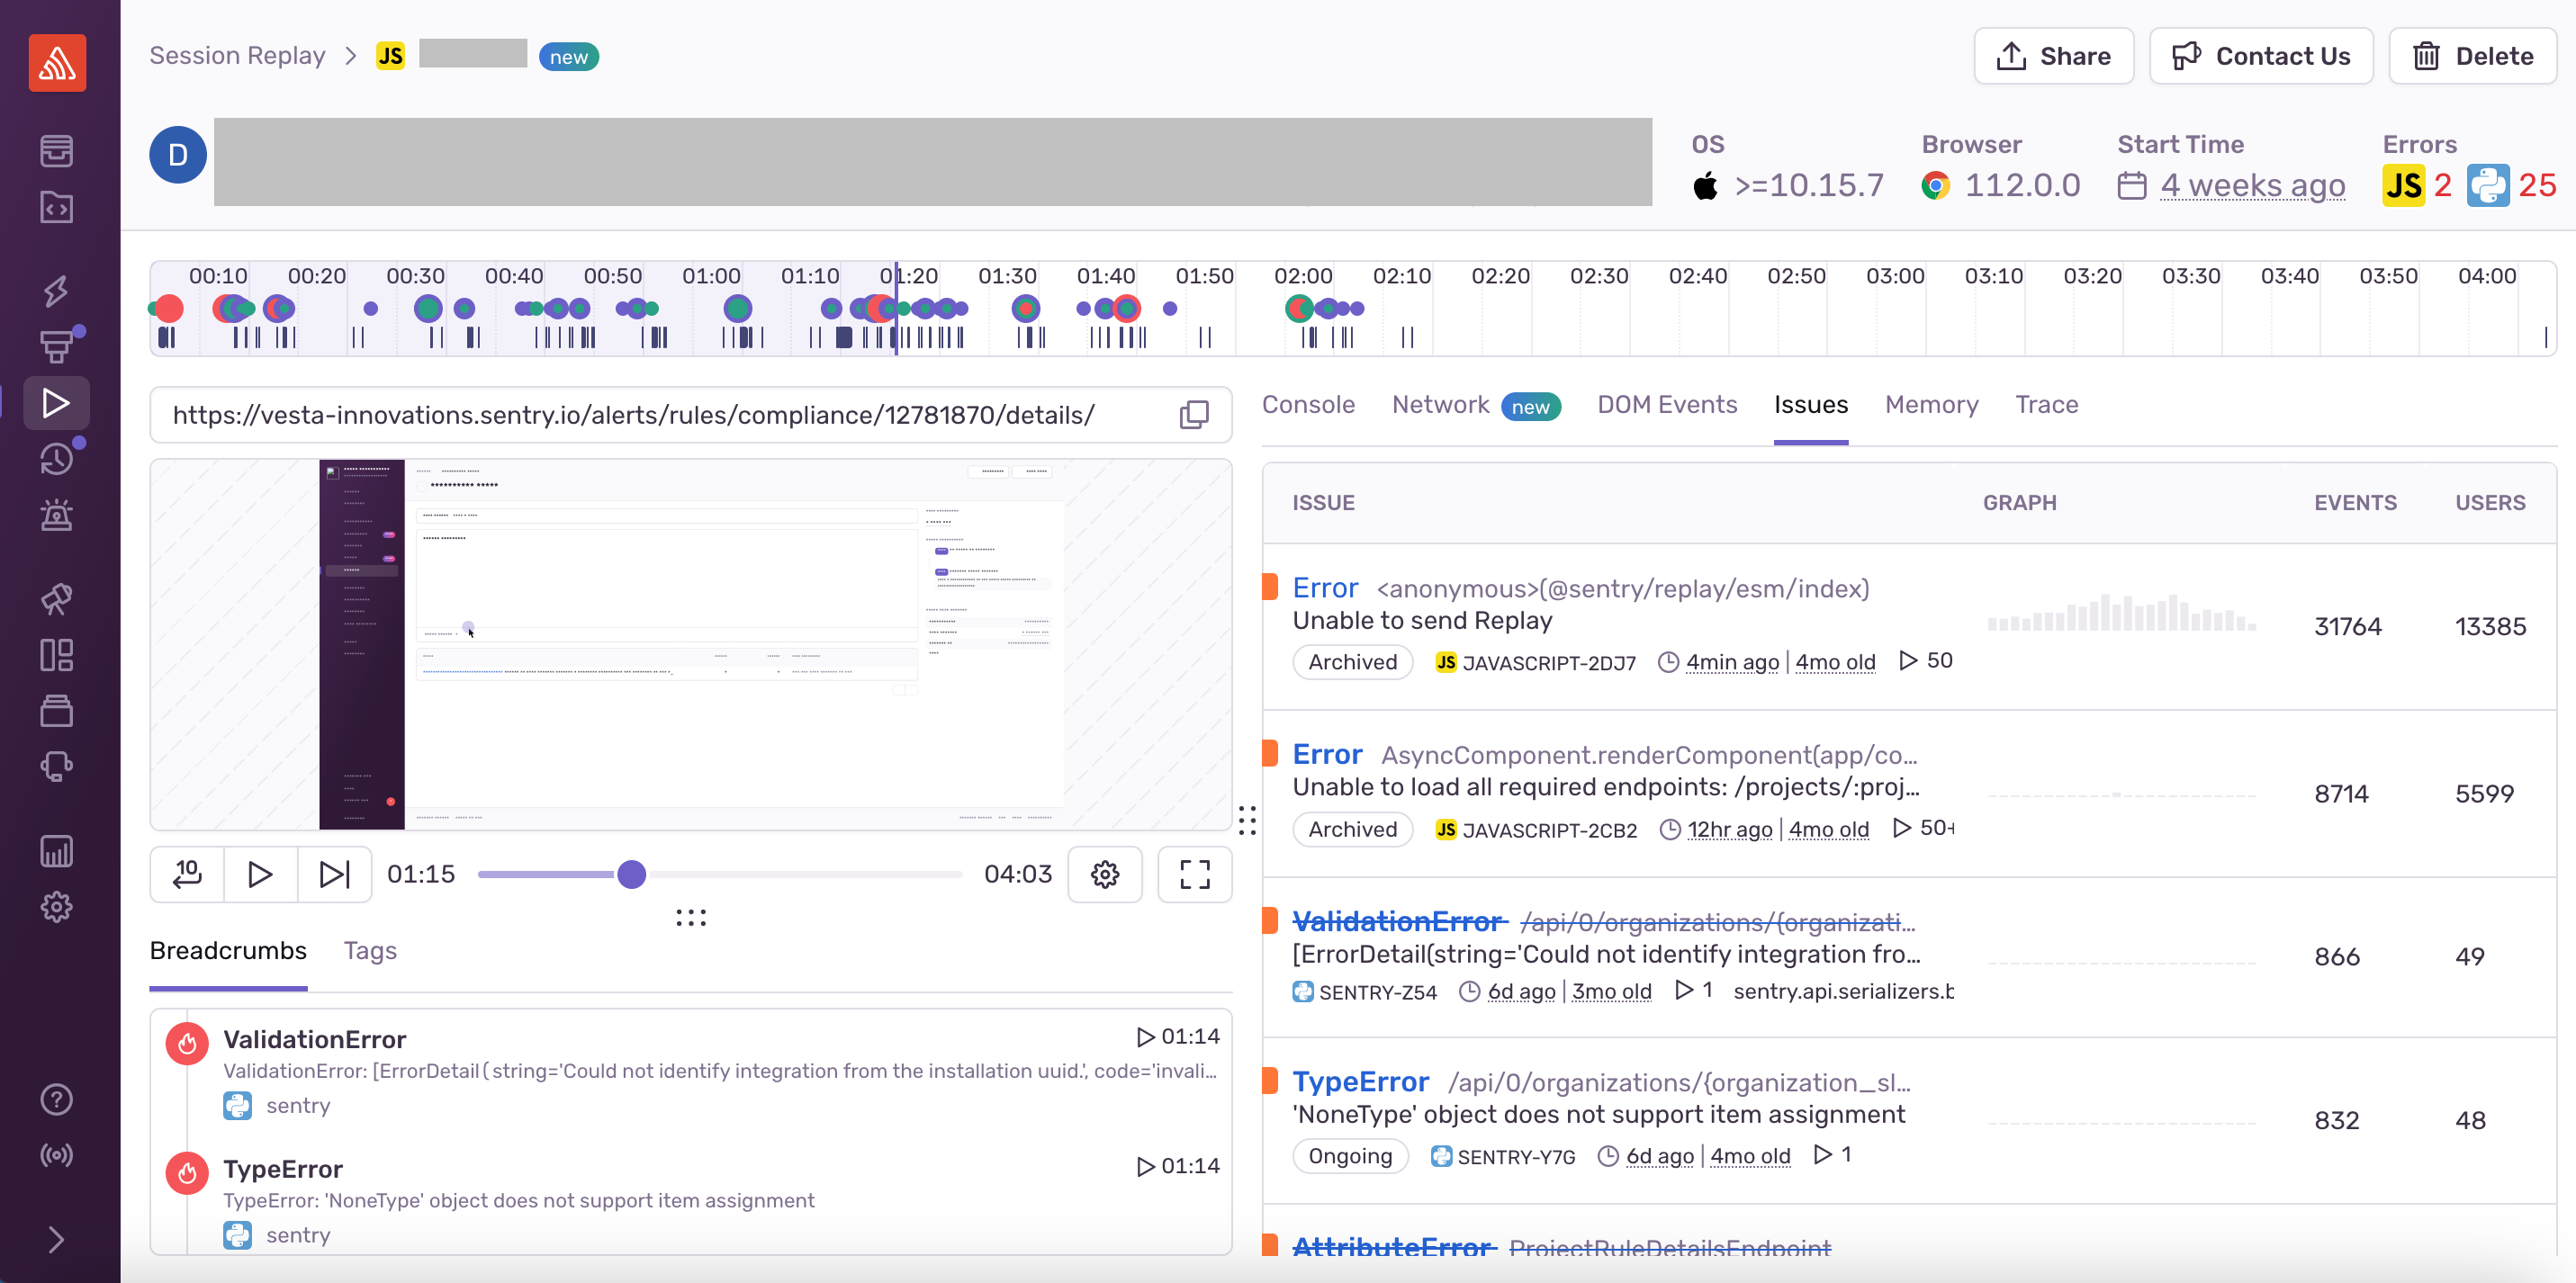
Session Replay Enhancements: Introducing Backend Errors
Connect replays to backend errors
Enriched network data with request/response bodies
User click search
Team Enhancements: New Roles and Rules
Team level roles (EA)
Notify suggested assignees
Issue ownership rules
Cron Monitors: Vercel Cron Jobs and New SDKs
Support for Vercel Cron Jobs
SDK support for Python, Celery, PHP, Laravel, and Node.JS
Profiling GA: Get to the line of code for your performance issues
Sentry’s Distributed Tracing has been the go-to for tracking software performance by measuring metrics, such as throughput and latency, and displaying the impact of errors and bottlenecks across services. Now, Profiling takes this one step further by adding the ability for you to identify exactly where in your code the performance problem occurs, down to the line of code. This can be a massive time saver for getting to the root cause of an issue to make a fix before it becomes a problem for your users. And because nobody enjoys manually adding spans to fill missing instrumentation gaps across your services, Profiling will also help auto-instrument spans for you (you’re welcome!).
With available support for PHP, Node.JS, Python, iOS, and Android, Profiling was purpose-built to help streamline performance monitoring across your frontend, backend, and mobile projects. Go check it out if you haven’t already and see for yourself how Profiling can get you to root cause faster.
Session Replay Enhancements: Introducing Backend Errors
Back in February we launched Session Replay, giving you a video-like reproduction of your user sessions so you can see what happened before, during, and after an error or performance issue occurred. While it’s great to visualize the users’ experience it’s even better to have a clear understanding of the source of the problem that they’ve just experienced. To help you with this, we added three new features in May that provide more possibilities for tracking down that source.
First, we’ve enabled you to link backend errors to your users’ experience by connecting replays with backend web projects (e.g., Python). Now you'll see a "Replays" tab on the Issue Details page where you can find replays associated with the error issue. Conversely, Replay Details will now also include backend errors in the timeline, breadcrumbs, and issues tab. With either approach, you can now better understand how users interact with your application and the impact that backend errors may have on their experience.
Second, we’ve enriched network data to enable you to view request/response bodies and API headers for specific URLs that you care about. This allows you to see the data that was loaded in from an API response causing a page to perform incorrectly. In addition, this will also help you understand user interaction on the page that led to creating a specific API request. Awesome visibility both ways. And with a required opt-in, you choose which URLs are safe for capturing bodies and can avoid any endpoints that may contain Personal Identifiable Information (PII).
And finally, we’ve rolled out the ability for you to search for replays by user interaction within the DOM. Put more plainly, you can now find replays of users who have clicked on specific elements of your web application, helping you to better track down buttons that cause problem for your users. Across all three of these new features, Session Replay continues to be an awesome way to both understand your users and remove painful performance bottlenecks for them.
Team Enhancements: New Roles and Rules
Troubleshooting errors and performance problems is a TEAM sport. Well, maybe not actually a sport but is definitely a team effort and in May we rolled out multiple enhancements to help your team be as efficient as possible when triaging new issues. Now, developers who care about specific paths or transactions can assume ‘code ownership’ of specific issue types, ensuring they are notified when relevant alerts are triggered. In addition, authors of suspect commits within alerting issue types can also be notified, maximizing awareness of an error or performance problem within your team. And if you are opted in for early access (EA) features, you can now try out Team-based Roles to find freedom for setting permissions that work best for your individual team.
Cron Monitors (Beta): Vercel Cron Jobs and New SDKs
While currently in open Beta, we’ve recently added new functionality to Cron Monitors that will set up monitors for your Vercel Cron Jobs. We’ve also added support for Python, Celery, PHP, Laravel, and Node.JS to simplify the set-up process, and the ability to create alerts for your team on missed or failed check-ins. More to come as Cron Monitors continues to move toward GA.
If you want more, our changelog has the running list of all product and feature releases. You can also drop us a line on GitHub, Twitter, or our Discord. And if you’re new to Sentry, you can try it for free today or request a demo to get started.


