Logging in React Native with Sentry

Lewis D. -

Logs are often the first place dev teams look when they investigate an issue. But logs are often added as an afterthought, and developers struggle with the balance of logging too much or too little.
As a seasoned developer, you may remember a time when you were asked to investigate an issue and then handed a 200 MB plaintext log file. Three hours and four Python scripts later, you would realize that the problem was in a different component.
Over time, many standards and libraries have been developed to make logging easier, and React Native has plenty of logging functions. Our initial guide to logging in React Native is a good starting point. However, if you want to take things to the next level, this guide shows you how to use Sentry’s logging features to ensure your logs are useful and all the information you need is readily available.
Getting Logs into Sentry
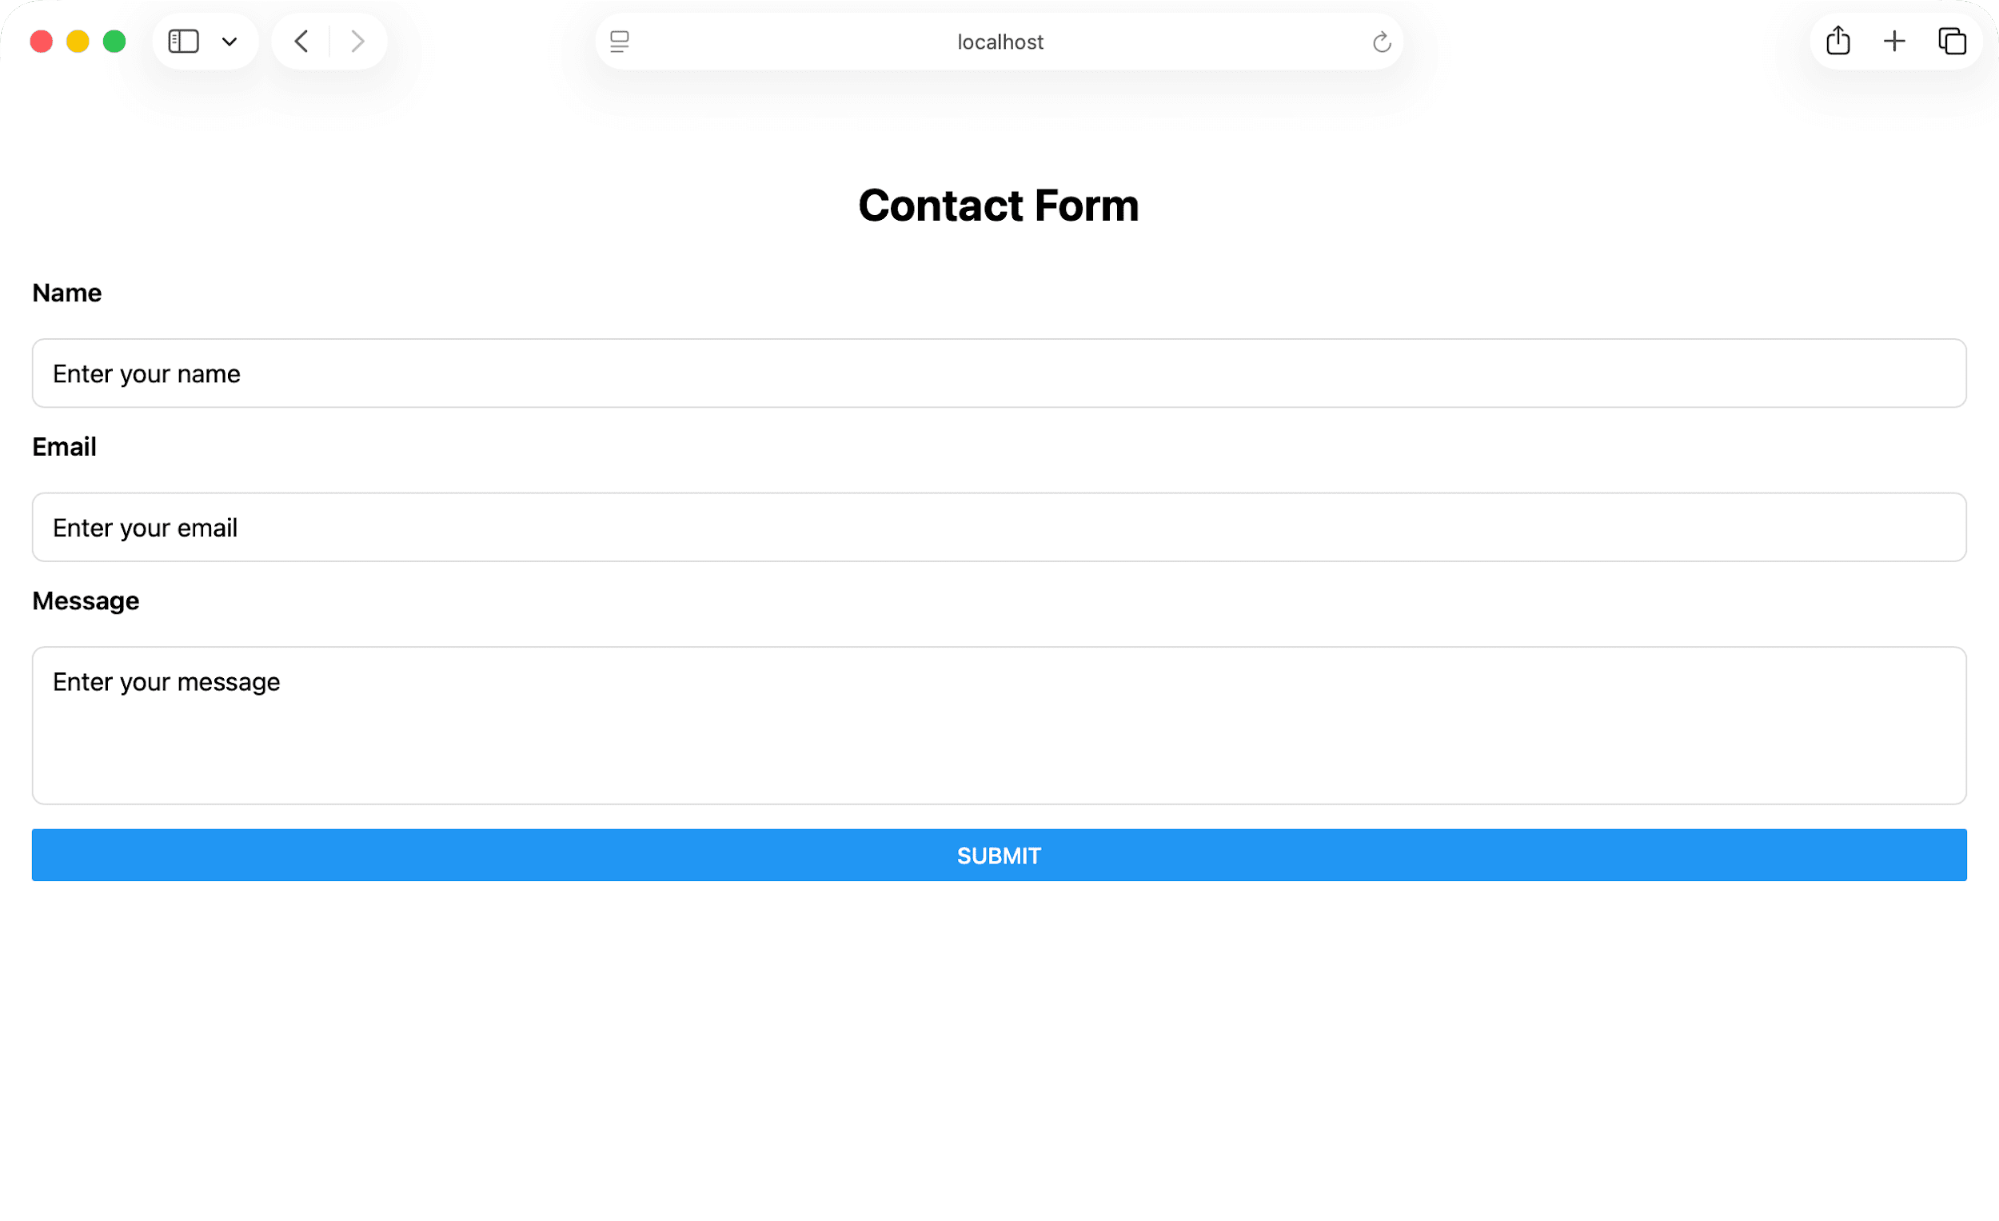
This guide uses a simple React Native (Expo) app to show examples of Sentry’s various logging features. The app is a contact form with some basic validation on the fields. If you want to follow along and try for yourself, you can find the app in the demo repository.
Demo React Native app interface
If you have an existing React Native application, or plan to build one, this guide provides the steps required to take full advantage of logging with Sentry.
Set up
To start using Sentry features, we first need to install Sentry into our project. Start by creating a new project in Sentry and choosing React Native as the platform. Then, run the installation wizard to set up the necessary configurations in your local project:
npx @sentry/wizard@latest -i reactNative --saas --org your-team-name --project your-project-nameEnable logging when prompted. When the configuration completes, you should see code like the following added to your main App.js class:
Sentry.init({
  dsn: "YOUR_SENTRY_DSN",
  // Enable logs to be sent to Sentry
  enableLogs: true,
});
This initializes the Sentry SDK and enables logging with the Sentry logging library.
Sentry Logger API
Now that we’ve initialized Sentry and enabled logs, we can use the Sentry.logger namespace to send logs to our Sentry dashboard.
We can log messages with different log levels:
tracedebuginfowarnerrorfatal
We can also use the Sentry.logger.fmt function to add properties to the log message.
In the example app, add a new log call to the handleSubmit function:
const handleSubmit = () => {
    Sentry.logger.info(
      `${name} submitted a form.`
    );

    //...
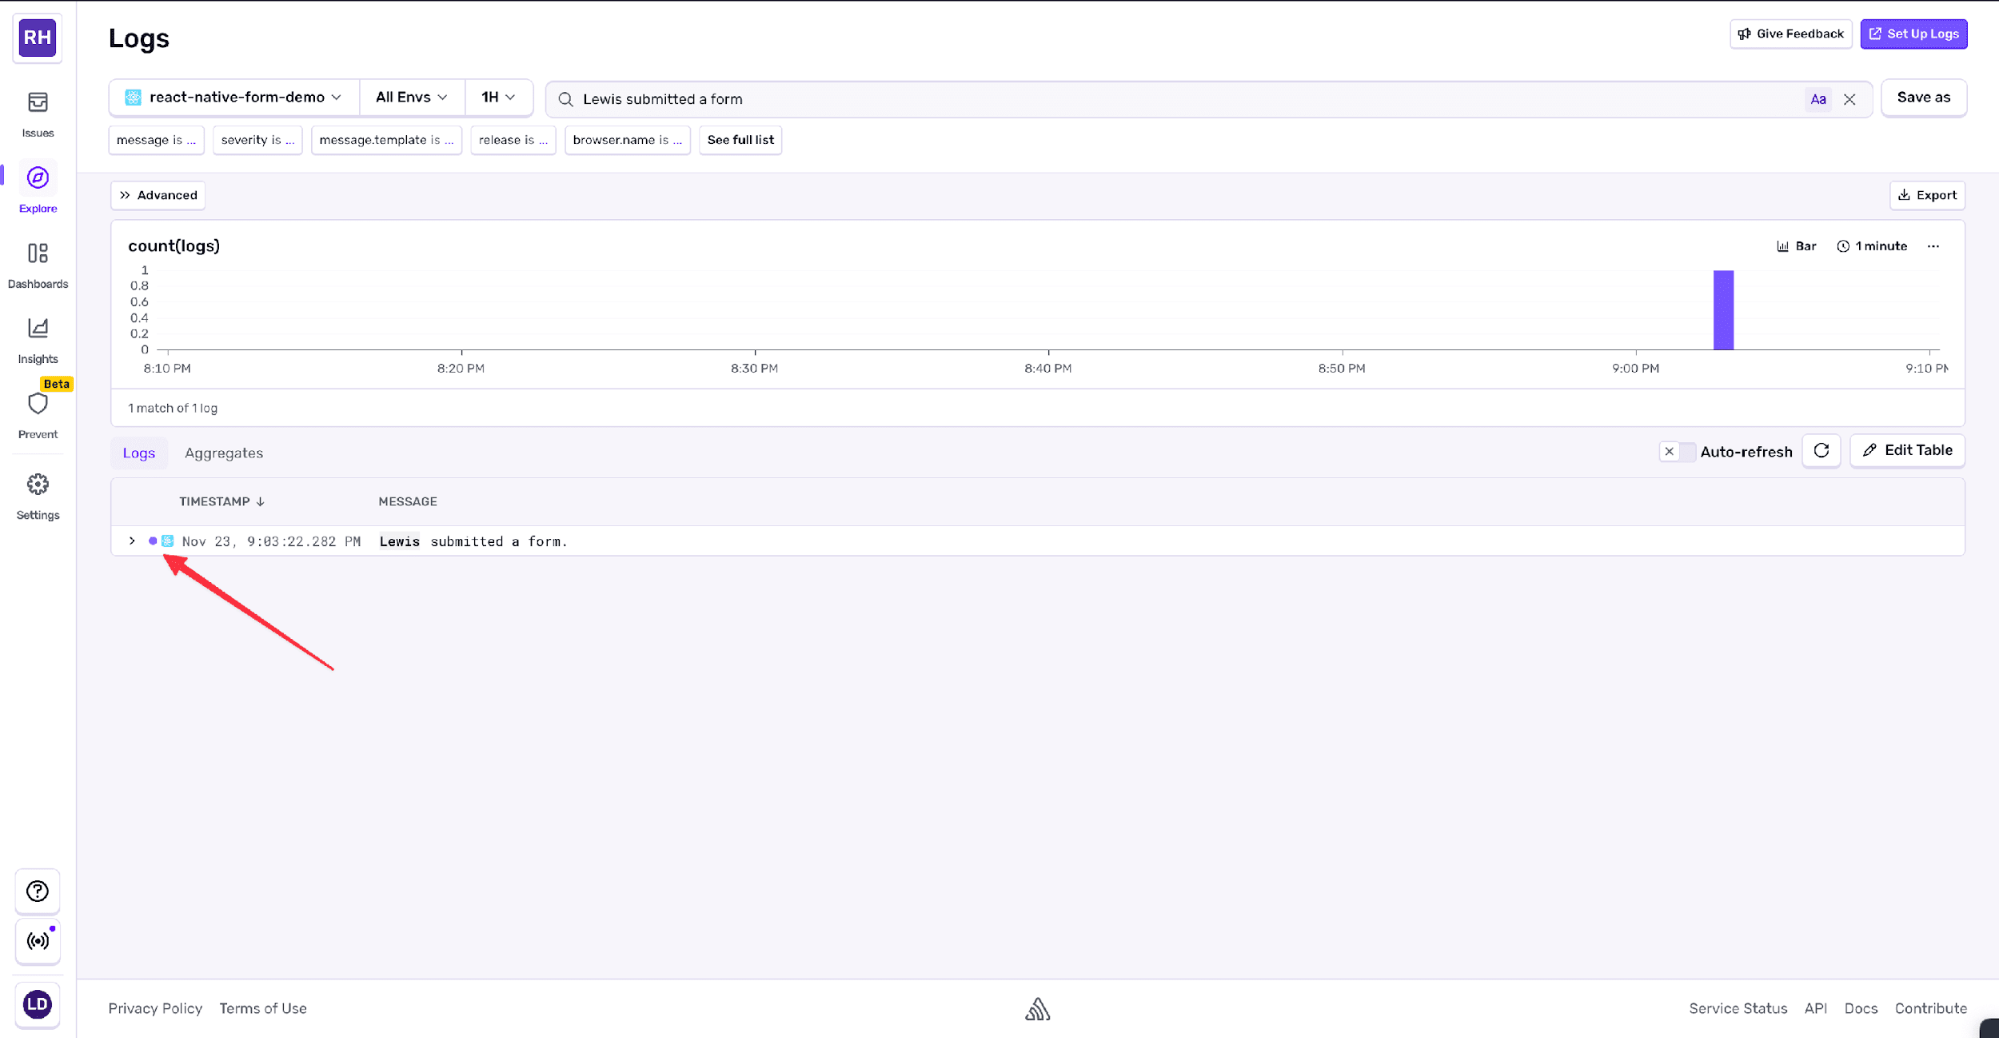
After we click the Submit button, we will see an info level log on our Sentry dashboard.
We can manually add additional attributes to the logs. These don’t form part of the main log message but instead attach to the log and allow us to search or filter by them later.
To try this out, update the log that we added previously:
Sentry.logger.info(
    `${name} submitted a form.`,
    {
        filterID: "01",
        extraMessage: "This is an extra message."
    }
);
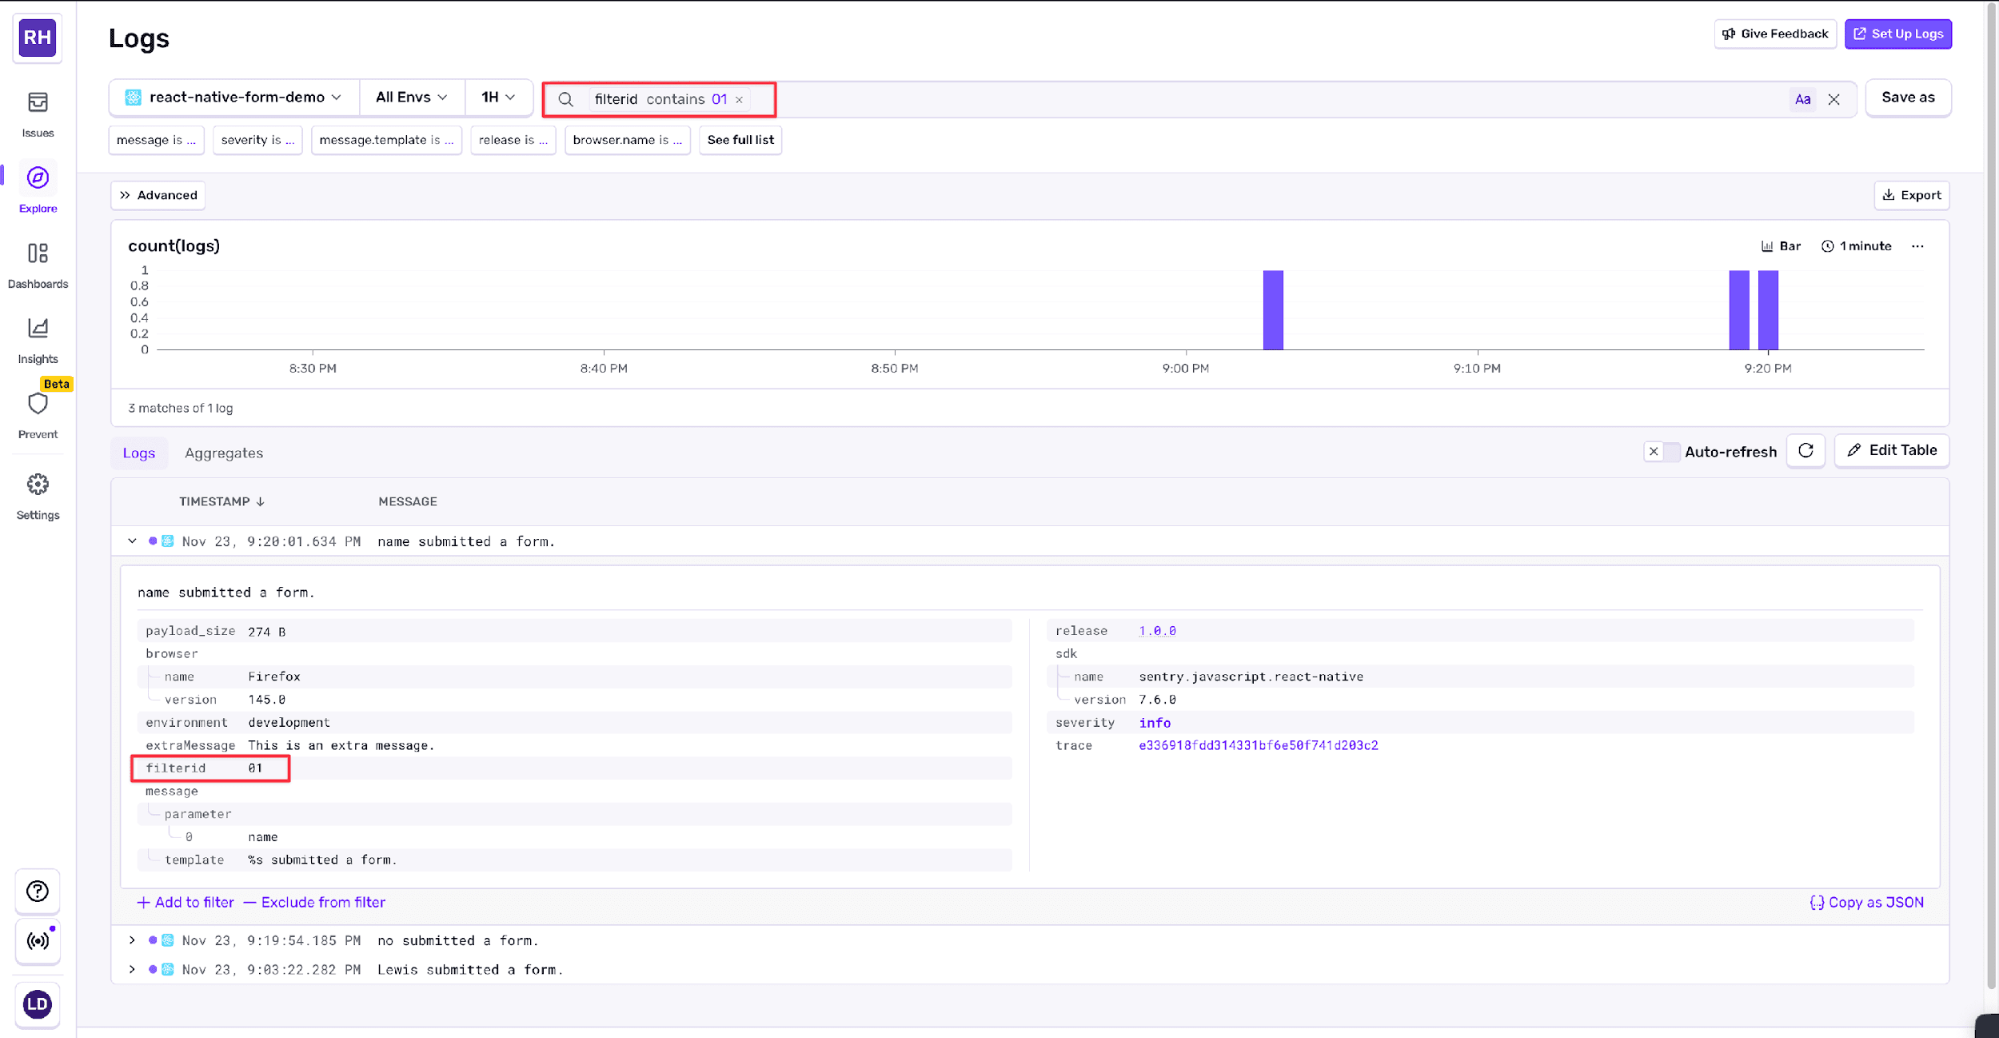
When we submit our form, we will see both the new filterID and extraMessage fields in the log payload.
Integrations
We have the Sentry Logger API working, but our app already has logging built with the default JavaScript console object. Luckily, we don’t have to rewrite all our logging because Sentry also provides a way to integrate with default JavaScript logging.
Update the Sentry.init call with the following code after the enableLogs: true line in App.js:
integrations: [
    Sentry.consoleLoggingIntegration({ levels: ["log", "warn", "error"] }),
],
This causes all our existing logging to be sent to our Sentry. We can exclude certain log levels if we like. For example, if we want to reduce clutter on our dashboard, we could opt to send only error level logs.
Sentry.consoleLoggingIntegration({ levels: ["error"] }),However, as you’ll see later in this guide, we can also reduce clutter using the filtering in the dashboard itself, so it’s often better to send Sentry as much useful information as possible.
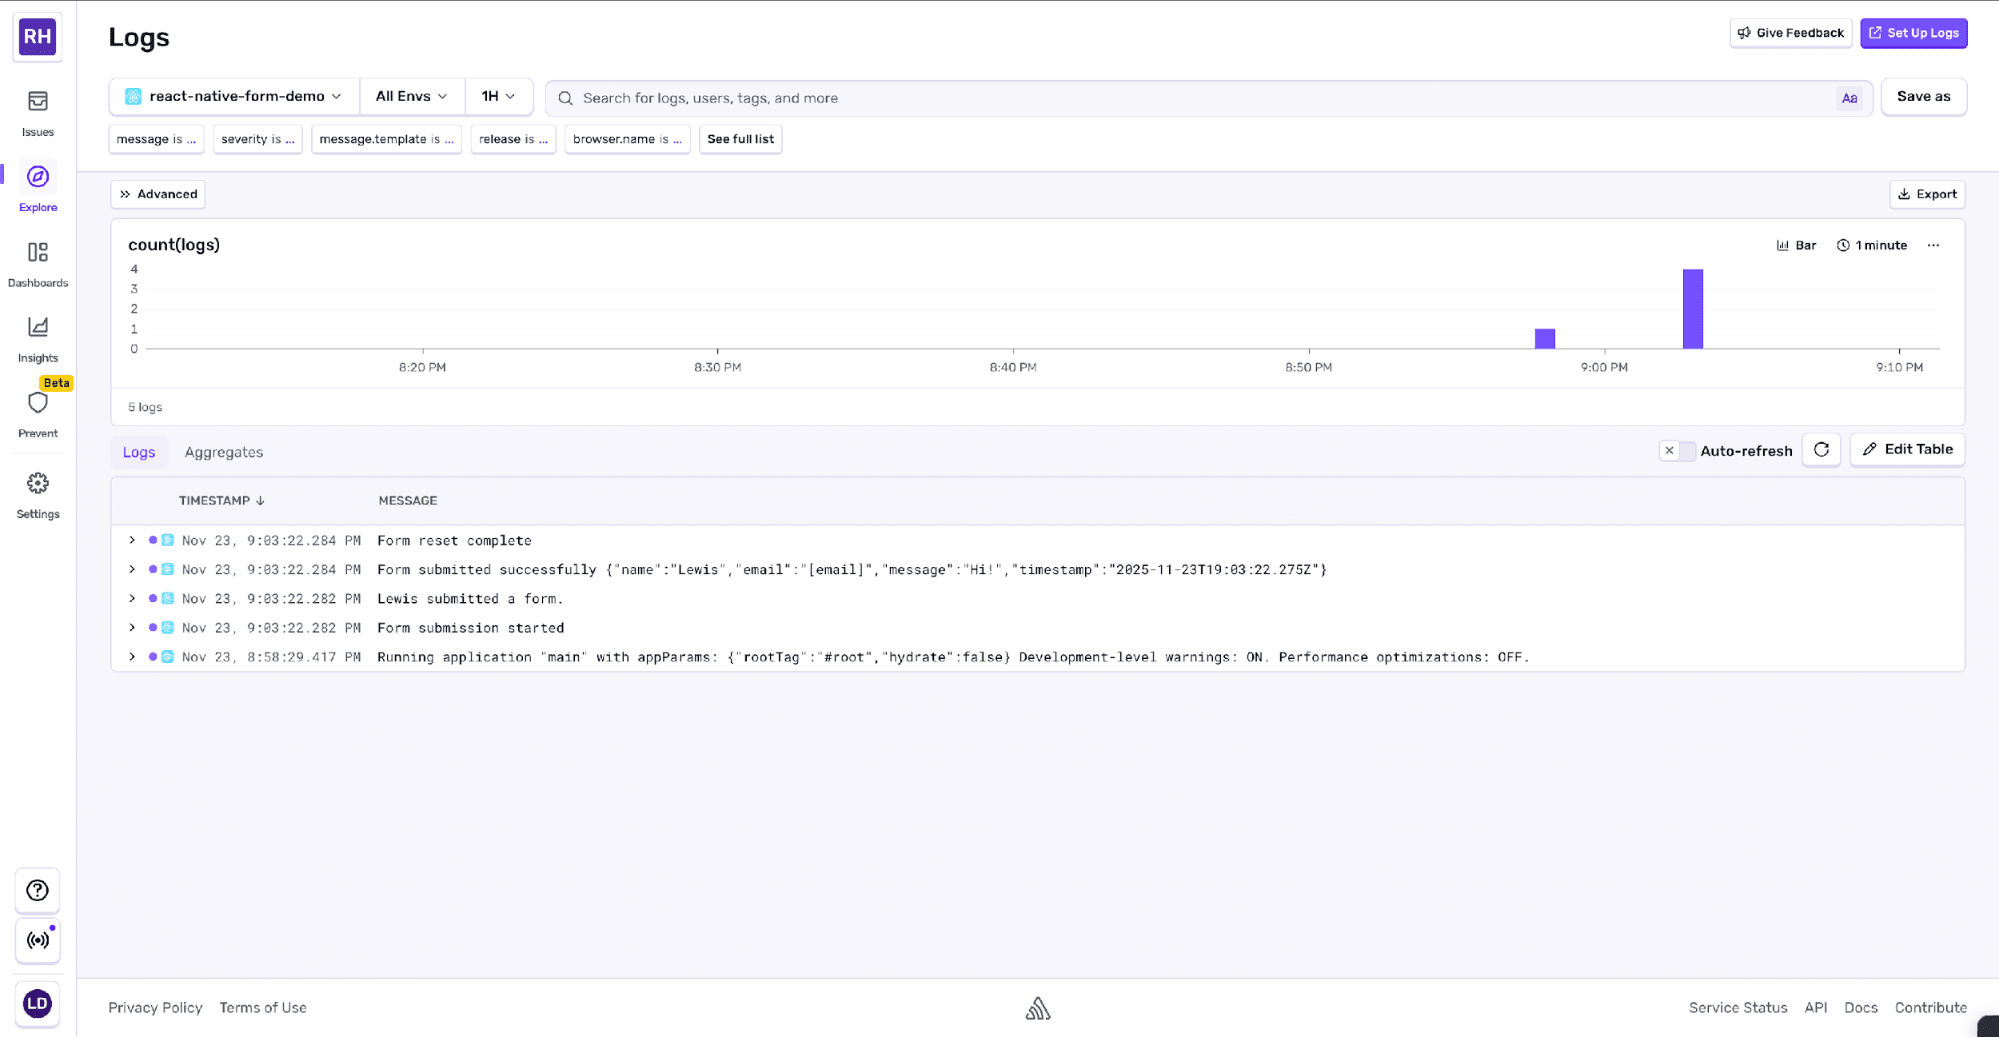
Let’s restart the app, fill in the form, and take a look at the logs that are sent.
Even with these integrated logs, Sentry links all the extra information available, such as the originating environment and browser type. All these data points can be used to filter, search, or group our logs.
Searching, filtering, and grouping
The Logs dashboard gives us access to all our logs in one place, as well as to tools for finding exactly what we need.
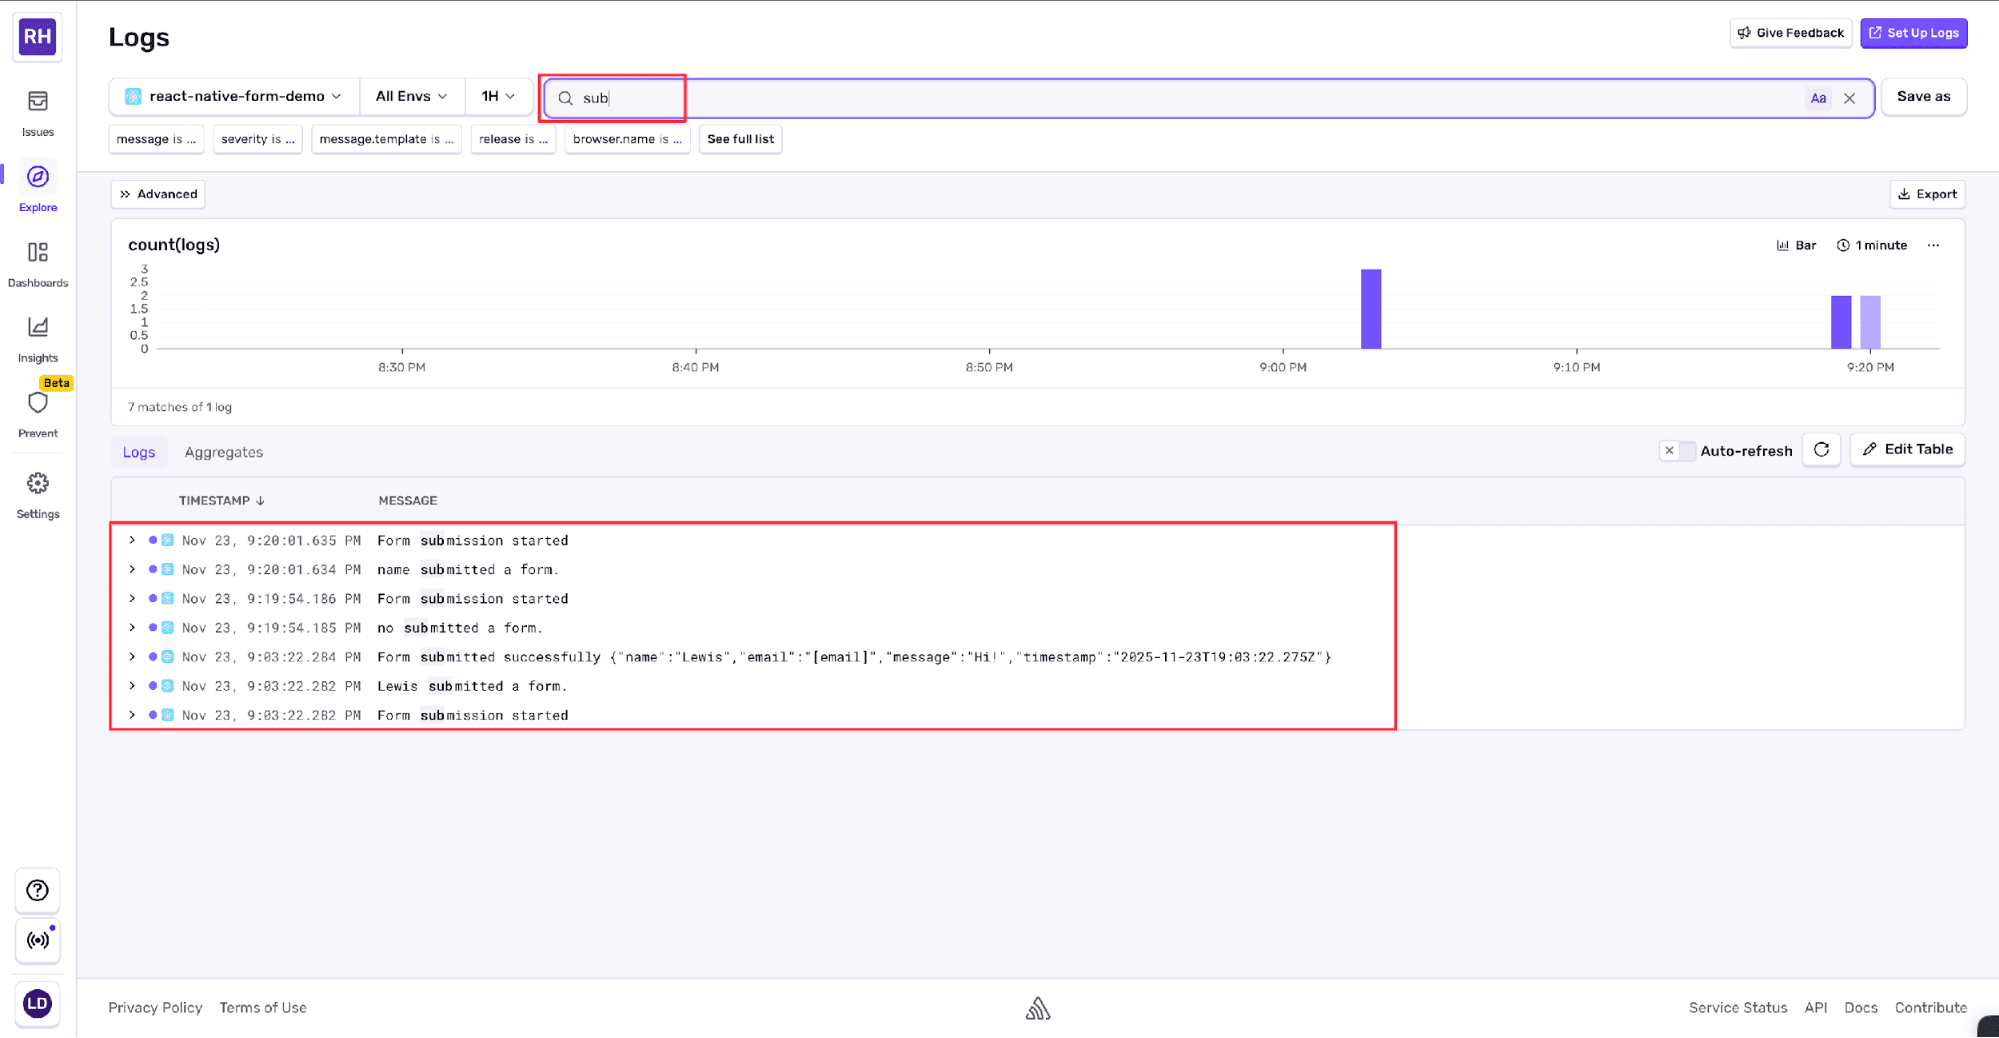
At the top of the dashboard, we can use the search bar to find specific log messages. We can search for text that appears in the log message itself or use Sentry’s query syntax to search by specific fields.
For example, we can get all the logs relating to submitting a form by typing sub in the search bar.
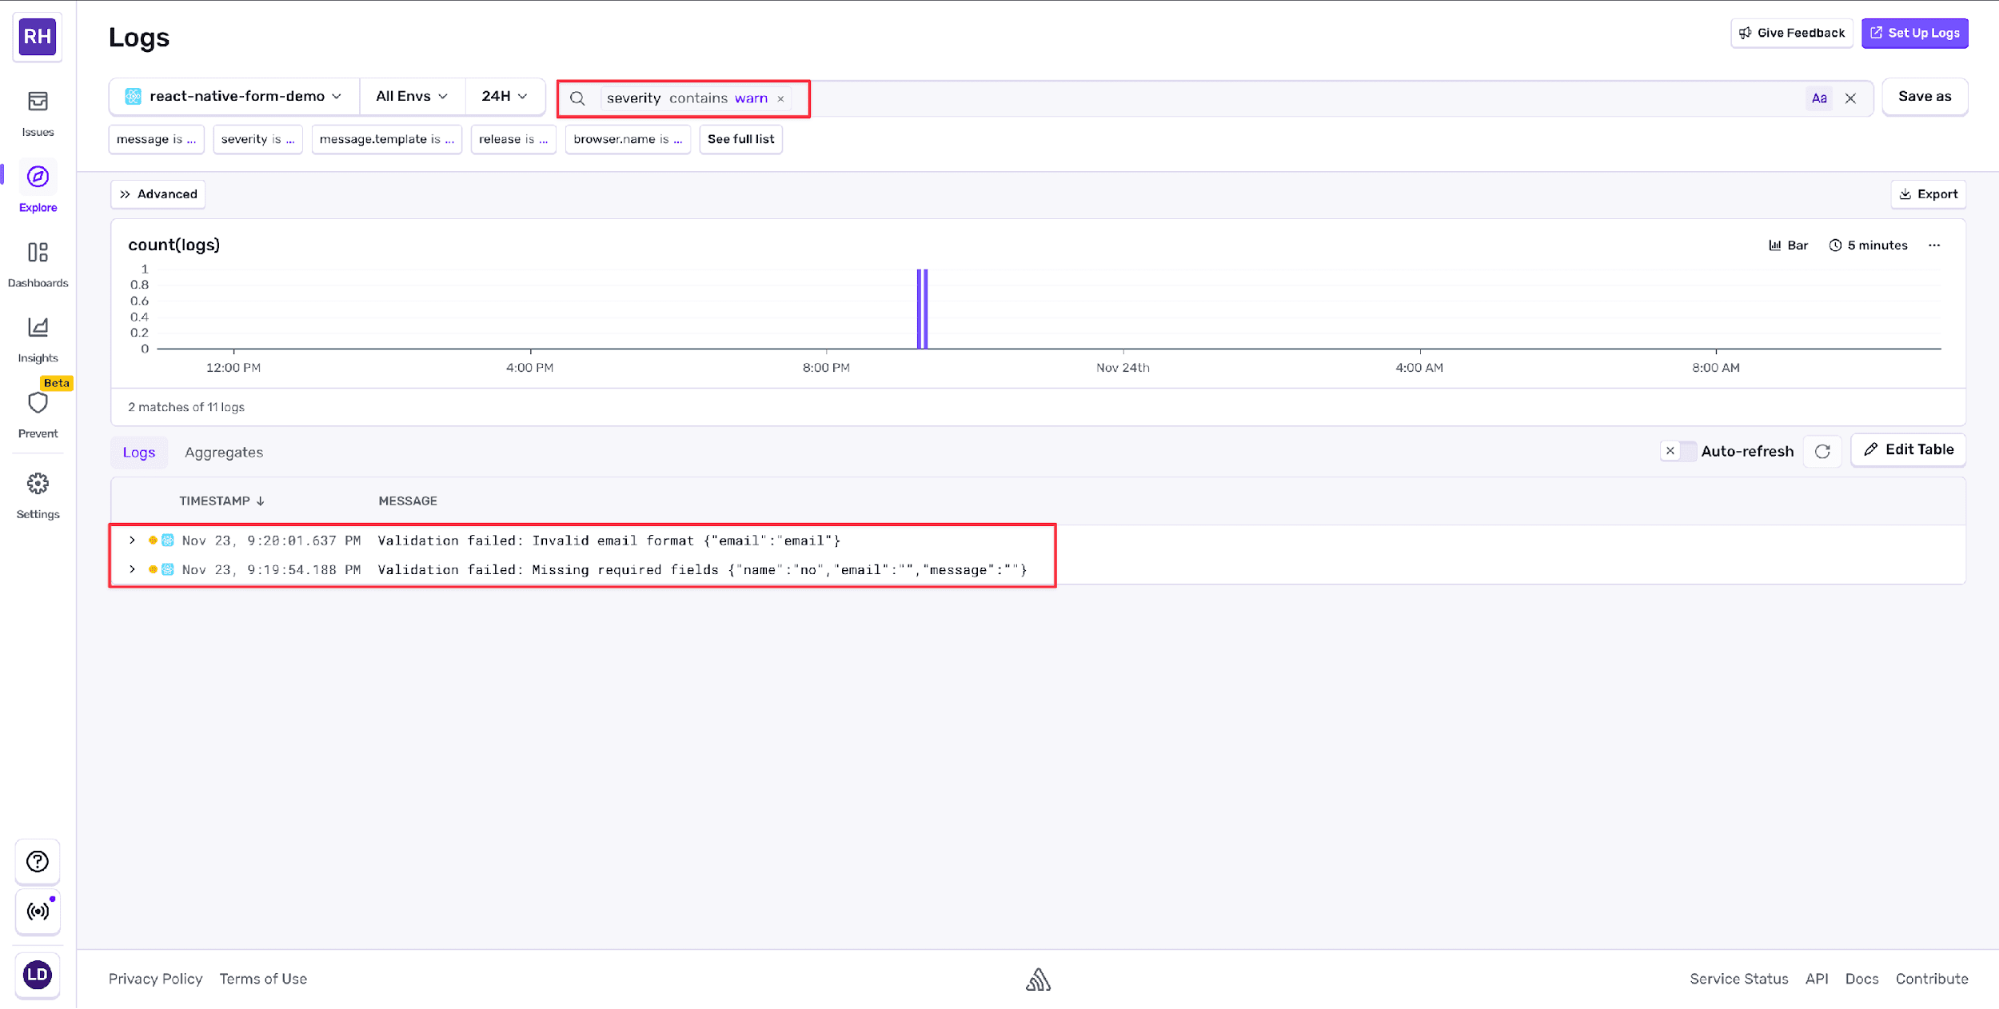
We can also search by log level. To see only warning logs, use the query severity:warn in the search bar.
We can also filter by the extra attributes that we added earlier. Type filterID:01 in the search bar.
When we have logs coming from multiple parts of our application, we can use custom attributes to quickly isolate logs from specific components or flows.
We can combine multiple filters together. For example, we could filter by both filterID and log level to see only warning logs from a specific part of our app.
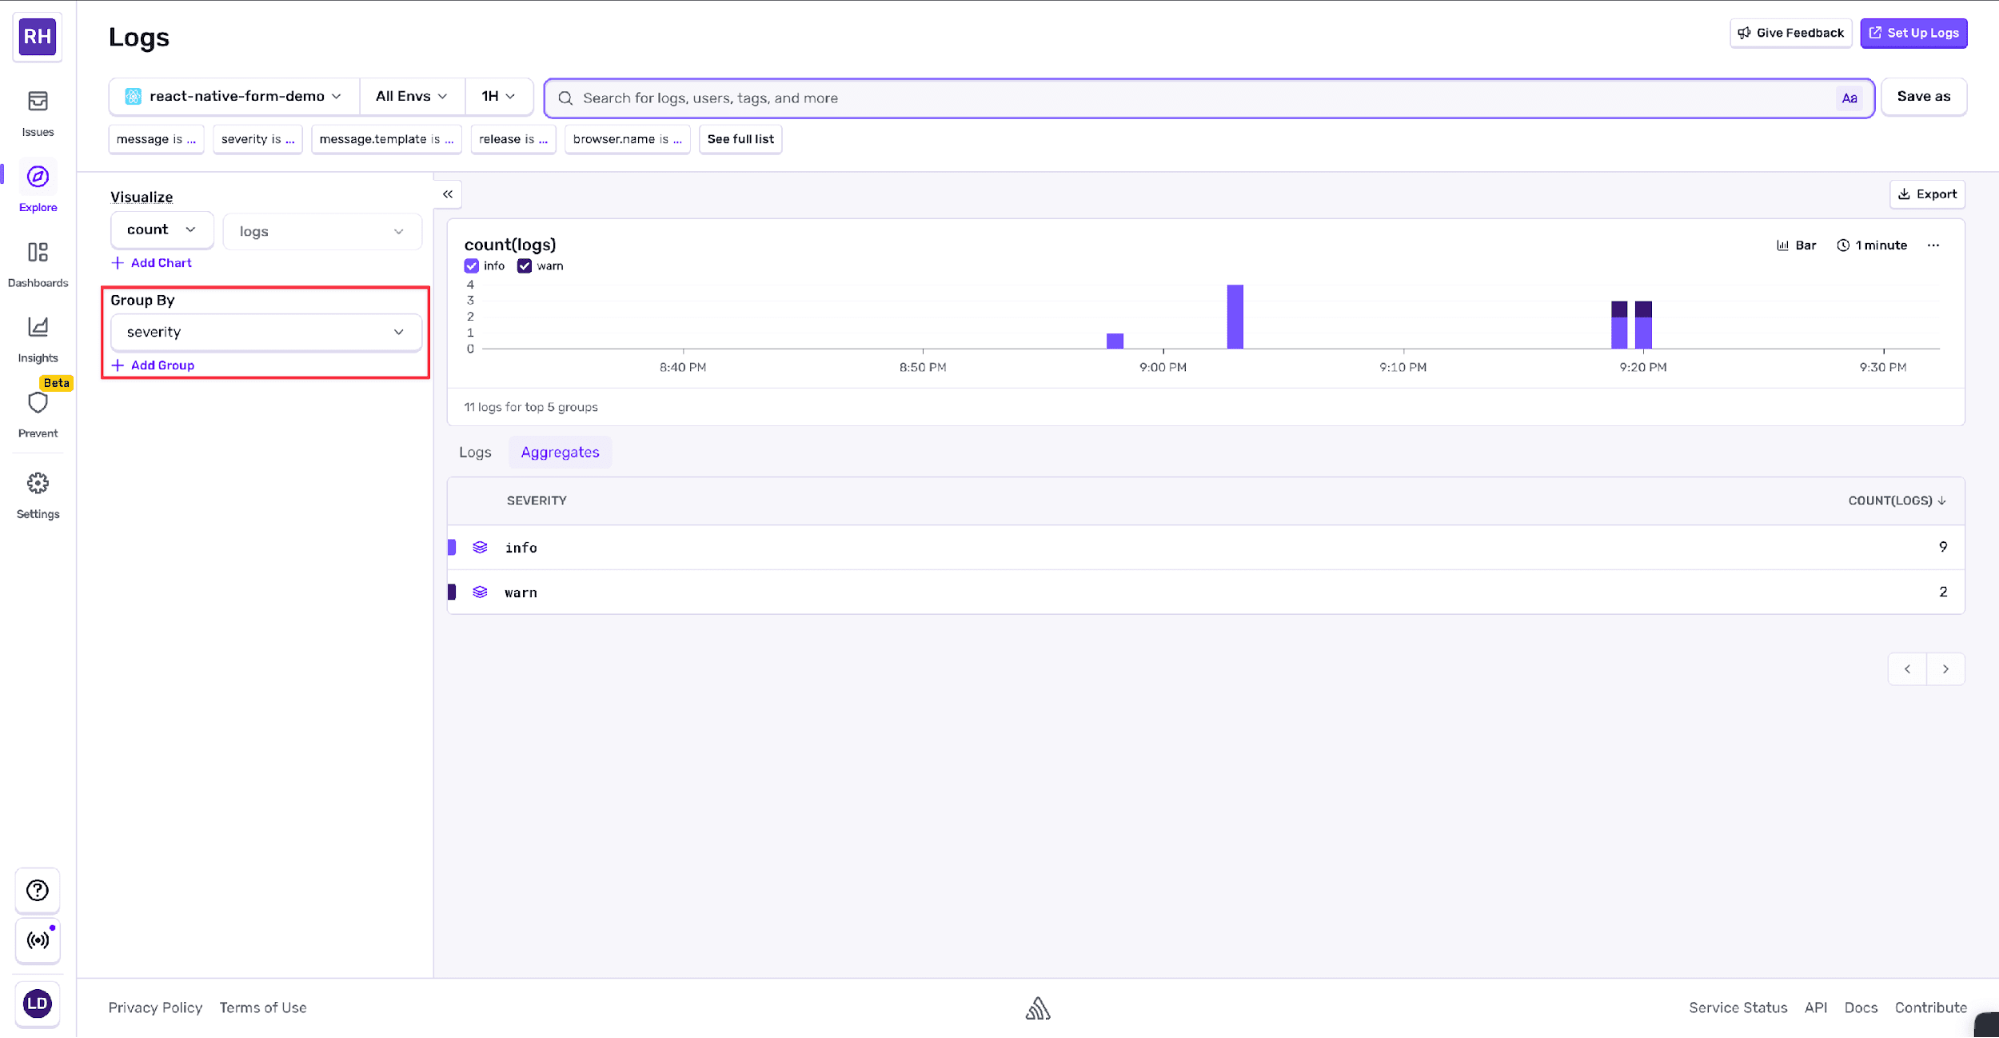
Sentry also lets us group logs by different attributes. To do so, click the >> Advanced button, then open the Group By dropdown and select the type severity.
Our logs are now organized by their log level, making it easier to see how many logs we have at each severity. We can also group by environment, browser type, or any custom attribute we’ve added to our logs.
This becomes particularly useful when debugging an issue that affects specific users or environments. We can quickly group by browser or operating system to see if a problem is isolated to certain platforms.
Debugging a real application
To see the real value of Sentry logging, let’s look at a more complete example. We’ve built a cat voting app, where users can upvote or downvote cat pictures. The app has a React Native frontend that talks to an Express.js backend with a SQLite database. The frontend fetches cat images from an external API and stores them in the database.
If you want to explore the logging features for yourself, you can clone the app repository.
We’ve only set up Sentry on the frontend, as this guide is focused on React Native. We could, and should, create an Express.js Sentry project for our backend code as well.
The app structure
The app consists of:
A voting screen that displays cat images with upvote and downvote buttons
A winner screen that shows the most popular cat
A context provider that manages data fetching and state
An API service that handles all backend communication
This is what the Sentry setup looks like in the frontend/App.js file:
Sentry.init({
    dsn: process.env.EXPO_PUBLIC_SENTRY_DSN,
    environment: __DEV__ ? 'development' : 'production',
    sendDefaultPii: true,
    enableLogs: true,
    tracesSampleRate: 1.0,
});
Tracking user actions
In frontend/src/screens/CatListScreen.js, we log when users vote on cats. We use both the logger API and breadcrumbs to create a trail of what the user does:
const handleVote = async (catId, voteType) => {
    Sentry.logger.info("User clicked vote button", {
      catId: catId.toString(),
      voteType,
      feature: "voting",
    });

    Sentry.withScope((scope) => {
      scope.setTag('feature', 'voting');
      scope.setTag('voteType', voteType);

      Sentry.addBreadcrumb({
        category: 'user-action',
        message: `User initiating ${voteType} for cat ${catId}`,
        level: 'info',
      });

      try {
        submitVote(catId, voteType);
        Sentry.logger.info("Vote completed successfully", {
          catId: catId.toString(),
          voteType,
        });
      } catch (err) {
        Sentry.logger.error("Vote failed", {
          catId: catId.toString(),
          voteType,
          errorMessage: err.message,
        });
        Sentry.captureException(err);
      }
    });
};
Debugging a backend issue
Let’s suppose some users report getting a 500 Internal Server Error (an API error) when they vote on specific cats. We turn to our Logs dashboard to investigate.
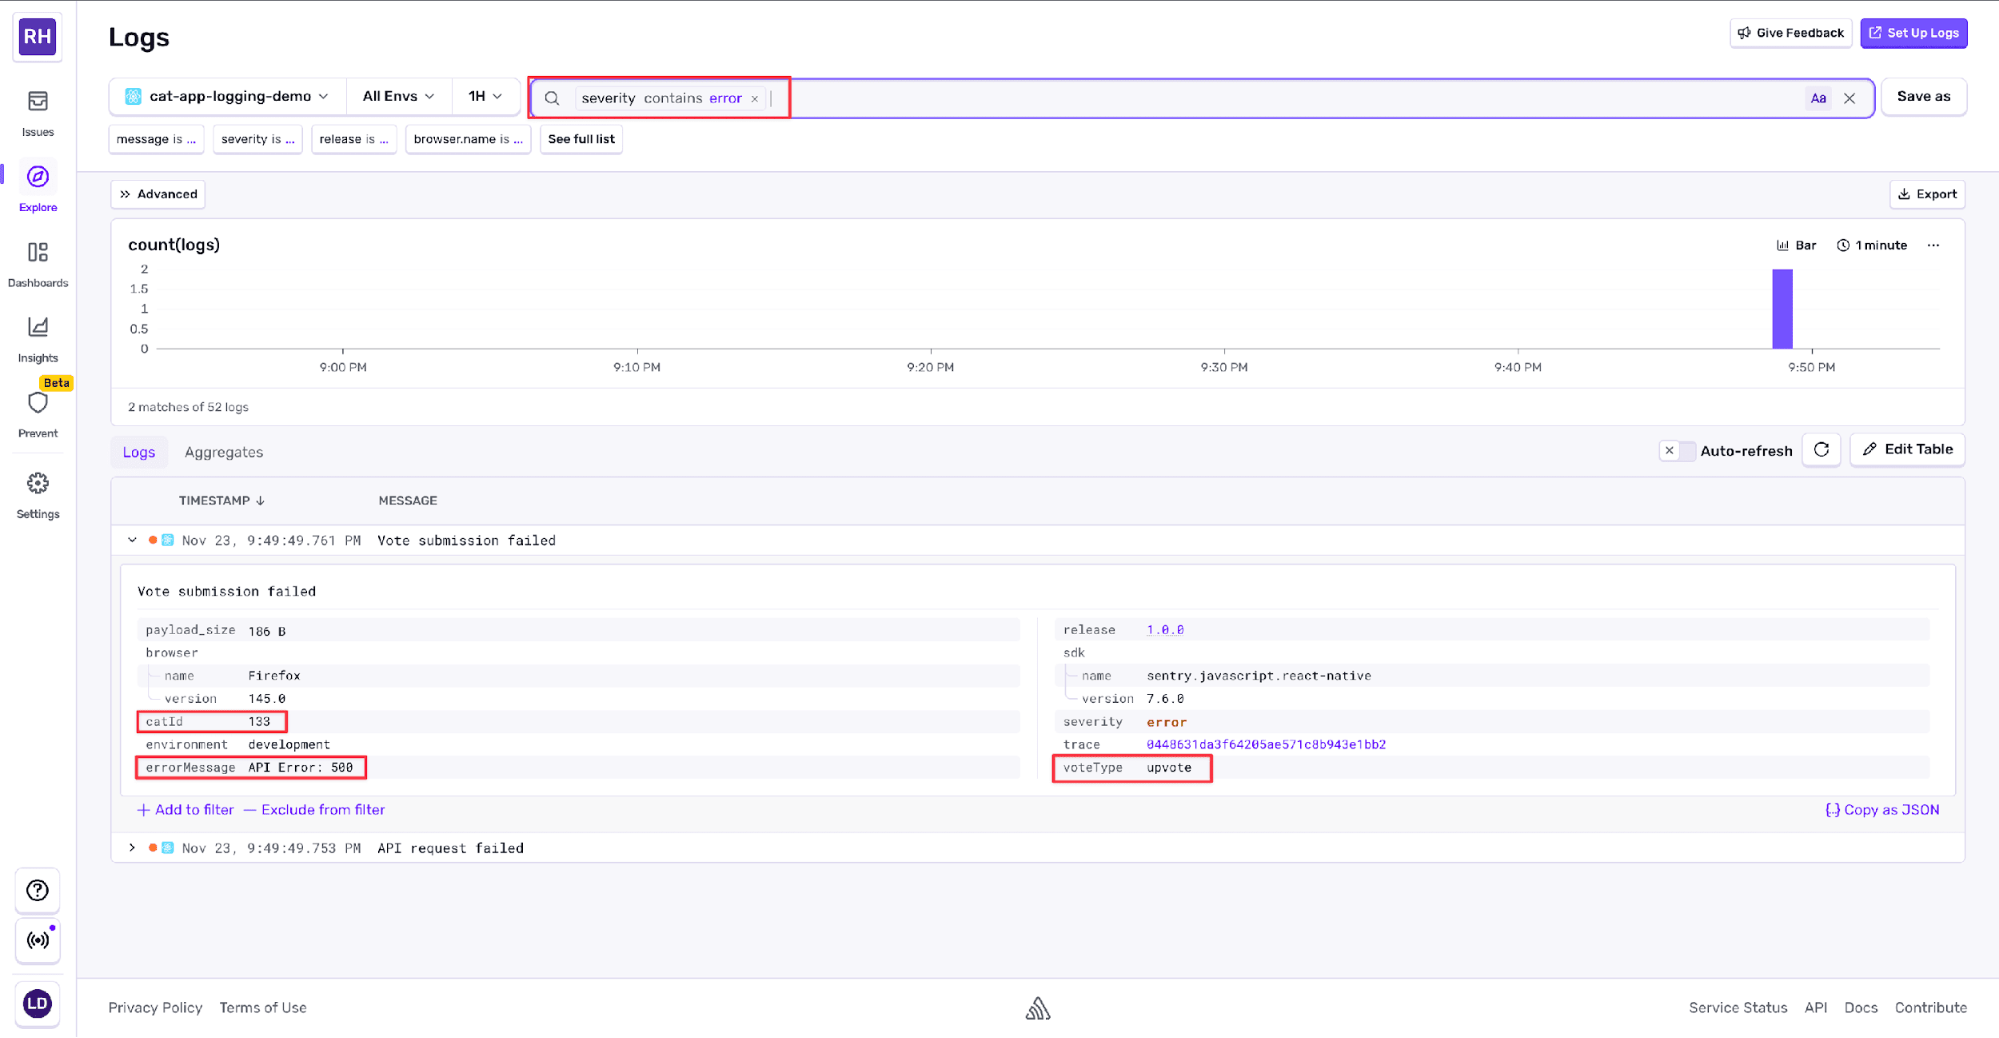
First, we check the dashboard for recent error logs. We filter by severity:error and see several Vote submission failed logs. We click on one of them to see the details.
The log shows us:
The cat the user tried to vote on (
catId: "133")The type of vote it was (
voteType: "upvote")The error message from the backend (
errorMessage: "API Error: 500")The timestamp of when the error happened
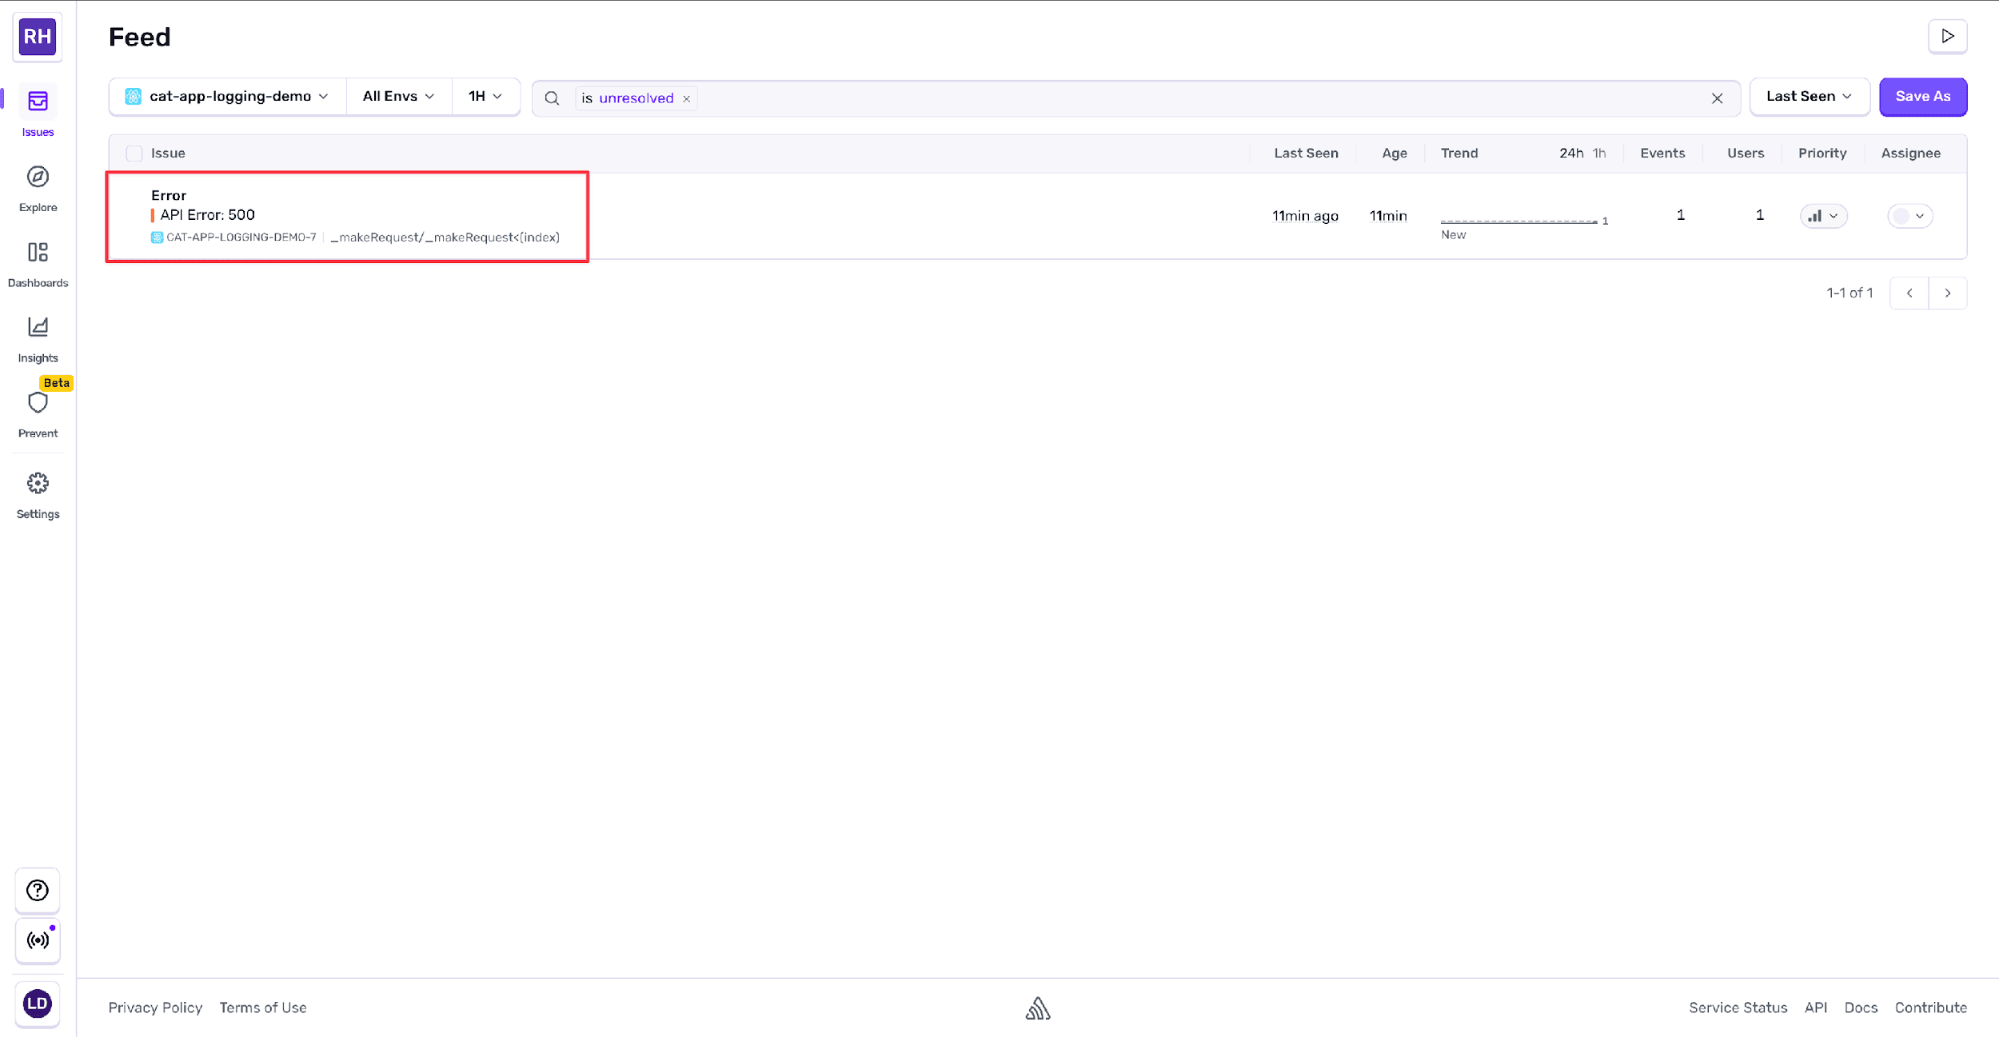
Because this is an error level event, Sentry also logs an Issue. We navigate to our Issues dashboard and click on the corresponding error event.
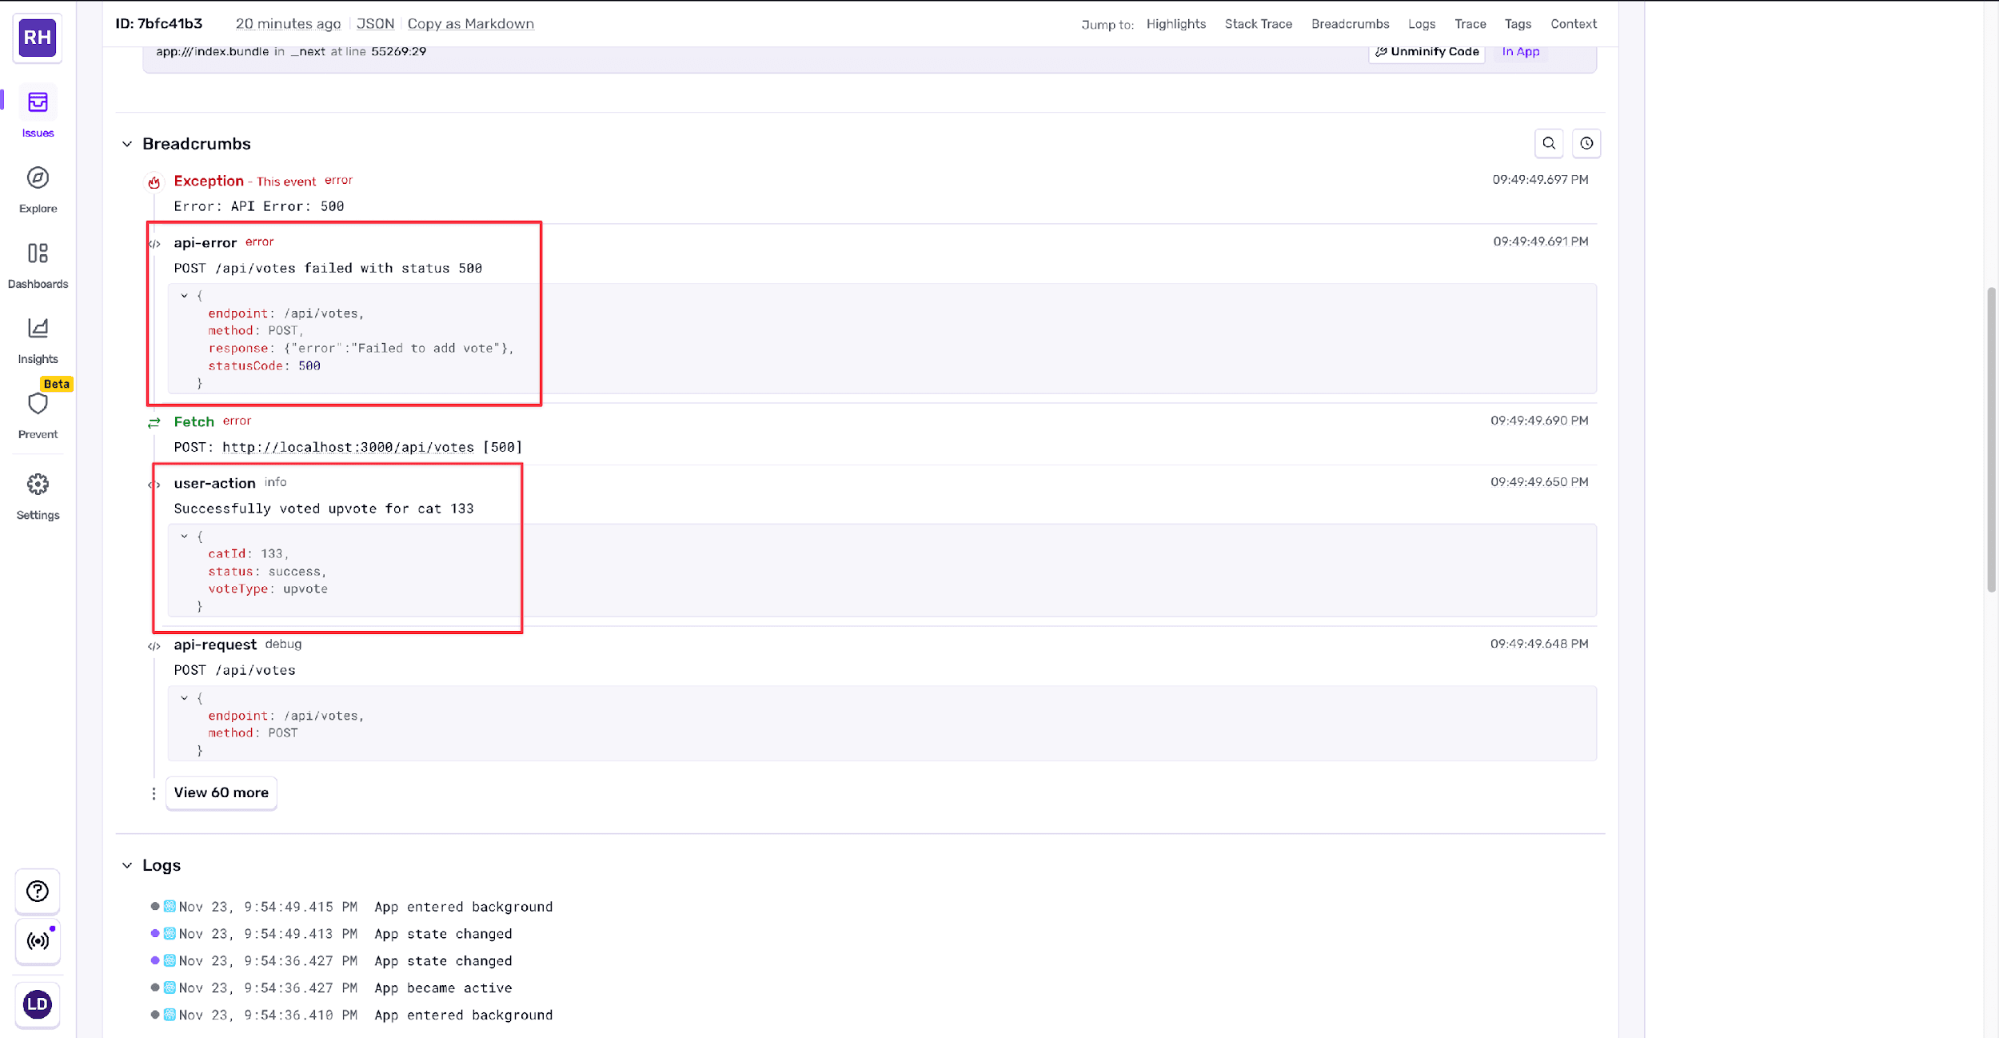
In the issue entry, we can scroll down and see the breadcrumb trail leading up to the error. The logs show the user loaded the cat list, clicked the upvote button, and then the API request failed with a 500 HTTP status code.
Now we know the problem is on the backend. We check the backend server logs around the same timestamp and find a database constraint error. The backend attempted to insert a vote, but the database rejected it due to a foreign key constraint violation (the cat ID doesn’t exist in the database).
Looking back at the Sentry logs, we search for when this cat was added. We filter by operation:fetchCats and see that the app fetched cats from the external API, but when it tried to save them to the database, one of the requests failed. The Sentry log shows:
Failed to fetch cats
errorMessage: "Database error: unique constraint failed"
The problem is clear: When the app fetched new cats, some were successfully added to the database while others failed due to duplicate IDs. Users could see cats that weren’t in the database, and when they tried to vote on those cats, the backend rejected the vote.
We can fix the issue by improving error handling in the cat fetching logic. When cats fail to save, we remove them from the UI so that users can’t vote on cats aren’t in the database:
const fetchCats = async () => {

    ...

    const response = await fetch('https://api.thecatapi.com/v1/images/search?limit=10');
    const newCats = await response.json();

    // Try to save cats to backend
    const saveResponse = await api.post('/api/cats', { cats: newCats });

    // Get all cats again - this only includes successfully saved cats
    const updatedCats = await api.get('/api/cats');
    setCats(updatedCats);

    // Log if some cats failed to save
    if (updatedCats.length < newCats.length) {
        Sentry.logger.warn("Some cats failed to save to database", {
            fetched: newCats.length,
            saved: updatedCats.length,
            failed: newCats.length - updatedCats.length,
        });
    }
};
Performance monitoring
In addition to errors, we can also track performance using Sentry’s spans feature. In frontend/src/context/CatsContext.js, we can monitor how long it takes to load cats:
const fetchCats = async () => {
    const span = Sentry.startInactiveSpan({
      op: 'db.query',
      name: 'fetchCats',
    });

    try {
      const catsData = await api.get('/api/cats');

      span.setAttributes({
        count: catsData.length,
        source: "database",
      });

      span.setStatus({ code: 1 }); // OK status
    } catch (error) {
      span.setStatus({ code: 2, message: error.message }); // ERROR status
      throw error;
    } finally {
      span.end();
    }
};
Using spans provides better developer experience for performance tracking. You can view span data in the Performance tab of your Sentry dashboard, where you can easily identify slow operations and bottlenecks in your application.
The beforeSendLog function
beforeSendLog functionWe can use the beforeSendLog function to filter logs before they’re sent to Sentry. This is useful for controlling exactly which data reaches Sentry, helping us balance between having enough logs and not overwhelming our dashboard with noise.
For example, we can filter out debug-level logs in production, or remove sensitive information before sending logs to Sentry:
Sentry.init({
    dsn: process.env.EXPO_PUBLIC_SENTRY_DSN,
    environment: __DEV__ ? 'development' : 'production',
    enableLogs: true,

    beforeSendLog: (log) => {
        // Filter out debug logs in production
        if (!__DEV__ && log.severity === 'debug') {
            return null;
        }

        // Remove sensitive attributes
        if (log.attributes?.userEmail) {
            delete log.attributes.userEmail;
        }

        return log;
    },
});
By returning null, we prevent the log from being sent to Sentry. This approach helps us maintain clean, relevant logs while protecting sensitive user information.
Going beyond Logs
Sentry logging turns logs from raw data into a useful and intuitive tool that could save us countless hours when diagnosing an issue. If you are still unclear about any of the steps required to set up Sentry’s logging features, you can turn to our documentation on setting up logs or setting up drains and forwarders.
As we touched on in this guide, logging goes hand-in-hand with Sentry’s other features, such as tracing and profiling.
With all these features set up, you can begin to take full advantage of the Sentry toolbox.
