Logging in Python: A Developer’s Guide

Bala Priya C - Last Updated:

Have you ever had a tough time debugging your Python code? If yes, learning how to set up logging in Python can help you streamline your debugging workflow.
As a beginner programmer, you’ll have likely used the print() statement—to print out certain values across runs of your program—to check if the code is working as expected. Using print() statements to debug could work fine for smaller Python programs. However, as you start working on larger and more complex projects, you’ll need a persistent log that contains more information on the behavior of your code so as to help you debug and track down errors systematically.
In this tutorial, you’ll learn how to set up logging in Python using the built-in logging module. You’ll learn the basics of logging, logging variable values and exceptions, configuring custom loggers and formatters, and more.
In addition, you’ll also learn how Sentry’s Python SDK can help you monitor your applications and simplify debugging workflow. Sentry natively integrates with Python’s built-in logging module and also provides detailed information on both errors and performance issues in your application.
Let’s get started...
How to Start Logging in Python
Python ships with the logging module that we’ll be using in this tutorial. So you can go ahead and import it into your working environment.
import loggingPython's built-in logging module provides easy-to-use functionality and five logging levels that are of incremental severity: debug (10), the lowest logging level to critical (50), the highest.
Let’s enumerate the different logging levels:
Debug (10): Debug is the lowest logging level; it’s used to log some diagnostic information about the application.
Info (20): Info is the second lowest logging level used to record information on a piece of code that works as intended.
Warning (30): Warnings are used to record events that you should pay attention to, as they’re likely to cause problems in the application in the future. If you don't explicitly set a logging level, then the logging begins from the warning level by default.
Error (40): This is the second highest logging level; it records an error: a part of the application did not work as expected, and the code execution did not succeed.
Critical (50): As the name suggests, this logging level records a mission-critical event, and failing to fix this can potentially cause the application to stop working.
The following code snippet shows how you can use all five logging levels with the syntax: logging.<level>(<message>)
logging.debug("A DEBUG Message")
logging.info("An INFO")
logging.warning("A WARNING")
logging.error("An ERROR")
logging.critical("A message of CRITICAL severity")
You’ll see that the messages corresponding to warning, error, and critical are logged onto the console, whereas the debug and info are not.
WARNING:root:A WARNING
ERROR:root:An ERROR
CRITICAL:root:A message of CRITICAL severity
This is because, by default, only messages corresponding to a logging level of warning and above are logged onto the console. However, you can modify this by configuring the logger to start logging from a specific level of your choosing.
This method of logging onto the console is not more helpful than using the print() statement. In practice, you may want to log these messages into a log file—containing logs across executions—which you can then use as your debugging log.
Note: In the example explained in this tutorial, all code is in the main.py file and when we refactor existing code or add new modules, we explicitly state <module-name>.py to help you follow along.
How to Log to a File in Python
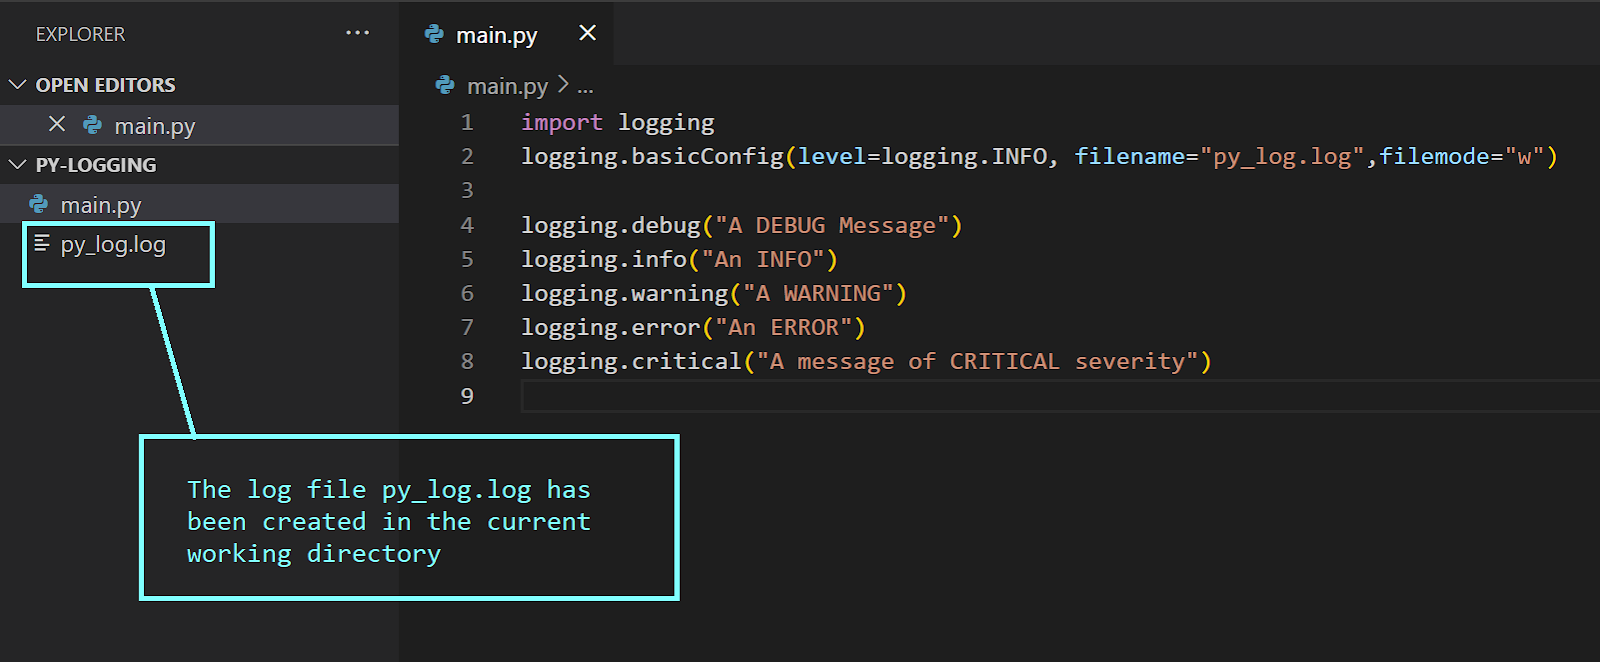
To set up basic logging onto a file, you can use the basicConfig() constructor, as shown below.
logging.basicConfig(level=logging.INFO, filename="py_log.log",filemode="w")

logging.debug("A DEBUG Message")
logging.info("An INFO")
logging.warning("A WARNING")
logging.error("An ERROR")
logging.critical("A message of CRITICAL severity")
Next, let's parse the above syntax for configuring the root logger.
level: This is the level you’d like to start logging at. If this is set to info, then all messages corresponding to debug are ignored.filename: The parameterfilenamedenotes the file handler object. You can specify the name of the file to log onto.filemode: This is an optional parameter specifying the mode in which you’d like to work with the log file specified by the parameterfilename. Setting the file mode to write (w) will overwrite the logs every time the module is run. The defaultfilemodeis append (a) which means you’ll have a log record of events across all runs of the program.
After running the main module, you’ll see that the log file py_log.log has been created in the current working directory.
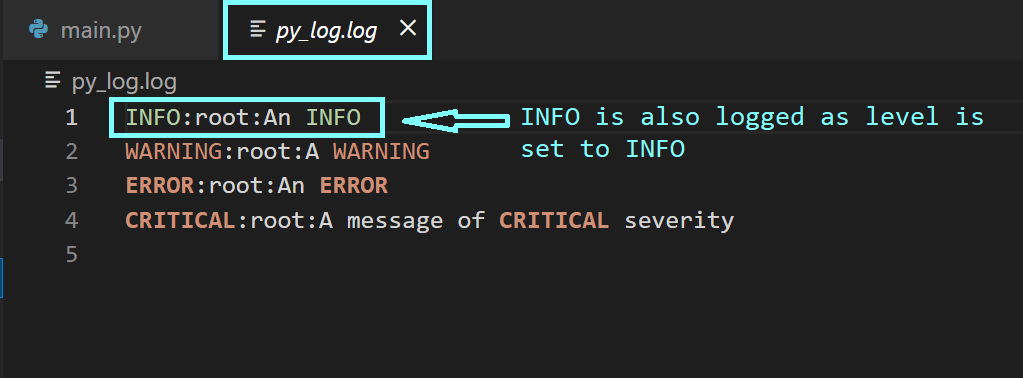
Since we set the logging level to info, the log record now contains the message corresponding to INFO.
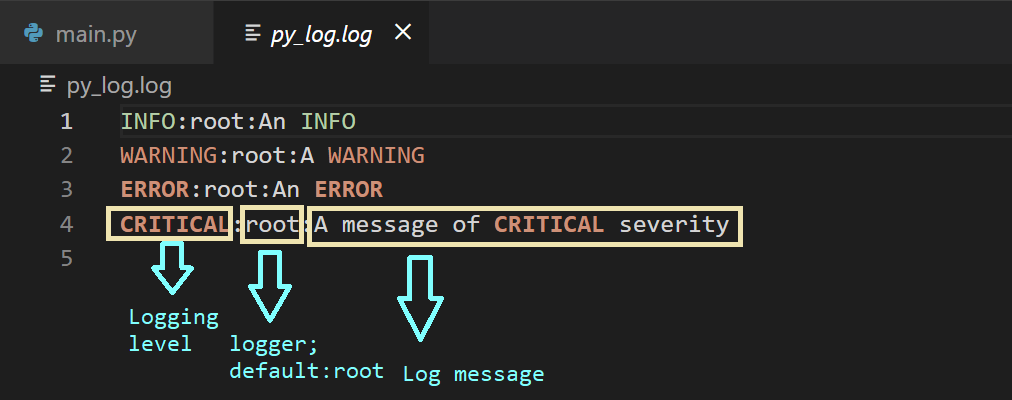
The logs in the log file are of the format: <logging-level>:<name-of-the-logger>:<message>. The <name-of-the-logger> is by default the root logger, as we haven’t yet configured custom loggers.
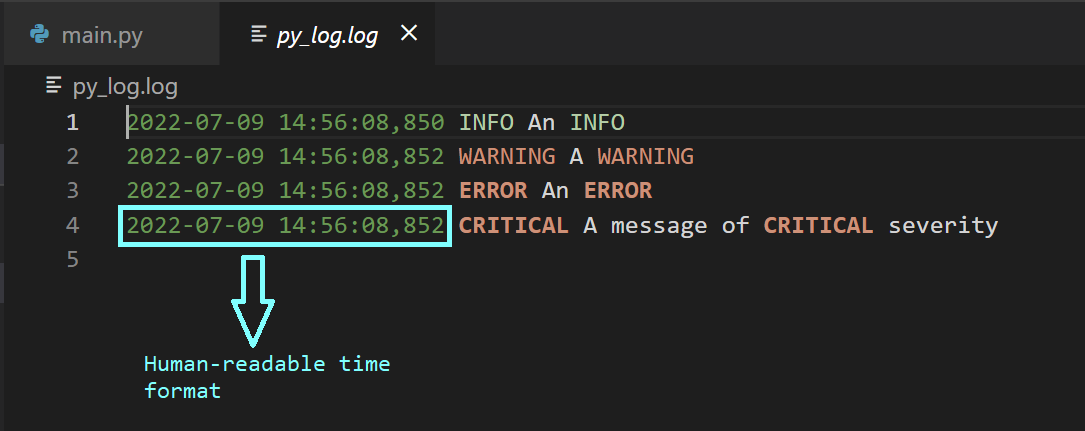
In addition to the above basic info, you may also want to record the timestamp at which a particular message was logged to make it easier to examine the logs. You can do this by specifying the format parameter in the constructor, as shown below.
logging.basicConfig(level=logging.INFO, filename="py_log.log",filemode="w",
                    format="%(asctime)s %(levelname)s %(message)s")
logging.debug("A DEBUG Message")
logging.info("An INFO")
logging.warning("A WARNING")
logging.error("An ERROR")
logging.critical("A message of CRITICAL severity")
There are many other log record attributes you can use to customize the way the messages appear in the log file. While setting up the root logger as explained above, please be sure to run logging.basicConfig() only once—typically at the beginning of the program before logging. Subsequent calls do not change anything unless you set the parameter force to True.
Logging Variables and Exceptions in Python
Now, let's modify the main.py file. Say, there are two variables, x and y, and we’d like to compute the value of x/y. We know that we’ll run into ZeroDivisionError when y = 0. We can handle this as an exception using the try and except blocks.
Next, we’d like to log the exception along with the stack trace. To do this, you can use logging.error(message, exc_info=True). Run the following code to see that the values of variables and the result are logged as INFO, indicating that the code works as expected.
x = 3
y = 4

logging.info(f"The values of x and y are {x} and {y}.")
try:
    x/y
    logging.info(f"x/y successful with result: {x/y}.")
except ZeroDivisionError as err:
    logging.error("ZeroDivisionError",exc_info=True)
Next, set the value of y to zero and run the module again.
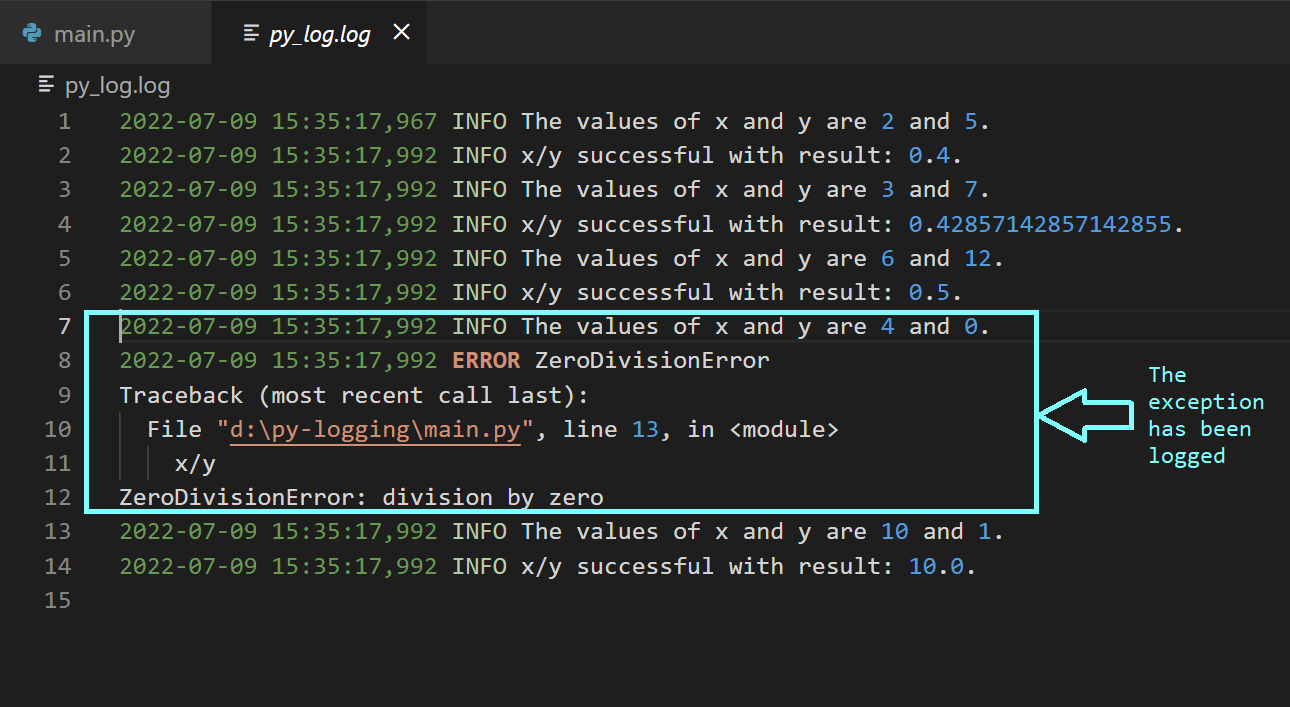
When you examine the log file pylog.log, you can see that an exception has been recorded along with the stack trace.
x = 4
y = 0

logging.info(f"The values of x and y are {x} and {y}.")
try:
    x/y
    logging.info(f"x/y successful with result: {x/y}.")
except ZeroDivisionError as err:
    logging.error("ZeroDivisionError",exc_info=True)
As a next step, let's modify our code to have a list of x and y values for which we’d like to compute the quotient x/y. To log an exception, you can also use logging.exception(<message>).
x_vals = [2,3,6,4,10]
y_vals = [5,7,12,0,1]

for x_val,y_val in zip(x_vals,y_vals):
    x,y = x_val,y_val
    logging.info(f"The values of x and y are {x} and {y}.")
    try:
        x/y
        logging.info(f"x/y successful with result: {x/y}.")
    except ZeroDivisionError as err:
        logging.exception("ZeroDivisionError")
Upon running the above code, you’ll see that the log file now contains information on those events when the execution was successful, as well as the error when the exception occurred.
Customizing Logging with Custom Loggers, Handlers, and Formatters
Next, let's refactor the existing code. We’ll define a separate function test_division.
def test_division(x,y):
    try:
        x/y
        logger2.info(f"x/y successful with result: {x/y}.")
    except ZeroDivisionError as err:
        logger2.exception("ZeroDivisionError")
We’ll have the above function definition inside the test_div module. In the main module, we’ll only have the function calls. Let’s configure custom loggers in both the main and the test_div modules.
This is explained in the following code snippets.
▶️ Configuring a custom logger for the test_div module
import logging

logger2 = logging.getLogger(__name__)
logger2.setLevel(logging.INFO)

# configure the handler and formatter for logger2
handler2 = logging.FileHandler(f"{__name__}.log", mode='w')
formatter2 = logging.Formatter("%(name)s %(asctime)s %(levelname)s %(message)s")

# add formatter to the handler
handler2.setFormatter(formatter2)
# add handler to the logger
logger2.addHandler(handler2)

logger2.info(f"Testing the custom logger for module {__name__}...")

def test_division(x,y):
    try:
        x/y
        logger2.info(f"x/y successful with result: {x/y}.")
    except ZeroDivisionError as err:
        logger2.exception("ZeroDivisionError")
▶️ Configuring a custom logger for the main module
import logging
from test_div import test_division

# get a custom logger & set the logging level
py_logger = logging.getLogger(__name__)
py_logger.setLevel(logging.INFO)

# configure the handler and formatter as needed
py_handler = logging.FileHandler(f"{__name__}.log", mode='w')
py_formatter = logging.Formatter("%(name)s %(asctime)s %(levelname)s %(message)s")

# add formatter to the handler
py_handler.setFormatter(py_formatter)
# add handler to the logger
py_logger.addHandler(py_handler)

py_logger.info(f"Testing the custom logger for module {__name__}...")

x_vals = [2,3,6,4,10]
y_vals = [5,7,12,0,1]

for x_val,y_val in zip(x_vals,y_vals):
    x,y = x_val, y_val
    # call test_division
    test_division(x,y)
    py_logger.info(f"Call test_division with args {x} and {y}")
Let's parse what the above code for configuring custom loggers does.
As a first step, we set up the logger and the logging level. logging.getLogger(name) returns the logger with that name if it exists; otherwise, it creates the name logger. In practice, you’ll set the name of the logger to the special variable __name__, which corresponds to the name of the module. We assign the logger object to a variable. We then set the desired logging level using logging.setLevel(level).
Next, we configure a handler. As we’d like to log events to a file, we configure a FileHandler. logging.FileHandler(filename) returns a file handler object. In addition to the name of the log file, you may optionally specify the mode. In this example, we set the mode to write. There are other handlers such as StreamHandler, HTTPHandler, SMTPHandler, and more.
We then create a formatter object using the syntax: logging.Formatter(format). In this example, we place %(names)s, the name of the logger (a string), before the log record format we had earlier.
Next, we add the formatter to the handler using <handler>.setFormatter(<formatter>). Finally, we add the handler to the logger object using <logger>.addHandler(<handler>).
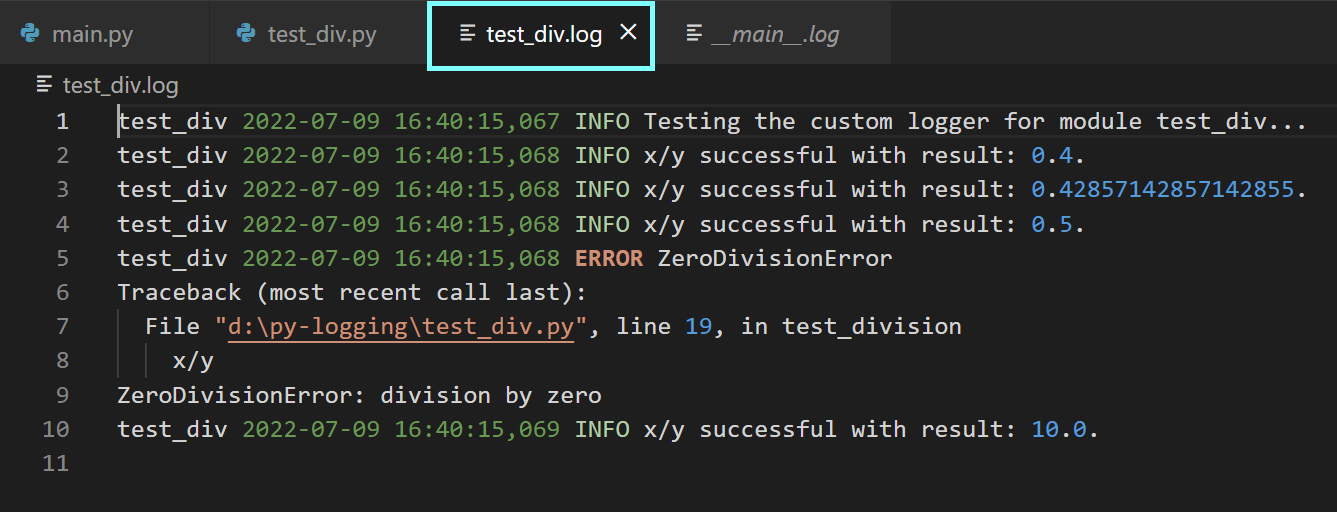
You can then run the main module and examine the generated log files.
Best practices for logging in Python
So far, we’ve covered how to log variables and exceptions and set up custom loggers. Next, let’s enumerate some of the best practices for logging.
Set the optimal logging level: Logs are helpful only when you can use them to track down important errors that need to be fixed. Depending on the specific application, be sure to set the optimal logging level. Logging too many events can be suboptimal from a debugging viewpoint, as it’s difficult to filter through the logs to identify errors that require immediate attention.
Configure loggers at the module level: When you’re working on an application with multiple modules, you should consider configuring a logger for each module. Setting the name of the logger to
__name__helps identify the modules in your application that have issues you need to fix.Include timestamps and ensure consistent formatting: Always include timestamps in logs, as they’re helpful in tracing back to when an error occurred. Format your logs consistently across the different modules in your application.
Rotate the log files to facilitate easier debugging: When working on large applications with several modules, it’s likely that your log files will be very large in size. As it’s challenging to filter through such large logs to detect errors, you should consider rotating the log files. You can do this by using the
RotatingFileHandlerwith the syntax:logging.handlers.RotatingFileHandler(filename, maxBytes,backupCount). When the current log file reaches the sizemaxBytes, the subsequent logs roll over to the next files depending on the value ofbackupCount. If you set thebackupCountto K, you get K backup files.
Benefits and limitations of logging in Python
Now that we’ve learned the basics of logging in Python let’s go over the benefits and some potential downsides of logging.
We’ve seen how using logging in Python lets us maintain logs for the various modules in an application. We can also configure and customize logging as needed. However, this is not without disadvantages. Even when you set the logging level to warning or any level above it, your log files could quickly grow in size when you maintain persistent logs across all runs of the application. Therefore, it becomes challenging to use the log files for debugging.
In addition, examining error logs is difficult, especially when the error messages do not provide sufficient context. When you do logging.error(message) without setting exc_info to True, it’s difficult to examine the root cause of the problem if the messages are not very helpful.
While logging only provides diagnostic information on what needs to be fixed in your application, an application performance monitoring tool like Sentry can provide more granular information that can help you troubleshoot your applications with ease and also fix performance issues.
In the next section, we'll go over how you can integrate Sentry into your Python application to simplify the debugging process.
Integrating Sentry in your Python application
You can install Sentry’s Python SDK using the pip package manager.
pip install sentry-sdkAfter you’ve installed the SDK, you can import sentry_sdk and add the following lines of code to configure monitoring for your Python application:
import sentry_sdk
sentry_sdk.init(
     dsn="<your-dsn-key-here>",
     traces_sample_rate=0.85,
)
As seen above, you’d need the dsn to set up monitoring. DSN stands for Data Source Name and it’s where Sentry’s SDK will send the events in your application. You can find your DSN key by navigating to, Your-Project > Settings > Client Keys (DSN).
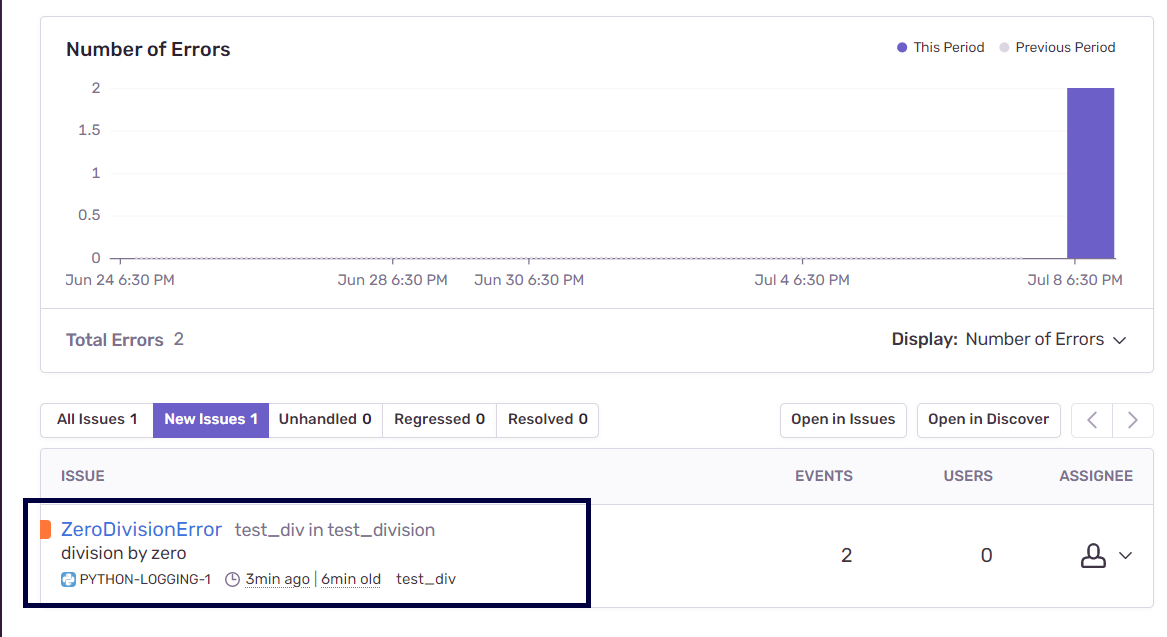
After you’ve run the Python application, you can head over to Sentry.io and open the project’s dashboard. You should be able to see information on the number of errors logged and the issues in your application. In this example, the exception corresponding to the ZeroDivisionError has been logged.
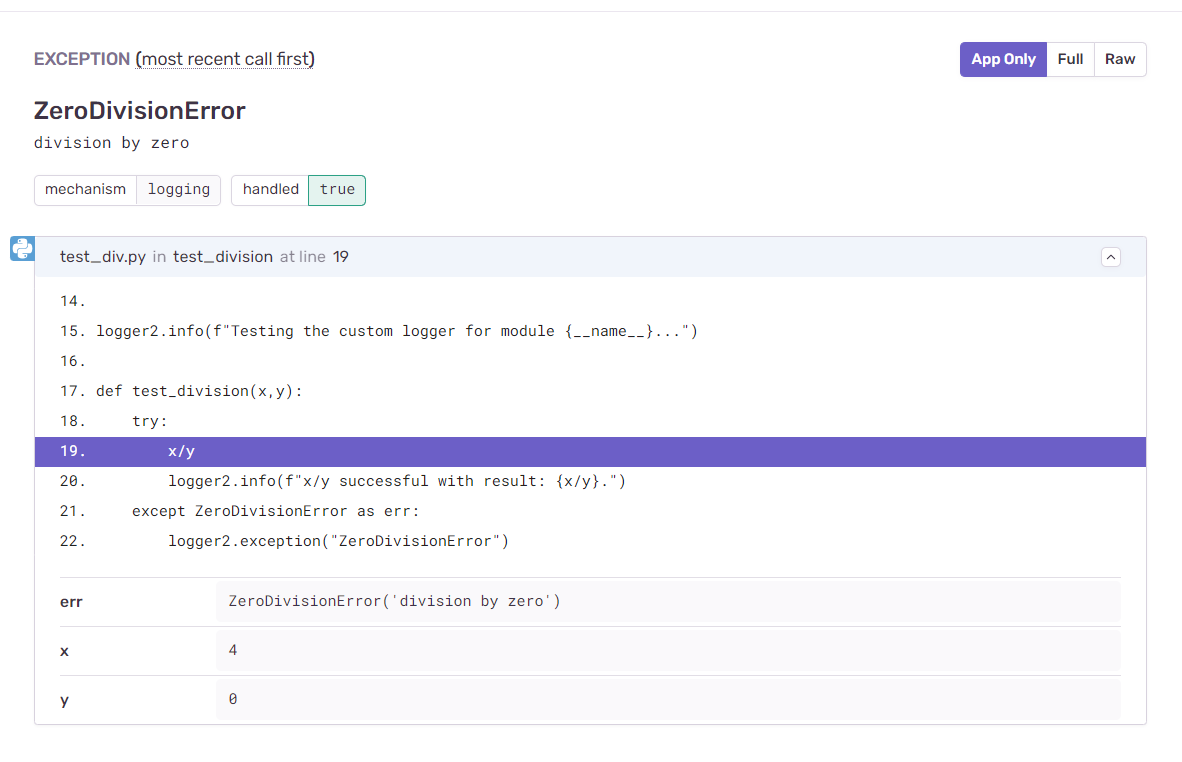
Upon inspecting the issue in detail, you can see that Sentry provides granular information on where the exception occurred and the arguments x and y that cause the exception to occur.
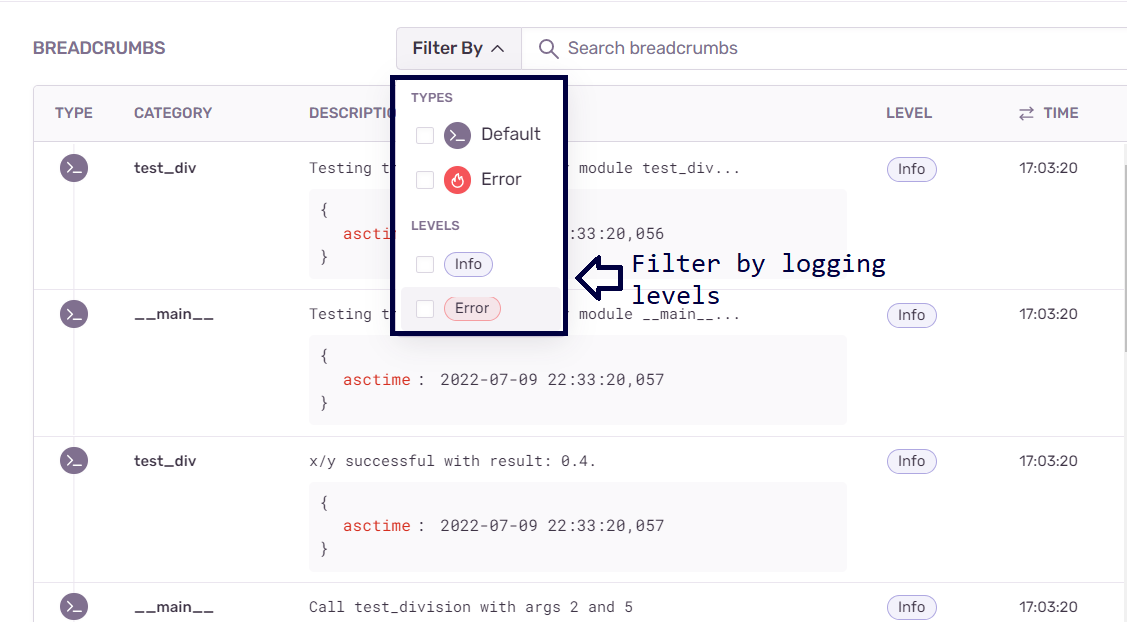
Navigating further down, you’ll see that you have the logs corresponding to info and error. When you configure error monitoring with Sentry, there is an implicit integration with the logging module. Recall that we set the logging level to info. Therefore, Sentry records all events that are at the level info and above as breadcrumbs that facilitate easy tracing of errors.
As opposed to examining large log files for potential errors and troubleshooting info, Sentry allows you to filter issues by level, such as info and errors. This allows you to prioritize the issues by their severity level and also leverage breadcrumbs to track down the source of the issues.
In this example application, we’ve handled ZeroDivisionError as an exception. In larger projects, even if we don’t implement such exception handling, Sentry automatically provides diagnostic information on the presence of unhandled exceptions. You can also track performance issues in code with Sentry.
You can find the code for this tutorial in this GitHub repo.
Sending structured logs
Sentry can also store logs from your app in a structured format. Instead of using a single text message as a log, a structured log allows you to split your message into multiple properties (key-value pairs). This allows you to filter and search log messages easily in the Sentry web interface.
Check out our docs for an overview of structured logs or learn how to set them up in Python. We also have a nifty quickstart guide for Python logging if you're just looking to get up and running with Sentry.
Let’s look at a code example. The code relies on Sentry Python SDK version 2.35.0 or later, when structured logging became available via a stable option.
First, in the Sentry initialization, you need to enable logging (note the enable_logs=True line):
import sentry_sdk
from sentry_sdk import logger as sentry_logger
from typing import Optional

sentry_sdk.init(
    dsn="https://yourdsn.ingest.us.sentry.io/number",
    traces_sample_rate=1,
    enable_logs=True,
)
Next, write a log entry with some key–value pairs using sentry_logger.error. In this example, we emit a log when a divide-by-zero occurs:
def divide(numerator: int, denominator: int) -> Optional[float]:
    try:
        return numerator/denominator
    except Exception:
        sentry_logger.error(
            "Error in divide with Sentry logging",
            attributes={
                "numerator": numerator,
                "denominator": denominator,
            },
        )
        return None

print(divide(5,1))
print(divide(5,0))
When the divide-by-zero happens, a log is sent to Sentry. Structured logs aren’t just for errors, you can use all levels: trace, debug, info, warning, error, and fatal.
Structured logging also integrates with the standard Python logging module. By default, logs at INFO and above are sent to Sentry (subject to your logger configuration). To include structured fields, place them directly in extra={...} so Sentry can promote them to top-level searchable attributes.
For the second example, let’s rewrite the previous log entry using standard logging this time (note the lines marked NEW):
import sentry_sdk
from sentry_sdk.integrations.logging import LoggingIntegration  # NEW
from typing import Optional
import logging

sentry_sdk.init(
    dsn="https://yourdsn.ingest.us.sentry.io/number",
    traces_sample_rate=1,
    enable_logs=True,
    integrations=[LoggingIntegration(sentry_logs_level=logging.WARNING)]  # NEW
)

def divide(numerator: int, denominator: int) -> Optional[float]:
    try:
        return numerator/denominator
    except Exception:
        logging.error(
            "Error in divide with Python logging",
            extra={  # NEW
                "numerator": numerator,
                "denominator": denominator,
            },
        )
        return None

print(divide(5,1))
print(divide(5,0))
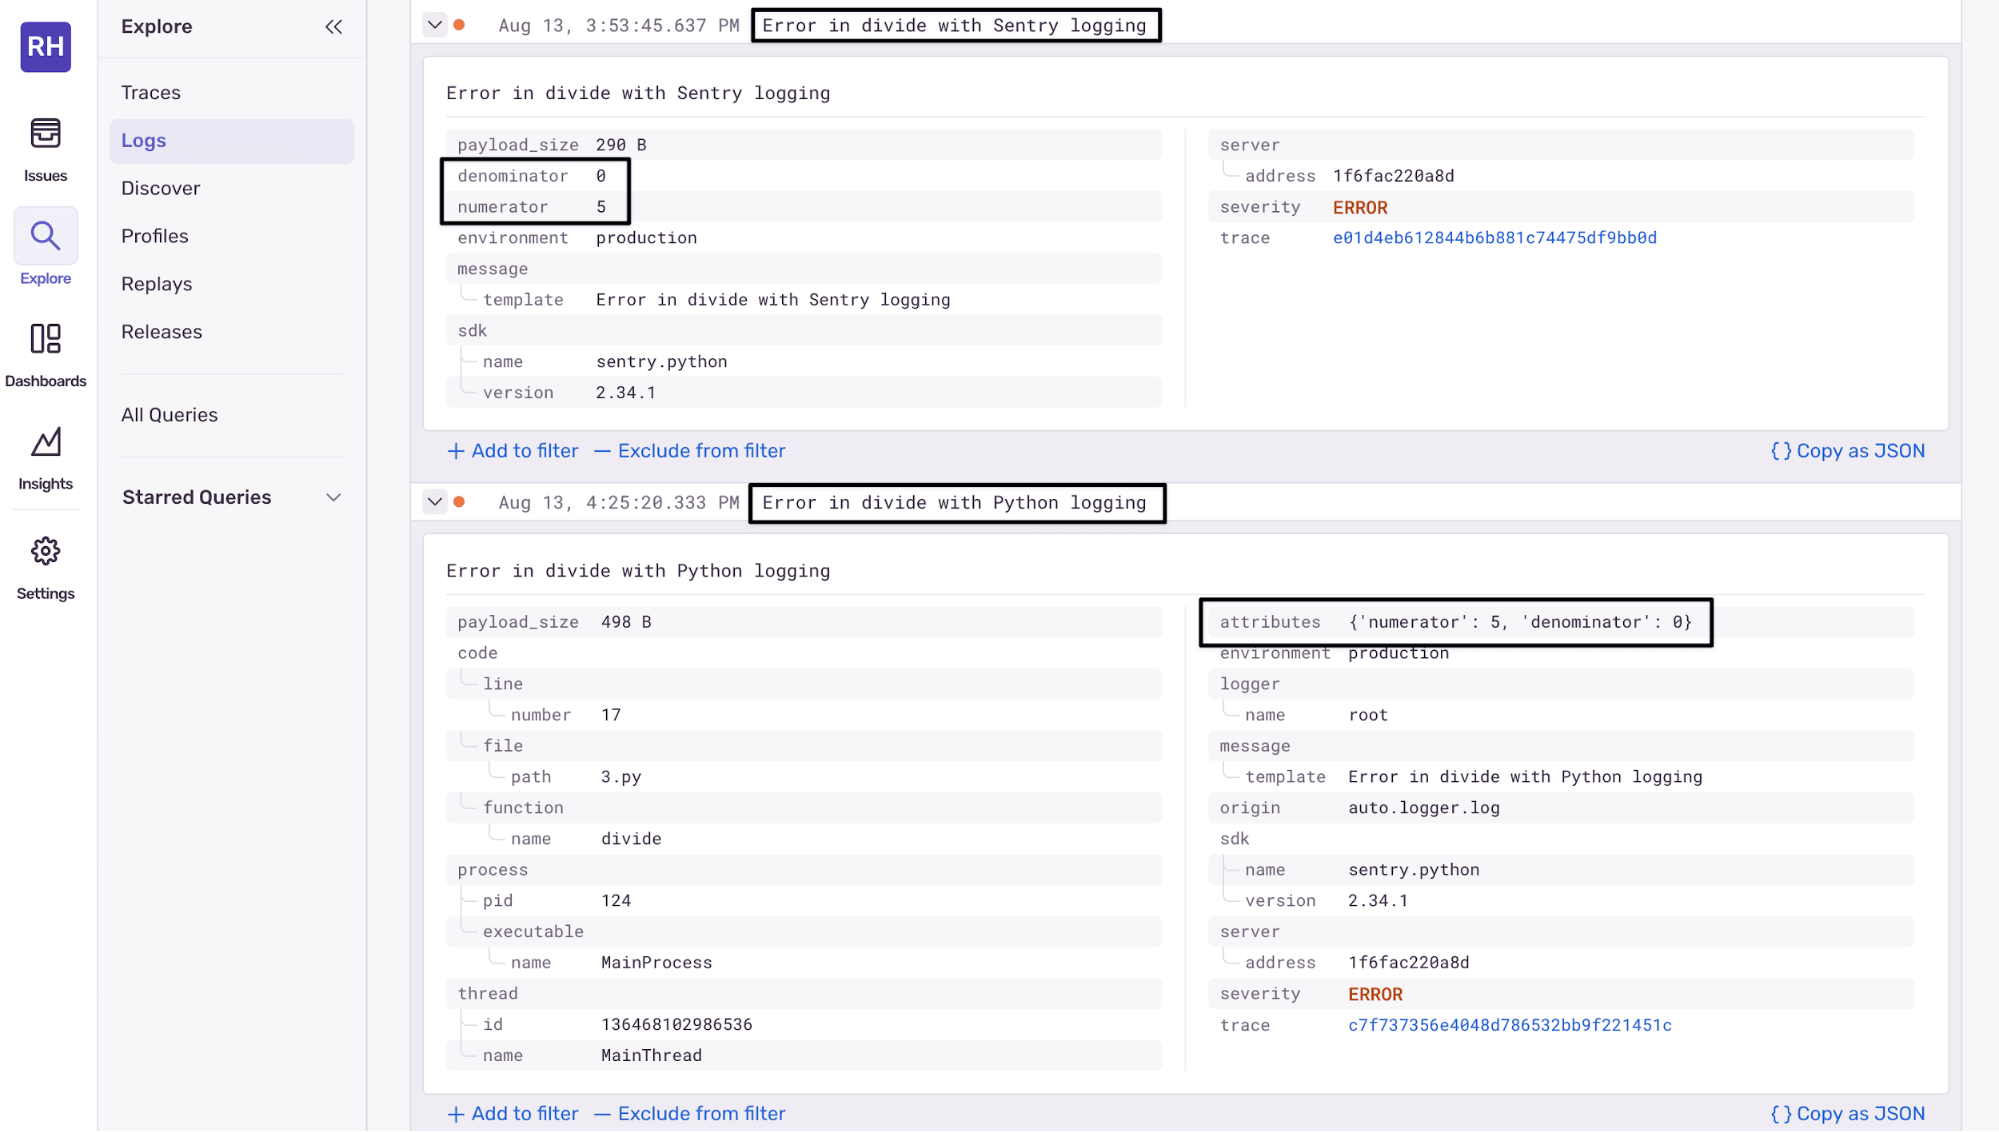
When using standard Python logging with Sentry, any fields provided in the extra dictionary are automatically promoted to top-level attributes on the log entry, making them searchable and filterable in Sentry. Let’s see what these examples look like in Sentry's Logs tab.
Sentry structured logs
The first log, which uses sentry_logger.error directly, displays the attributes as top-level fields. It has both a normal text message and numerator and denominator attributes, so you can search and filter using them (as shown in the attributes list on the right of the screen).
The second log, which uses the standard Python logging.error, also displays the extra fields as top-level attributes in Sentry, meaning you still get the benefits of structured logging for filtering and searching.
You can filter Sentry logs by text, property, severity level, timestamp, or structured properties to find more information about an error.
Monitoring Your Python Application With Sentry
In this tutorial, you’ve learned how to set up logging using Python’s built-in logging module, configure the root and custom loggers, and apply logging best practices. You’ve also seen how you can leverage Sentry to monitor your Python applications – to get information on performance issues and other errors – while using all the features of the logging module.
Sign up for Sentry for seamless Python debugging.
