June Product Updates for Sentry
June Product Updates for SentryGet ready for another round of new releases that will help take your performance and error troubleshooting to the next level. Over the past month of June, we've launched a variety of new features that give you more flexibility in managing code coverage, help get to root cause faster, and streamline your everyday usage of Sentry. Here’s the list:
New Codecov CLI
Tracking how your test coverage evolves with each code change is super important. To provide more flexibility and ease for you to do this with your Codecov platform, we've rolled out the new Codecov Command Line Interface (CLI). Now, you can effortlessly configure code coverage settings directly from your terminal. In addition, the CLI allows you to identify gaps in your test coverage without waiting for your continuous integration (CI) pipeline to finish or switching between multiple browser tabs. But that's not all - our Codecov CLI goes above and beyond, allowing you to seamlessly upload your coverage reports to Codecov and access all of the latest features, including Local Upload, Global Upload Token, and PR Base Picking. With all of this at your disposal, you'll have more control over your code coverage and be able to make better decisions to enhance the quality and reliability of your software. Read more here.
Crons Timeline View
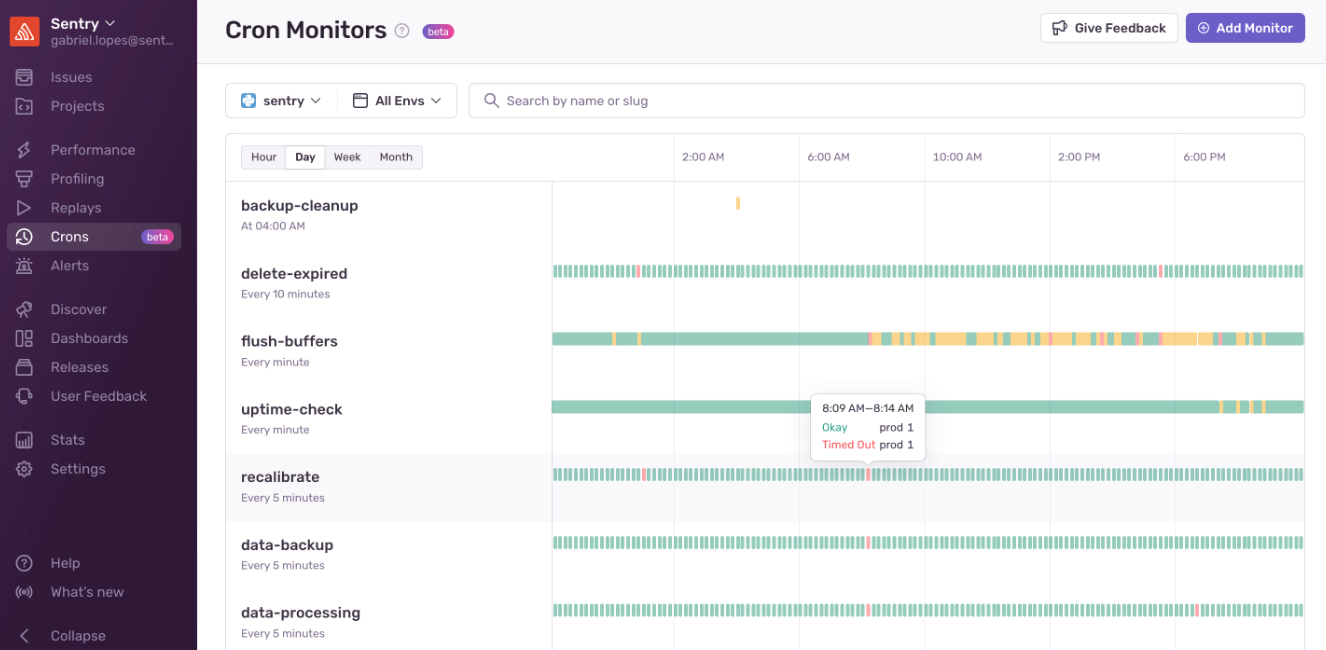
Keeping track of your Cron Monitors’ status has never been simpler thanks to the latest addition of our Crons timeline view. This new feature provides a comprehensive and intuitive overview of all your check-ins within a specific timeframe, whether it's the last hour, day, week, or month. Now, with a quick glance, you can view job status across multiple monitors to identify any failed or missed job executions that may require your immediate attention.
Link Stack Traces to Source Code in Java
For years, Javascript developers using Sentry have benefited from the ability to link their source code to stack traces, enabling them to quickly identify and resolve application errors. Meanwhile Java developers have sat longingly on the sidelines… until now. With our recent release of Java Source context for Android, Backends, and Desktop we have empowered Java developers to easily connect their source code with stack traces. We’ve rolled out automated set-up through our Gradle and Maven plugins in addition to the manual set-up using our sentry-cli. To learn more check out our docs for Java and Android.
Improved SQL readability
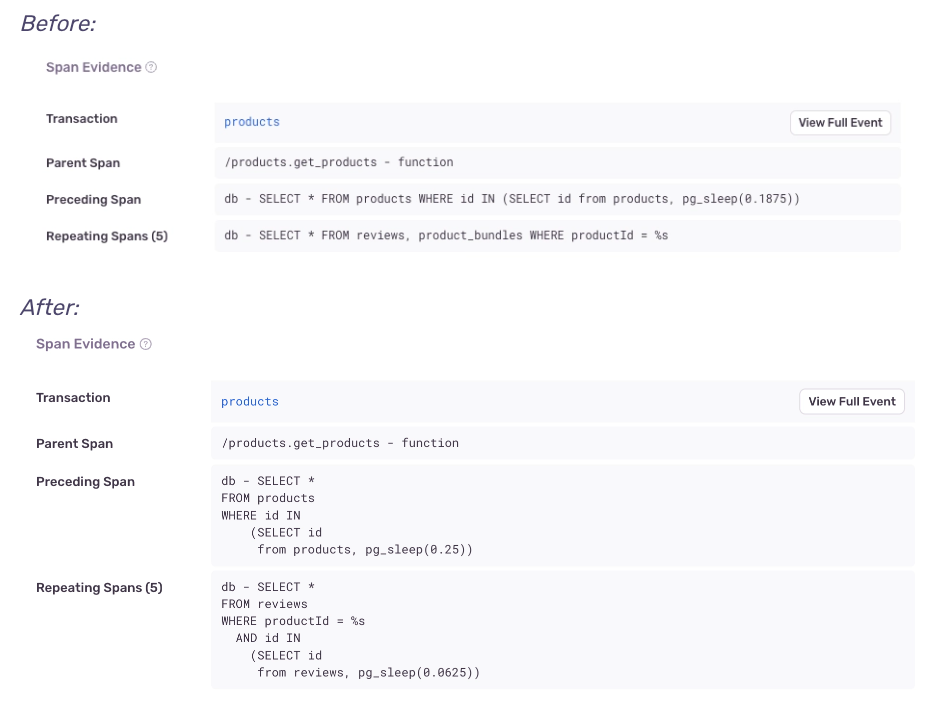
SQL queries are displayed throughout the Sentry platform, including with issue breadcrumbs, performance issues, and transactions. Until now, this displayed SQL did not follow conventional formatting, making it difficult to read and understand your queries. With a recent update to our UI, we now format all displayed SQL statements as you’d expect. You can see the difference in the screen grab below.
If you want more, our changelog has the running list of all product and feature releases. You can also drop us a line on GitHub, Twitter, or our Discord. And if you’re new to Sentry, you can try it for free today or request a demo to get started.


