Introducing webvitals.com: Find out what’s slowing down your site
Introducing webvitals.com: Find out what’s slowing down your site
Developers don’t need another “run this tool, stare at a number, and feel bad about it” website. So we built something different.
WebVitals helps you analyze, optimize, and ship faster websites, all in one place. Built by the same folks who obsess over stack traces and slow queries, it connects the dots between performance metrics and what’s actually slowing your users down.
In one place, you can:
See how real users experience your site
Spot the biggest slowdowns instantly
Get clear next steps (no jargon, no guessing)
How webvitals.com works
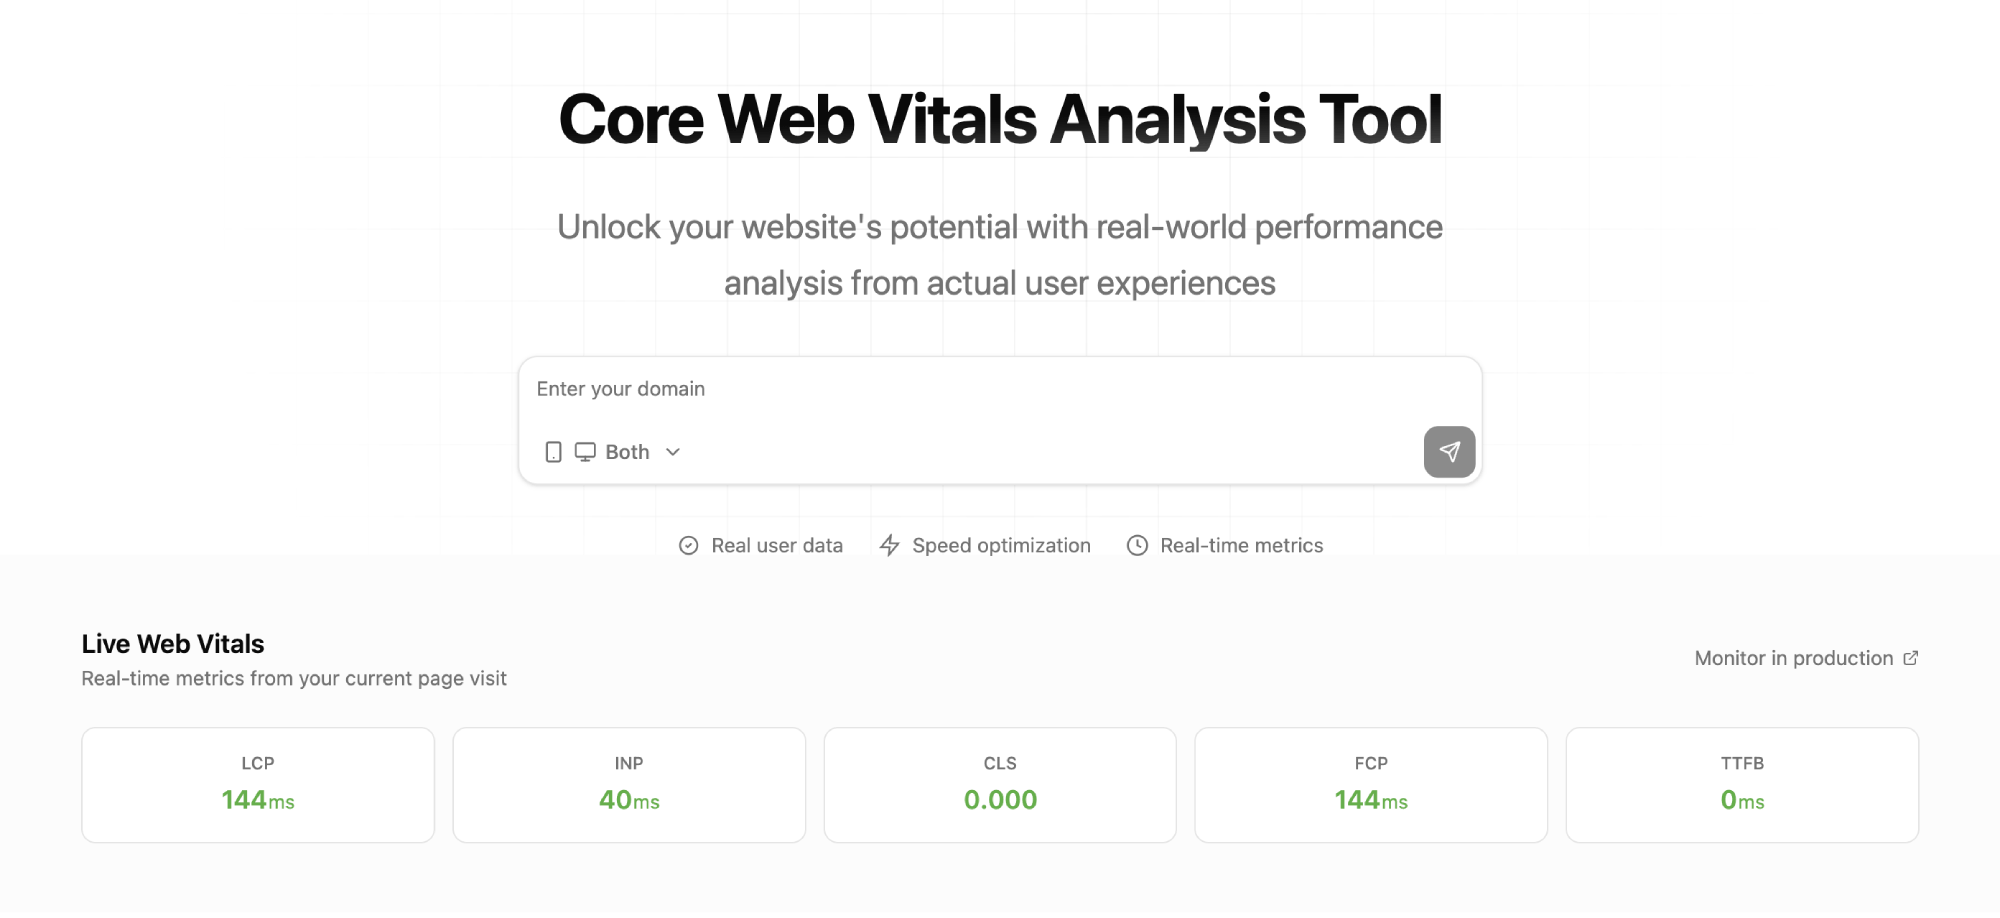
Enter your domain, hit go, and we’ll take it from there. Under the hood, WebVitals runs a couple tool calls using the Vercel AI SDK:
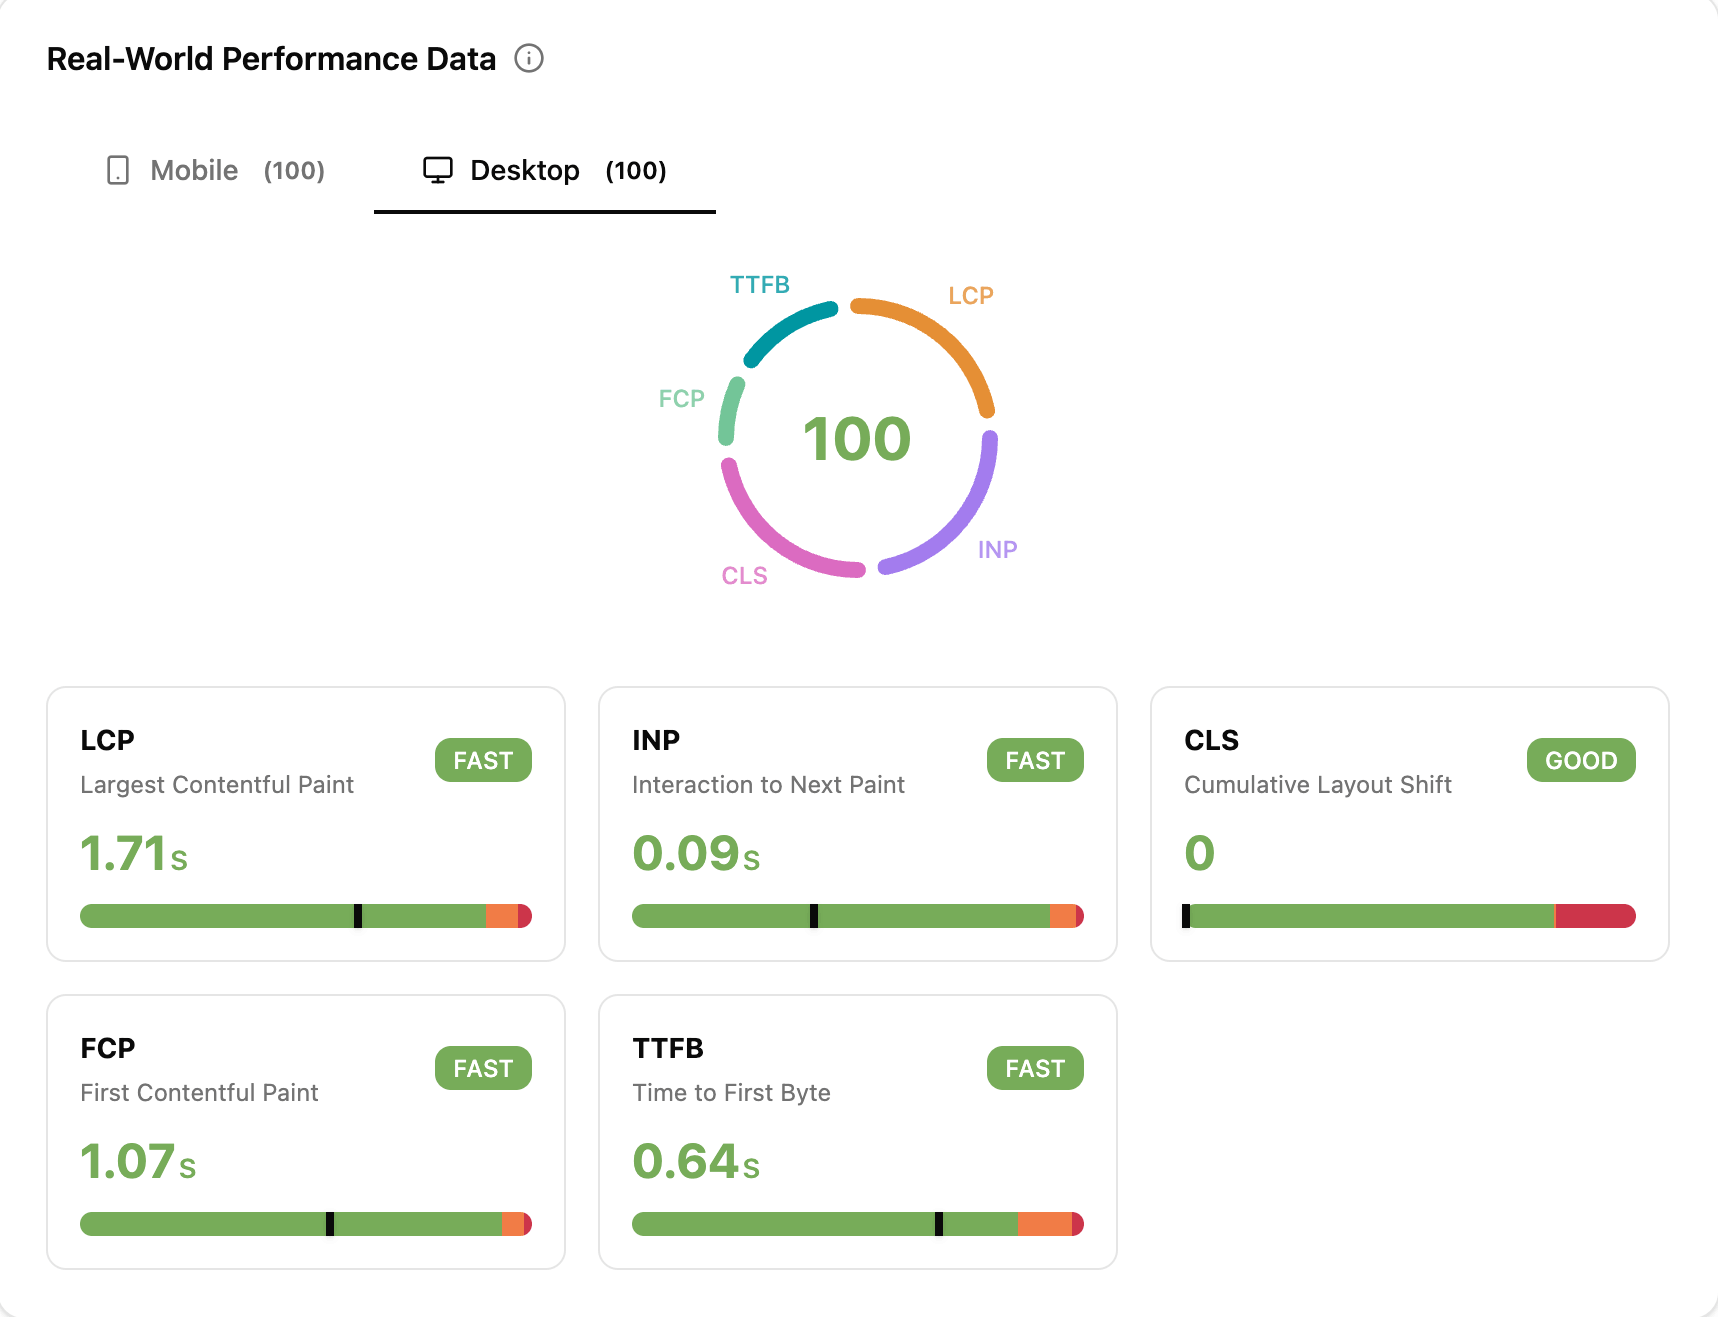
One to Google’s PageSpeed API - To pull real user performance data from the last 28 days, so called CrUX data
One to Cloudflare’s URL Scanner - To detect your site’s technology stack
Those results get combined and analyzed to surface the stuff that actually matters. You’ll see what’s solid and where things could use a little love. Each report provides clear, contextual steps for improving your metrics, using CrUX data for additional guidance. CrUX data is the 75th percentile of metrics from actual usage data from real users.
The Core Web Vitals report
You get real, actionable insight into your Core Web Vitals:
Largest Contentful Paint (LCP) – how fast your main content loads
Interaction to Next Paint (INP) – how responsive your page feels when users interact
First Contentful Paint (FCP) – when something finally shows up
Time to First Byte (TTFB) – how long it takes your server to respond
Cumulative Layout Shift (CLS) – how stable your layout is (or isn’t)
Each metric page breaks down which browsers track it, what “good” scores look like, and why it matters. We even added motion animations (made with the Motion animation library, because why not) to make all that data a little easier on the eyes.
Why Core Web Vitals matter
Core Web Vitals are a reflection of what real people feel when they use your site.
If your page takes too long to paint, shifts around while loading, or lags when someone clicks a button, users notice, and they bounce. A slow site can hurt your more than just CWV metrics. It affects your search engine rankings, conversion rate, and in the long run your revenue.
These metrics turn vague “feels slow” feedback into measurable, fixable problems. They’re the closest thing to a shared language between your performance graphs and your users’ frustration levels.
Go deeper with Sentry
Tools like Google’s PageSpeed Insights and Lighthouse are great for public pages, but they don’t cover everything. Pages hidden behind logins like your authenticated dashboards, admin panels, or internal tools more often than not require other tools to examine, and that’s where Sentry enters the picture.
With Sentry’s Web Vitals dashboard, you can track performance across every page of your app, not just the public ones. Sentry has an SDK for just about every language/framework. You’ll see detailed breakdowns with real user data, so you can understand and fix what’s slowing you down.
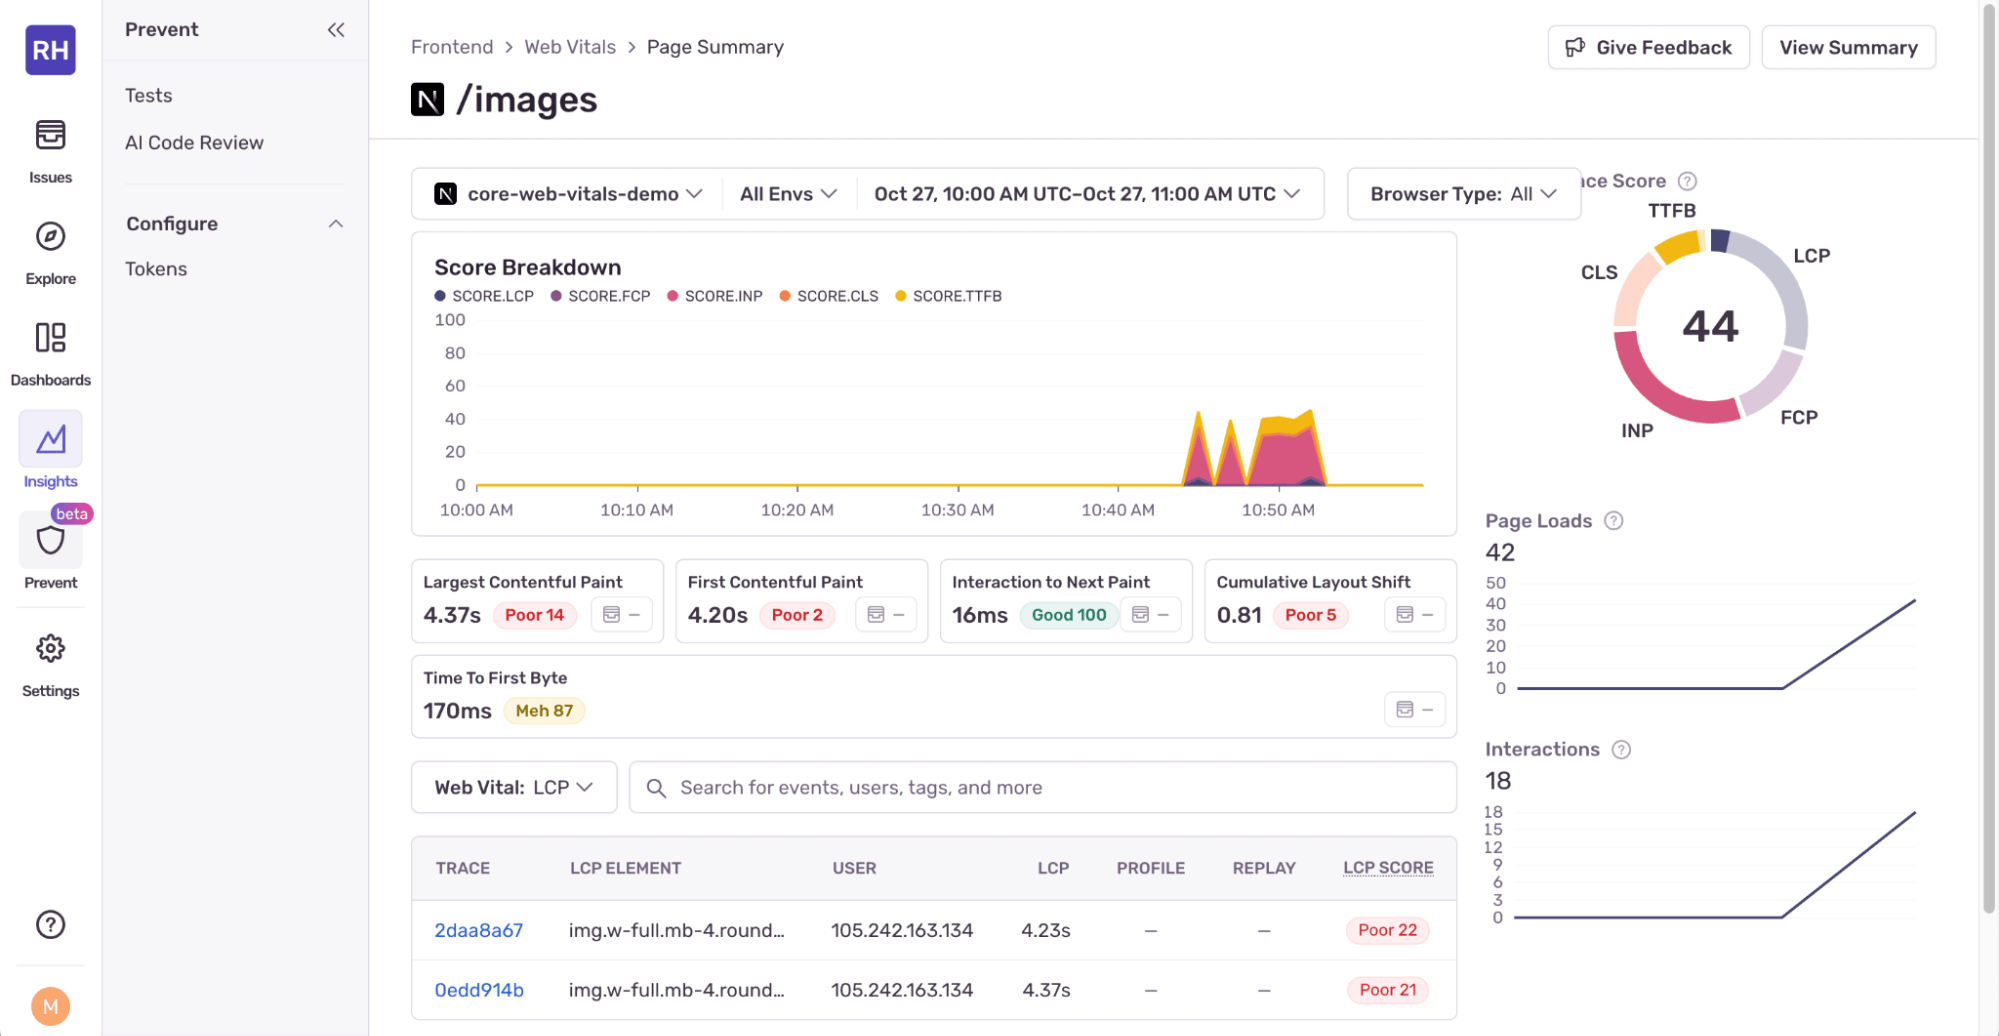
For example, the following Next.js image gallery app has some performance issues:
It loads slowly and shows a blank page while the image data is being fetched. The hero image also causes a cumulative layout shift (CLS).
To fix these issues, you can quickly set up and configure Sentry in your Next.js application to start capturing performance issues by running npx @sentry/wizard@latest -i nextjs within your project, then follow the installation wizard, which guides you through the whole setup process.
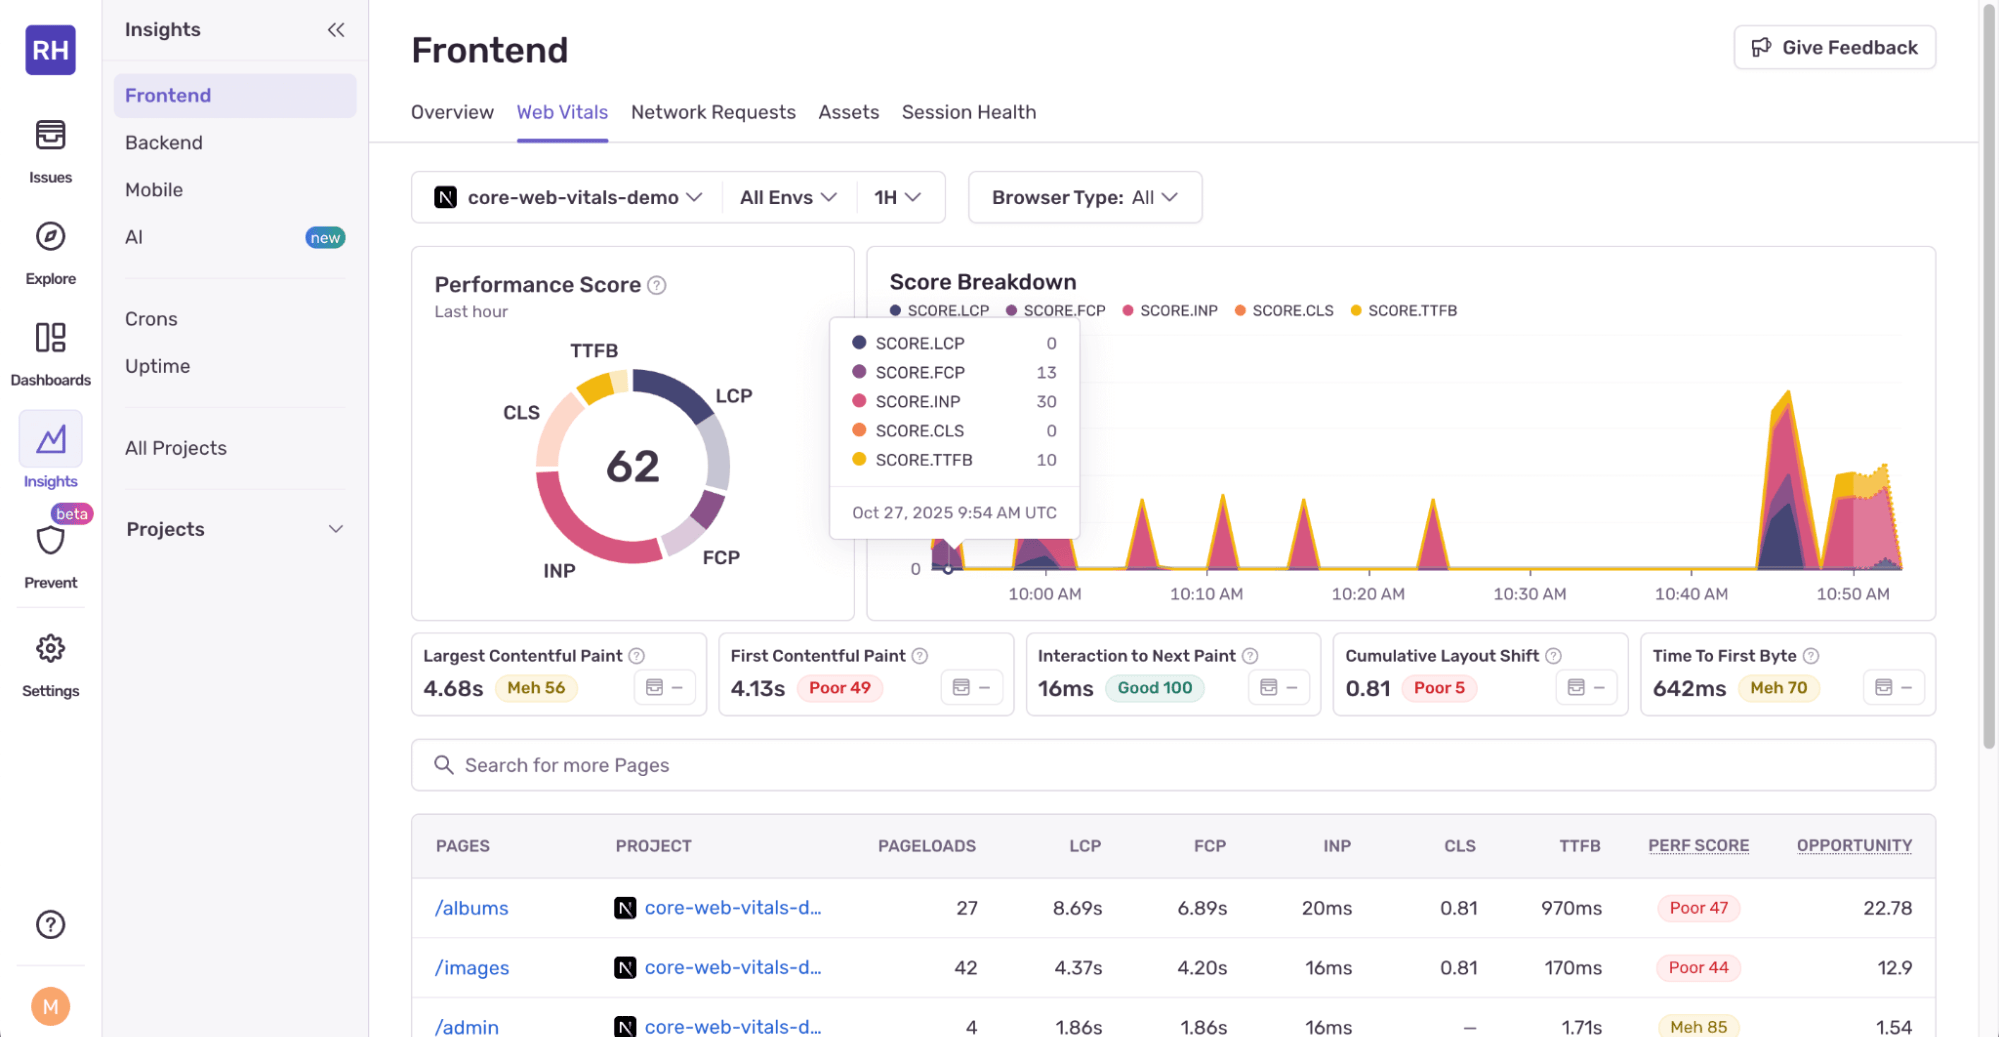
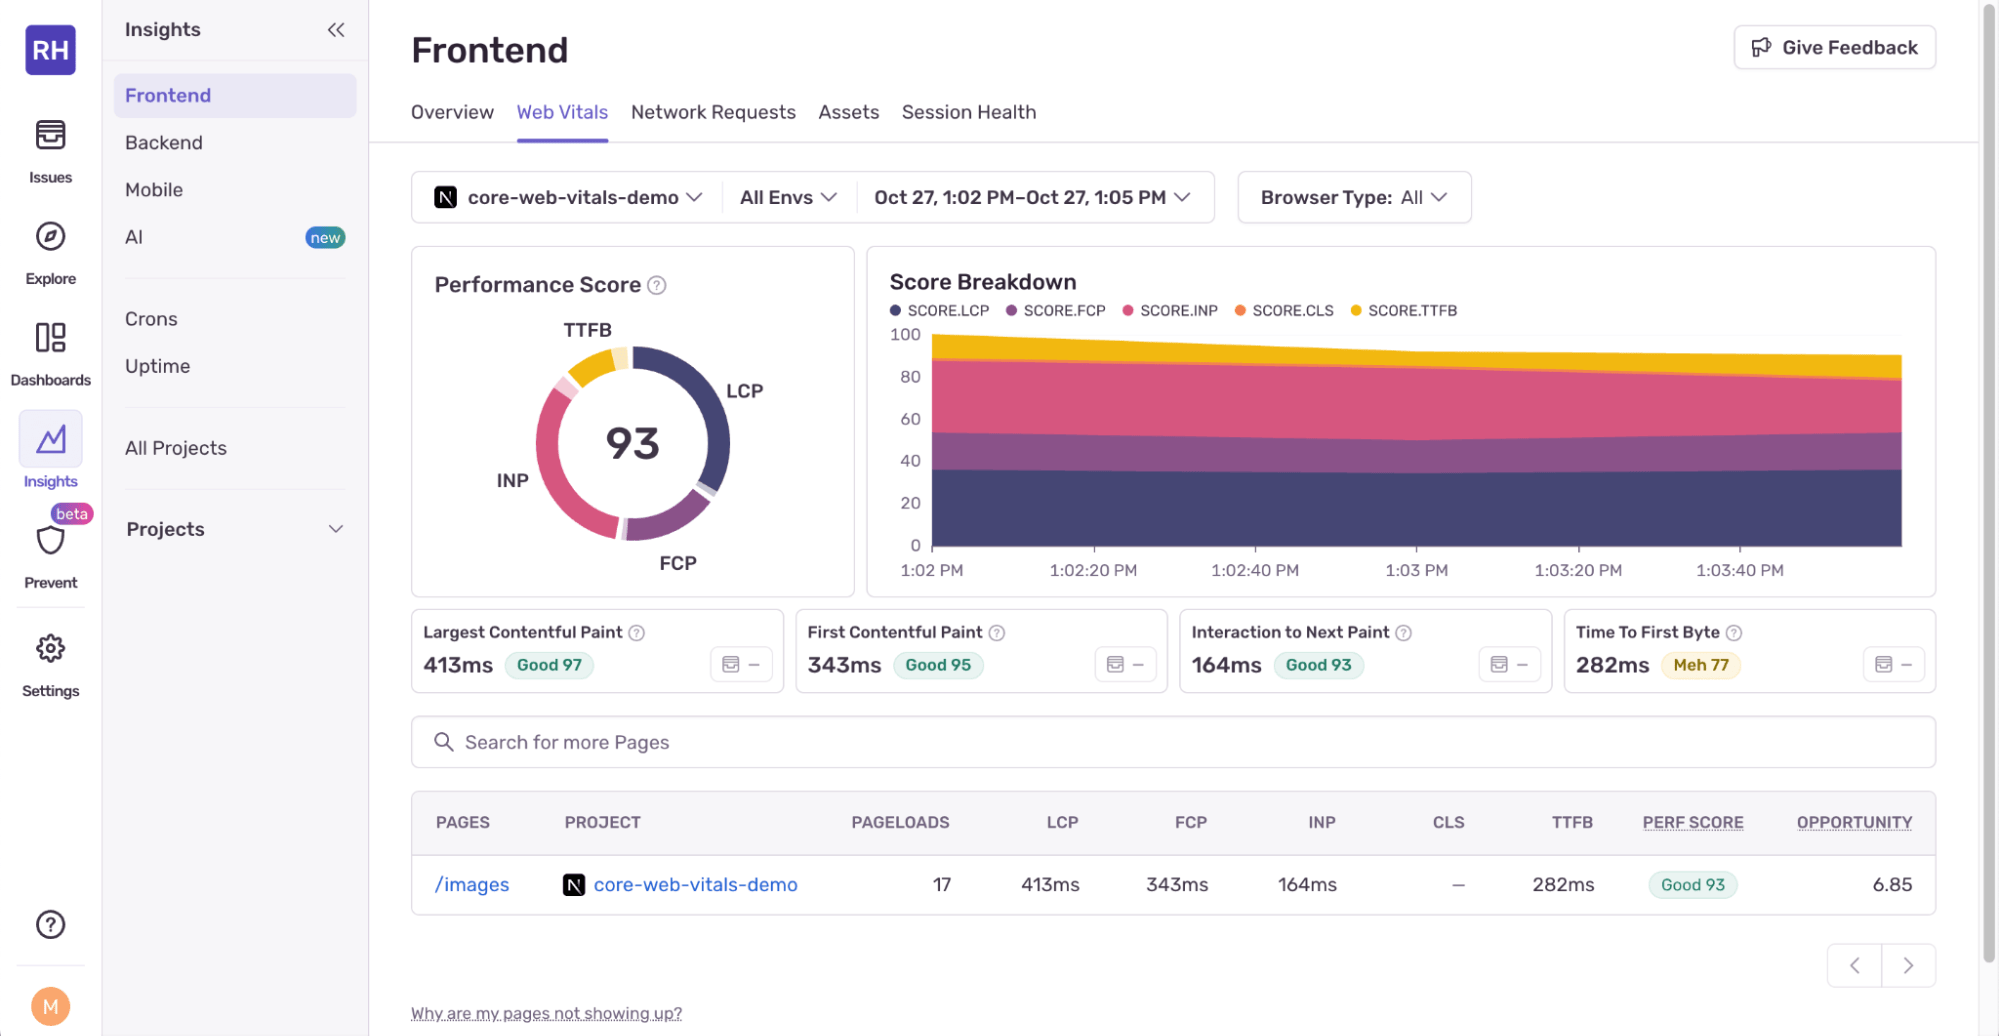
Once you’re done setting it up, the Web Vitals page in Sentry is a great starting point for investigating poor Web Vitals and figuring out which pages are affecting your web performance the most.
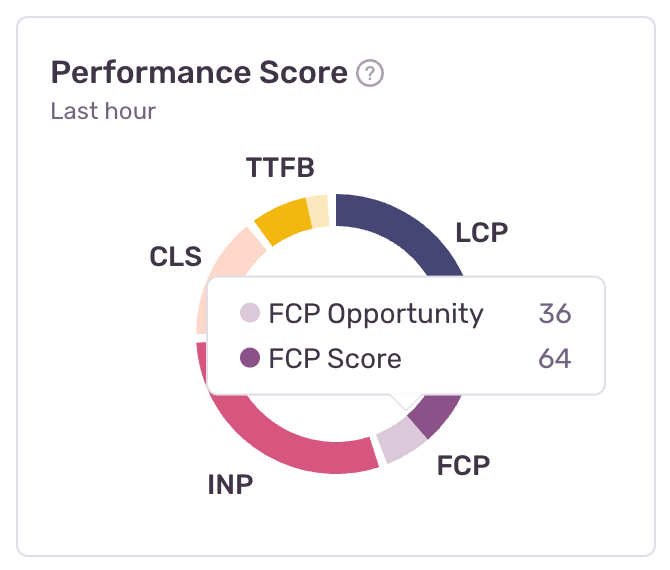
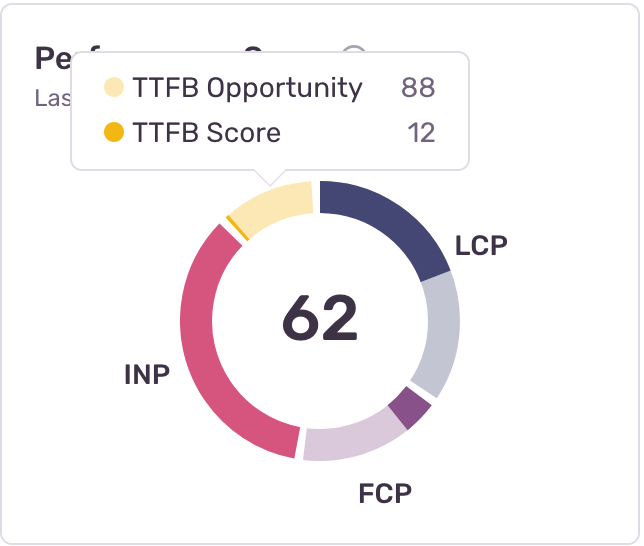
The Performance Score ring summarizes the overall perceived performance of your app. The Core Web Vitals metrics make up the ring and show their relative weight and impact on the score. Hovering your mouse over a section of the ring shows you the score and opportunity for that metric.
The opportunity is the difference between the current score and the maximum possible score (which is 100) for that metric.
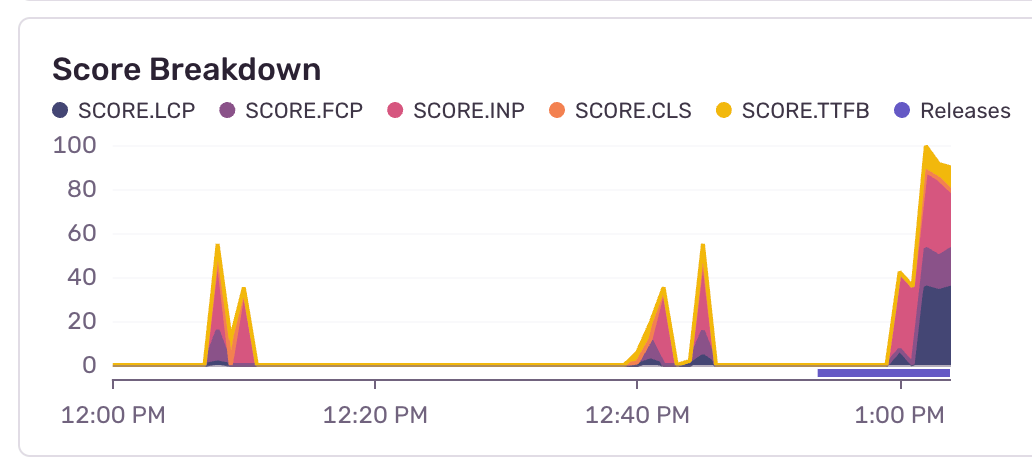
The Score Breakdown to the right of the Performance Score shows an area chart of your Performance Score over time, which makes it easy to track core web vitals over time and identify regressions. The filters at the top of the area chart let you filter by environment, time range, and browser type.
The core web vitals are shown below the Performance Score. The metric values are shown in seconds or milliseconds. The performance score is also displayed and color coded: good is 90+, meh is 50-90, and bad is below 50. The table at the bottom of the page shows the core web vitals per page.
Click on a page route in a table row to get web vitals for that page.
The table at the bottom of this page shows traces where the web vitals were measured as well as the source element for the largest contentful paint (LCP), which helps you find the lines of code causing the slowdown. You can filter by web vital or search for a specific trace.
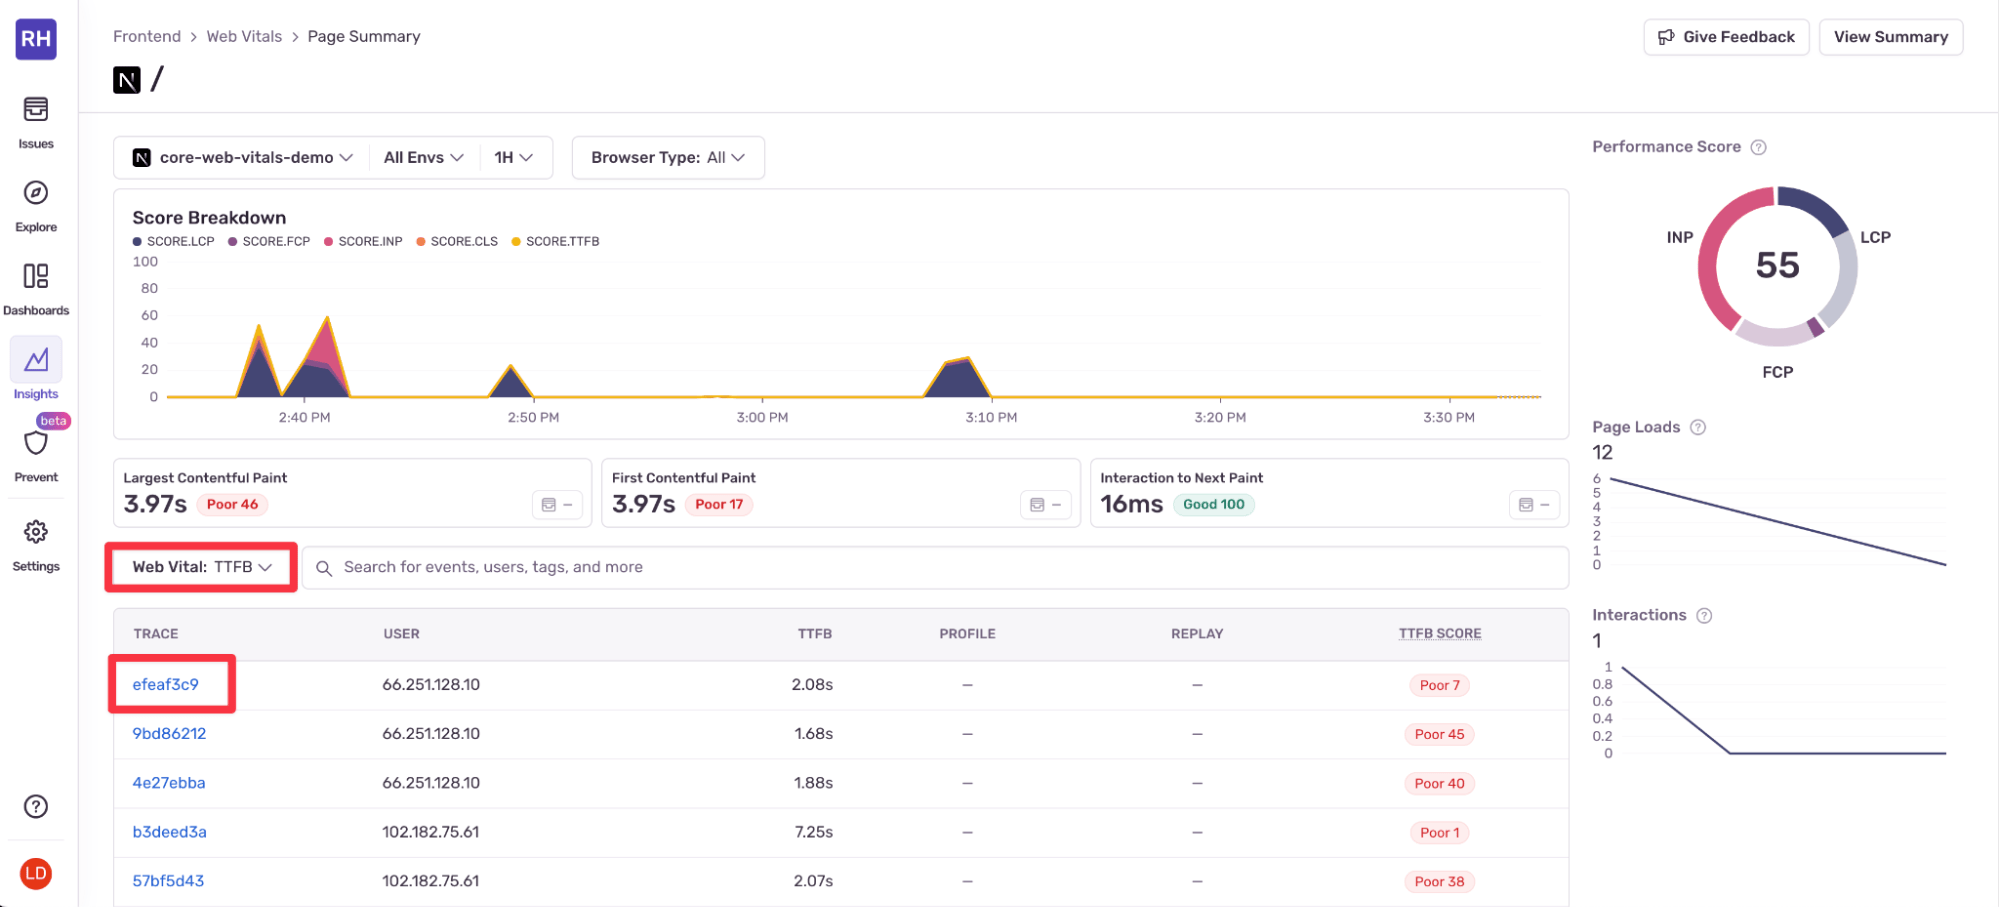
Another issue you’ve noticed is that the website's homepage is taking a long time to load. This could indicate that your server is struggling to keep up with requests. Looking again at the Web Vitals page, you see that the page has a very low Time To First Byte (TTFB) score.
You can then navigate to the page summary for the home page, and use the Web Vital drop-down to show traces by TTFB score. Then open a specific trace by clicking on the appropriate link.
Looking at this trace, you can quickly see there is a two-second delay between the user sending the initial GET request and the response from the Page Server Component. TTFB is calculated from the following request phases:
Redirect time.
Service worker startup time.
DNS lookup.
Connection and TLS negotiation.
Request, up until the point at which the first byte of the response has arrived.
The trace is not showing any evidence of the first four phases, and so you can determine that it is the actual request phase that is taking the full two seconds. Selecting this phase and clicking “More Samples” will allow you to see other examples of the same action, and you will be able to compare the request times from other traces.
In this example, there is a suspiciously consistent two-second delay that can be observed on each one of the samples. This is because an artificial slowdown was added to the example web app using setTimeout(). In a production environment, this may be harder to diagnose, as there can be many reasons for a slow web server response, but tracing should give you a good idea of where to focus your optimization efforts.
Removing the artificial delay solves your TTFB issue, but to improve the performance of the image gallery app, you need additional fixes. First, you could minify the hero image using Tinify, and then replace the <img> elements with Next.js Image components and provide a width and height to prevent cumulative layout shift (CLS):
<Image
  src="/hero-large.jpg"
  alt="Hero"
  width={1500}
  height={1500}
/>
`Image` components could be used for the image gallery images as well, so that the images are lazy-loaded. This means that they are fetched and rendered only when they are close to entering the user's viewport.
The page could also be converted from a client component to a server component to avoid the data fetching being render blocking.
With those fixes implemented, the Core Web Vital metrics look a lot better than before:
You can see the improvement over time in the Score Breakdown chart for the images page:
Think of Sentry as the logical next step after tools like WebVitals. Web tools are great at giving you a quick overview, while Sentry shows you everything underneath, what’s happening, where, and why.
Try WebVitals out
Head to webvitals.com, test your site, and see how it stacks up. You’ll get fast, clear insights, and maybe even a few things to fix before your next deploy.
Then, when you’re ready to go beyond surface-level metrics, bring it home with Sentry. Because knowing your site is slow is fine. Knowing why, and also how, to fix it is better.


