Your applications most likely consist of multiple components. These components could be written in different languages, with each individually instrumented with Sentry’s SDK. The goal of our tracing solution is to make sure developers get a full picture of the data captured within their tech stack. Tracing allows you to follow a request from the frontend all the way to your backend application and back. Not only will you be able to correlate Sentry errors and see how one issue may have been impacted by another issue, but it will provide context into the services that had a negative impact on your applications performance. Just to name a few, some transactions you may be interested in surfacing could include Slow Page Load, User Specific Actions, or Background Processing.
Personalize your Performance Dashboard
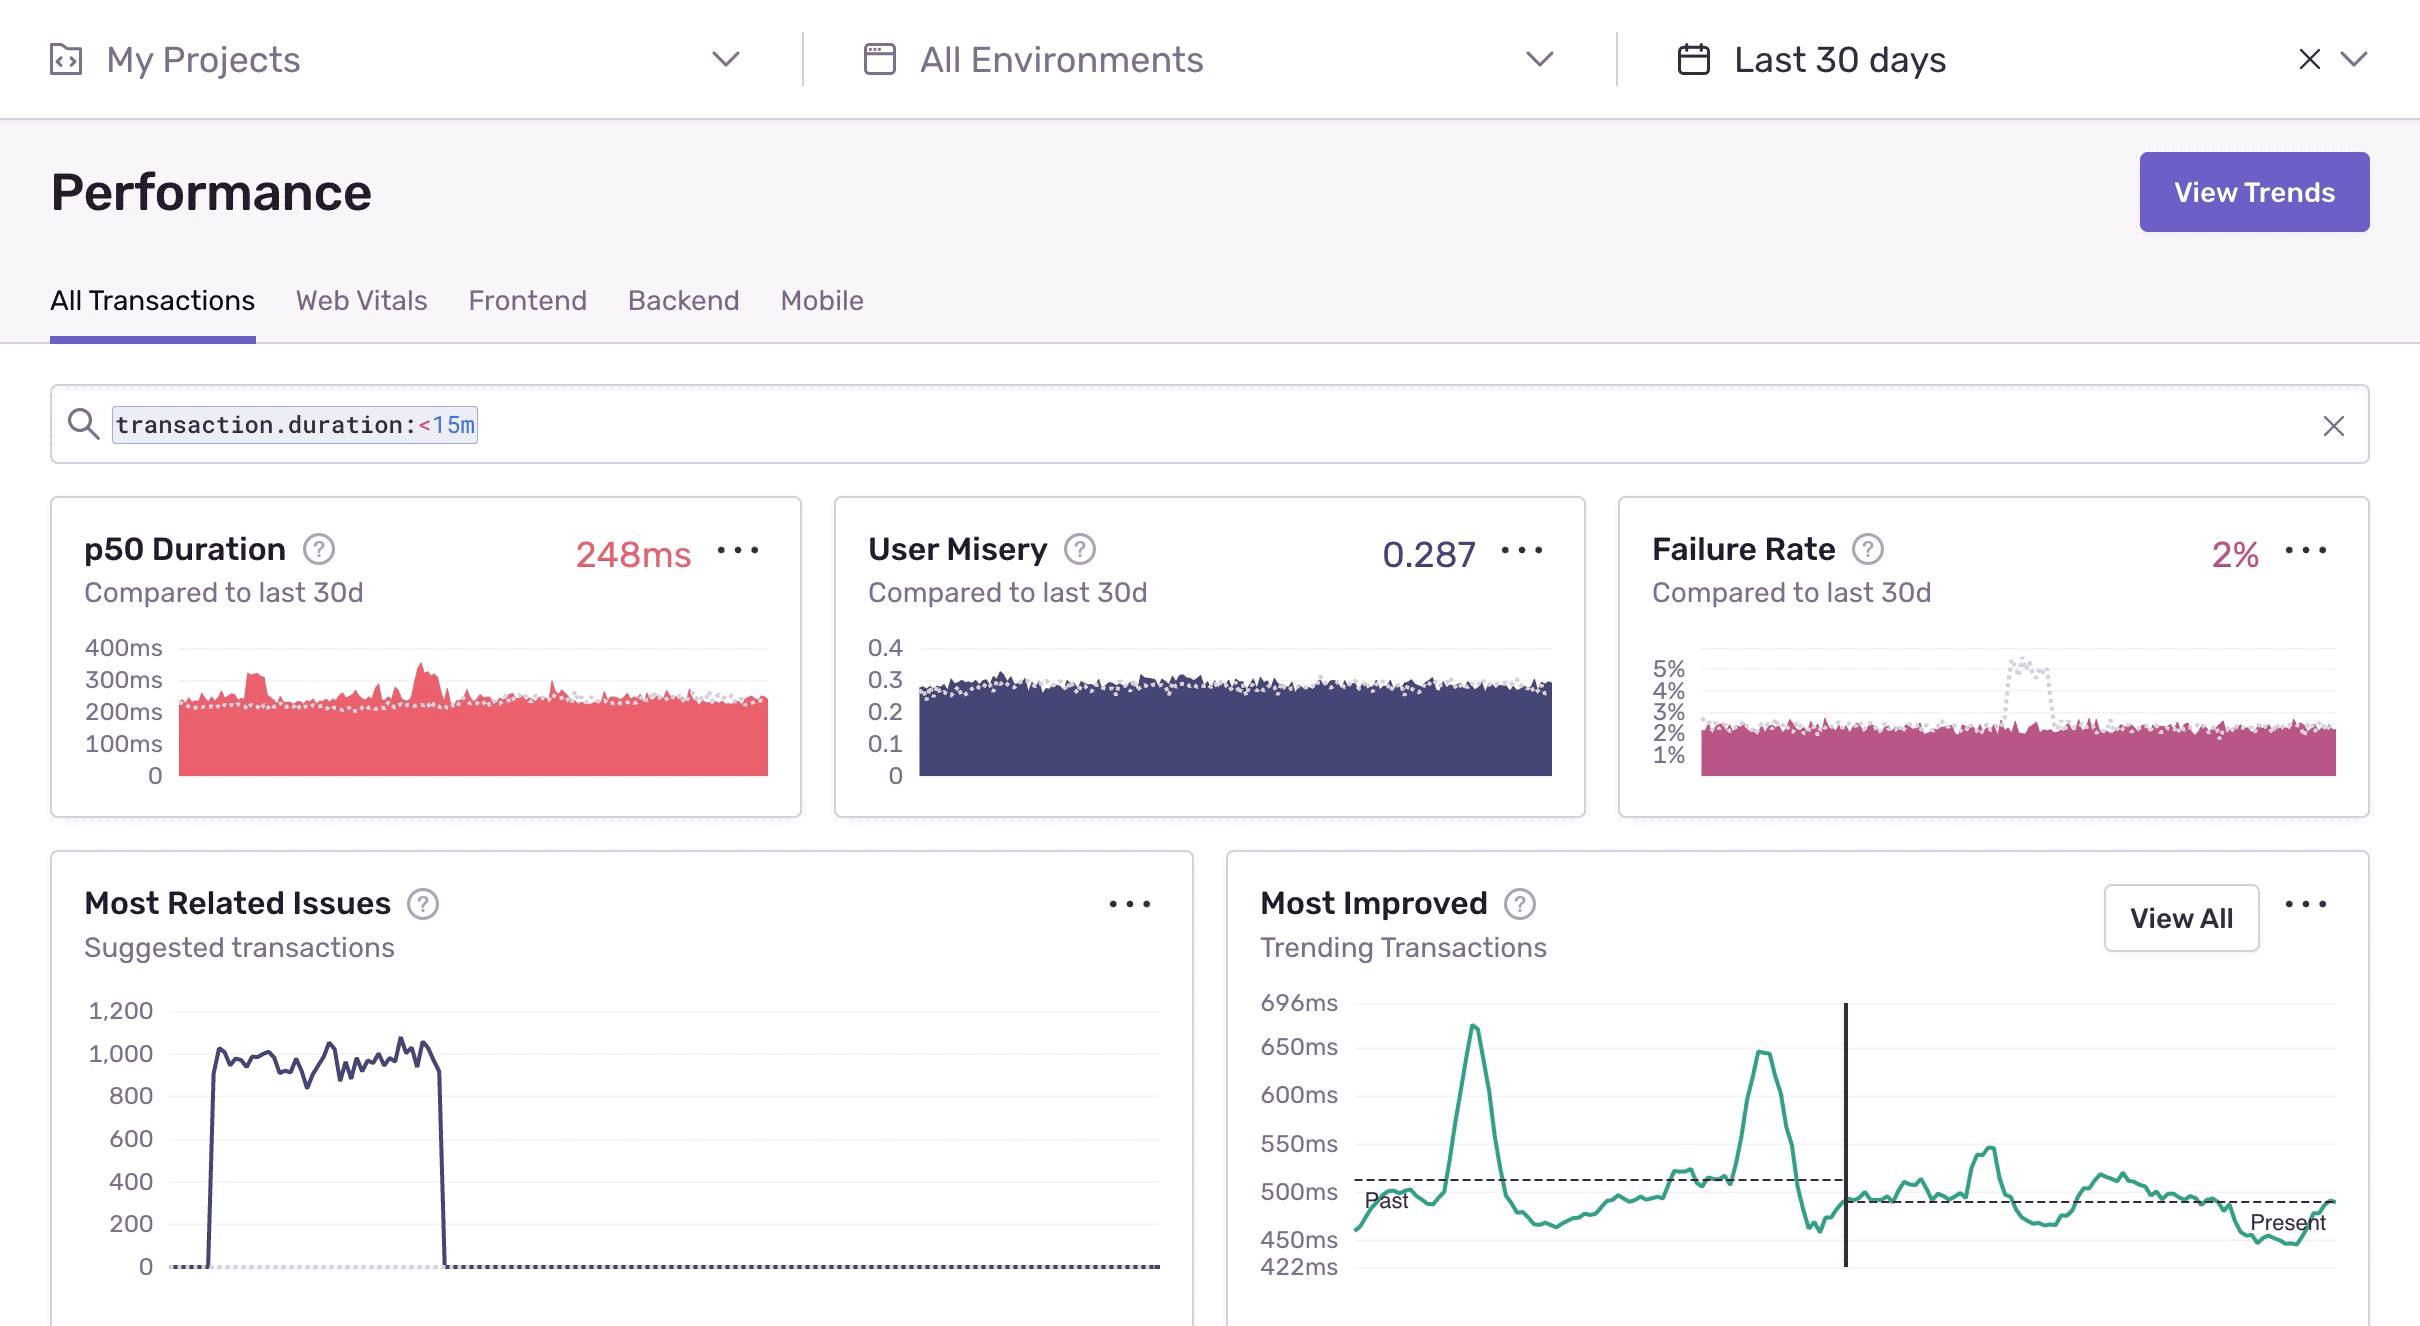
Sentry’s Performance landing page now provides you with better control over visualizing metrics that are relevant to your business logic. Metrics such as Transactions Per Minute, Apdex, or User Misery can be surfaced upfront to accelerate your time to resolution and pinpoint major performance issues in your application.
Uncover major impact in your application
Search properties
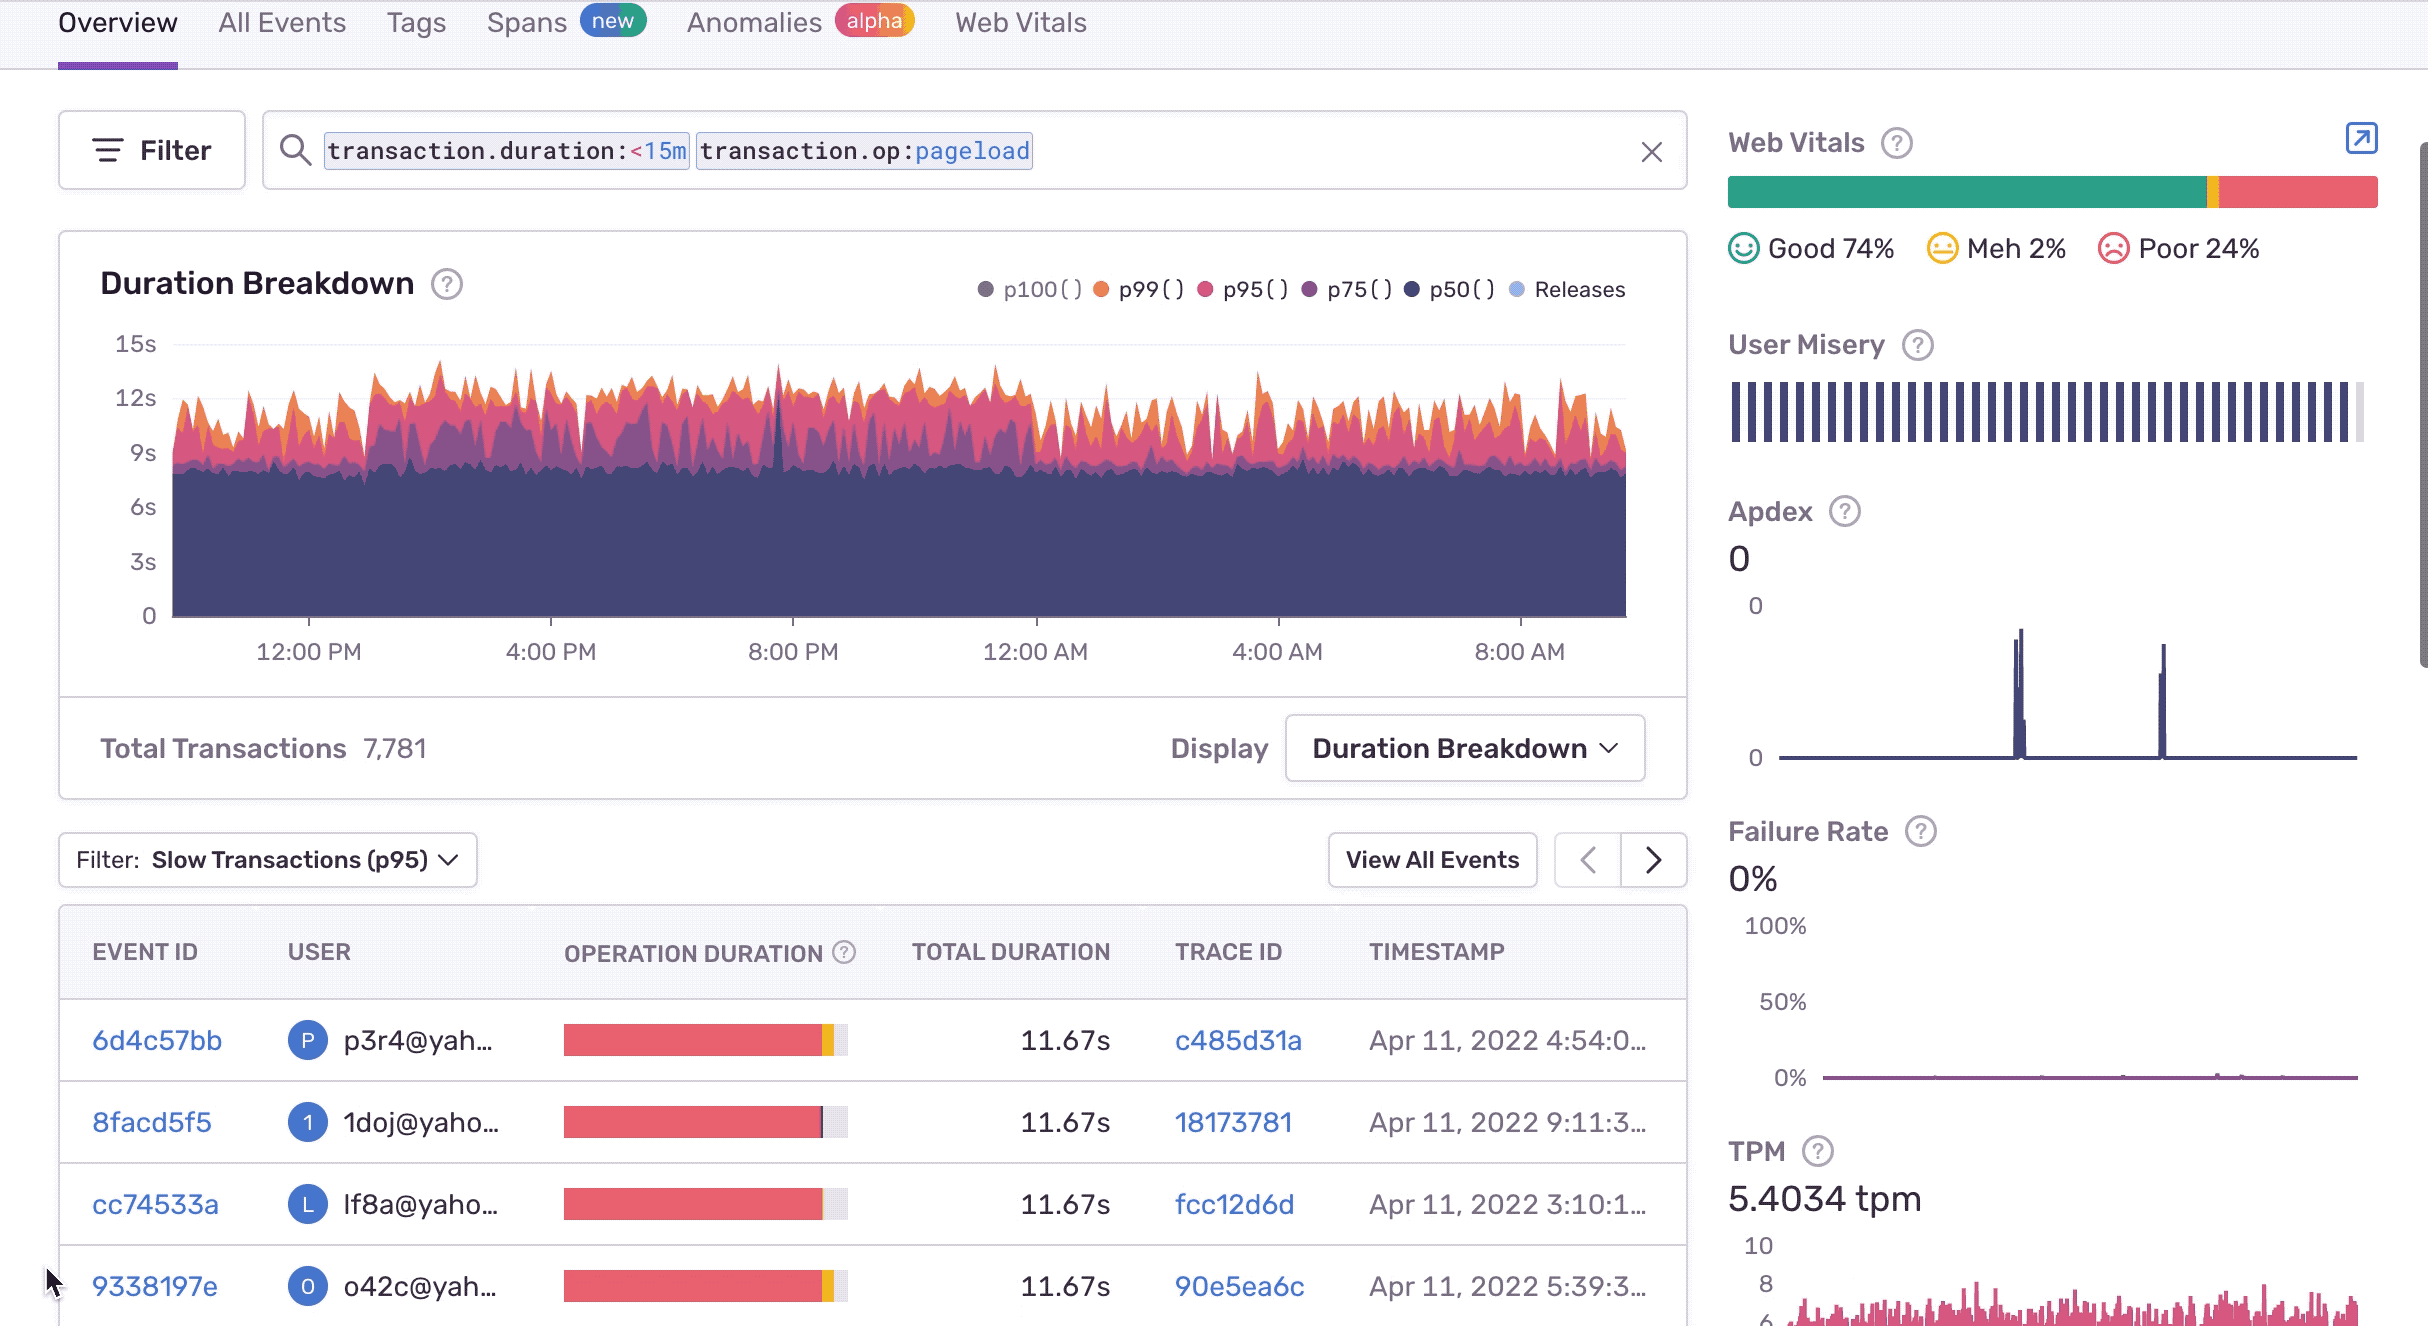
Our Search query provides you with the ability to filter based on properties that are relevant to your application. Some built in key fields to search for include Device, HTTP, OS, or User Attributes. These fields allow you to better understand performance impact based on the data points critical for your team.
All transactions
Sentry’s main Performance page showcases transactions across all your projects. This provides visibility for developers on the transactions captured and how metrics such as Duration, Failure Rate, Apdex and Transactions Per Minute are impacted.
We surface actionable data upfront
Most Related Issue - Surfaces the highest number of issues related to an individual transaction.
Most Regressed/Improved Transactions - Surfaces top regressed and improved transactions. These are calculated by filtering out transactions with large throughput fluctuations. Regressions are any percentage change greater than zero, while improvements are percentage changes less than zero. We use a t-test to compare the before and after periods of the transaction and assign a confidence score. With more transactions shipped up to Sentry, the accuracy of the trends improve.
Web Vitals
Web Vitals come out of the box for page load operation and generally correspond to all browser page transactions on the first page load. To understand your browsers page load health we surface transactions with the highest count of poor LCP, FCP, and FID. These metrics are surfaced up front on our Web Vitals page to visualize the properties of your users’ experience.
Frontend/Backend
Our Frontend page allows developers to visualize frontend transactions without a focus on Web Vitals. Transactions here will primarily correspond to SPA frameworks. Our Backend page will focus on duration, throughput and pull in data points impacting Slow DB or HTTP Ops.
Mobile
We focus on four main metrics critical to mobile application health. These include Slow and Frozen frames as well as App Start. App Start
Suspect Spans and Suspect Tags
The Transaction Summary page includes Suspect Spans and Tags that correlate these data points to where most of the time is being spent in the transaction. By clicking into these spans and tags this will help you as a developer better understand and investigate the overall performance impact of your application. By default we sort these by the total self time.
Suspect Spans : surface list of spans where transactions spent the most time
Suspect Tags: surface list of tags corresponding to slower transactions
Customizing User Misery and Apdex
For each project you can customize your User Misery and Apdex Score under your Project Settings. By providing a custom threshold you have greater control over how user satisfaction is tracked based on your application’s response time. Similarly with User Misery you can examine the number of unique users who were unsatisfied based on four times the satisfactory response to highlight transactions that have the highest impact on users.
Alerts based on Relevant Performance Issues
To ensure you’re aware of future performance issues, developers can lean on the Performance Dashboard to uncover trends and create Metric Alerts. By computing an aggregation using either our count() or avg() function these are then applied to the event properties over time.
You can be notified in two ways: cross a fixed threshold or when there is a deviation from the historical behavior based on a dynamic threshold as known as a state change.
Those are just a few pro-tips on how to make sure your delivering a performant and relaible experience for your customers. For questions or feedback about Performance, drop us a line on GitHub, Twitter, or our Discord. And if you’re new to Sentry, you can try it for free today or request a demo to get started.
More code is shipping faster than ever, and most of it is no longer written by people. The speed is the story everyone tells. What matters more is what happens after the code ships, where software is starting to notice it is broken, understand why, and write the fix itself.
We trained and deployed a new issue grouping model that prevents 20% more duplicate issues, halves incorrect merges, and makes future model upgrades trivial.