How to Debug and Log in PHP

Richard C. - Last Updated:

This guide explains how errors work in PHP and how to debug them efficiently using logging functions and Sentry.
The information in this guide is correct for PHP 8 and perhaps above, depending on how much future PHP versions change.
PHP debugging and logging prerequisites
You can run all code examples in this guide with Docker on any host operating system. If you don’t have Docker, download it here.
If you already have PHP installed, you don’t need Docker. But running code in Docker has other advantages you should consider:
Your machine is protected from any malicious code that runs inside the Docker sandbox.
All programmers on your team can work in the same environment, with the same IDE plugins and PHP version.
You can easily set your development environment to match the deployment server without reconfiguring your physical machine.
PHP exceptions and errors
Let’s start with exploring how exceptions work in PHP.
Errors are internal problems that occur in PHP or its extensions. Exceptions are a type of object that can be thrown and caught by external PHP code written by PHP developers (you). Errors and exceptions are both Throwable objects.
Every error that PHP generates includes a type. Take a look at this list of PHP error types that provides a short description of each type’s behavior and how it can be caused.
There are three main types of errors:
Fatal: Critical errors that halt script execution immediately. For example, requiring a file that does not exist.
Warning: Serious errors that do not stop script execution. For example, including a file that does not exist.
Notice: Minor issues. For example, accessing an undefined variable.
Exceptions are thrown and caught with the try...catch...finally syntax found in most programming languages.
<?php try { throw new Exception("boom"); } catch (Exception $e) { echo "Exception: " . $e->getMessage(); } finally { echo "Cleanup here."; }
To handle uncaught exceptions, pass an error-handling function to the set_error_handler function. Unfortunately, this function isn’t very useful as it cannot handle the most serious error types, like E_ERROR, E_PARSE, E_CORE_ERROR, E_CORE_WARNING, E_COMPILE_ERROR, and E_COMPILE_WARNING.
If you don’t set an error handler, PHP will handle errors according to its configuration, controlled by the error_reporting directive in php.ini. The default is to report (return in HTML) all errors. Error reporting is complex, especially with debugging frameworks, and is a common way for hackers to probe the vulnerabilities of your PHP configuration.
You can turn off all error reporting for your production site in the php.ini file if you don’t want errors displayed in the HTML page returned to users. Rather than turning off error reporting entirely, a better solution is to set the error_log handler to log all errors to a file, and turn log_errors on in php.ini.
You can set a global exception handler with the function set_exception_handler(). Any uncaught exception will be passed into this function.
PS. Sentry also has a list of common php errors and step-by-step solutions for those errors here.
Make an example error
Let’s create a simple script that provides a page you can browse at http://localhost:8000 and throws an error.
In any folder on your computer, create a file called index.php containing the following:
    <?php
      echo ("Hello!");
      throw new Exception("boom");
Open a terminal in the folder. In the terminal, run the script with Docker using the command below.
docker run --name phpbox --rm -v ".:/app" -p 8000:8000 --platform linux/amd64 php:8.3 php -S 0.0.0.0:8000 -t /app
This command starts a container named phpbox that will be removed on exit. The container has access to the current folder, exposes port 8000 for your host machine to access, and runs the php command listening to all connections on port 8000 and serving files from the app folder.
You can now see the page output at http://localhost:8000.
The request your browser makes for the HTML page is handled by the PHP built-in web server. This server will execute your PHP scripts for testing purposes, but does not support multithreading and is not suitable for production deployments. Rather use Apache or nginx for production.
The exception is shown in the Docker standard out, which can be sent to a log file:
    [Thu Dec  5 12:24:30 2024] PHP 8.3.14 Development Server (http://0.0.0.0:8000) started
    [Thu Dec  5 12:25:33 2024] 192.168.65.1:28190 Accepted
    [Thu Dec  5 12:25:33 2024] 192.168.65.1:28190 [200]: GET / - Uncaught Exception: boom in /app/index.php:3
    Stack trace:
    #0 {main}
      thrown in /app/index.php on line 3
    [Thu Dec  5 12:25:33 2024] 192.168.65.1:28190 Closing
Handle PHP errors gracefully
Currently, our example code returns errors to the browser, in this case, Fatal error: Uncaught Exception: boom in /app/index.php:3 Stack trace: #0 {main} thrown in /app/index.php on line 3.
Let’s prevent exposing error details to customers by wrapping the problematic code in a try-catch block:
    <?php
      try {
        echo ("Hello!");
        throw new Exception("boom");
      }
      catch (Exception $e) {
        echo "Sorry, the server had an error.";
      }
Now the browser hides the details of the error:
    Hello!
    Sorry, the server had an error.
The server does not output any errors to stdout logs:
    [Fri Aug  2 12:40:47 2024] PHP 8.3.9 Development Server (http://0.0.0.0:8000) started
    [Fri Aug  2 12:40:48 2024] 172.17.0.1:42910 Accepted
    [Fri Aug  2 12:40:48 2024] 172.17.0.1:42910 [200]: GET /
    [Fri Aug  2 12:40:48 2024] 172.17.0.1:42910 Closing
Log PHP errors
If you encounter a top-level error that you don’t know how to handle, you shouldn’t ignore it as we did in the previous section. Instead, you can log the errors to a file to monitor them.
Remove the try...catch code you previously added to index.php. Add a php.ini file with the content below.
php.iniClick to Copyerror_reporting = E_ALL ; 0 for no errors display_errors = off ; don't send errors to browser log_errors = on ; send all errors to log file error_log = /app/log.log
Note the lines do not end with a semicolon. In ini files, semicolons start comments and don’t act as line terminators.
Stop the Docker container. Start it with the new command below, which includes a link to the configuration file.
docker run --name phpbox --rm -v ".:/app" -p 8000:8000 --platform linux/amd64 php:8.3 php -S 0.0.0.0:8000 -t /app -c /app/php.ini
Now, no errors will be sent to the browser:
Hello!
The exception will be output in the server terminal:
    [Thu Dec  5 12:40:38 2024] PHP 8.3.14 Development Server (http://0.0.0.0:8000) started
    [Thu Dec  5 12:40:49 2024] 192.168.65.1:30473 Accepted
    [Thu Dec  5 12:40:49 2024] 192.168.65.1:30473 [200]: GET / - Uncaught Exception: boom in /app/index.php:3
    Stack trace:
    #0 {main}
      thrown in /app/index.php on line 3
    [Thu Dec  5 12:40:49 2024] 192.168.65.1:30473 Closing
The exception will be logged to the log.log file, which you can monitor for further processing.
PHP testing, logging, debugging, and monitoring
The following related activities are essential for detecting and preventing errors:
Testing
Logging
Debugging
Monitoring
Testing aims to prevent errors before they occur and is done by a human or a program with either a unit test or an integration test. Testing is a big topic and is not discussed in this guide.
Logging and monitoring detect existing errors or find areas to improve an application’s performance. Logging involves writing lines to a log file to create an auditable history. Monitoring is concerned only with the present and shows a dashboard of the current status of an application or alerts you when an error occurs.
Debugging is investigating the cause of an existing error and fixing it. Check out our blog on observability, monitoring, and debugging or how Sentry differentiates itself from logging if you're curious.
PHP logging
As well as logging errors to a log file as previously demonstrated, you can use log messages to help you find the cause of errors. Any way that PHP writes text can be used to log.
In PHP, text that is not between PHP tags is output as it is. If the PHP file is called by a web server, then the text will be returned to the browser and rendered as HTML. If the PHP file is run from the terminal without a web server, the text will be printed to standard out.
Log to the browser
PHP has many ways to output text. Below are examples of functions that do so:
    <?php
      $msg = 'Hello World';
      echo($msg);
      echo('<hr/>');

      var_dump($msg);
      echo('<hr/>');

      print_r($msg);
      echo('<hr/>');

      print_r(get_defined_vars());
      echo('<hr/>');

      debug_zval_dump ($msg);
      echo('<hr/>');

      function go() {
        debug_print_backtrace();
        echo('<hr/>');

        print_r(debug_backtrace());
        echo('<hr/>');
      }
      go();
      throw Exception('e');
The code above returns:
    Hello World
    ---
    string(11) "Hello World"
    ---
    Hello World
    ---
    Array ( [_GET] => Array ( ) [_POST] => Array ( ) [_COOKIE] => Array ( ) [_FILES] => Array ( ) [msg] => Hello World )
    ---
    string(11) "Hello World" interned
    ---
    #0 /app/index.php(34): go()
    ---
    Array ( [0] => Array ( [file] => /app/index.php [line] => 34 [function] => go [args] => Array ( ) ) )
You can use one of the functions above to display the text value of a variable or the current stack trace in your preferred format.
A PHP script can be run in two ways: From the terminal or as a module to a web server like Apache. Either way, the functions above will return text to the application that called the script. If the script is run from the terminal, the text will be output to the terminal. If the script is run by Apache, the text will be output to the web server, which then delivers the text to the browser.
Log to the server
Since you mostly run PHP from a web server and don’t want to return debugging information to customers in the browser, you need a different way to log debugging information locally. The only way to do this is to write to a file, which is cumbersome for debugging, or use the error_log() function. Below is an example of using the function:
    <?php
      $obj = new stdClass();
      $obj->message = 'Hello World';
      $obj->time = time();

      $msg = print_r($obj, true);
      error_log($msg);
This code outputs:
    [Mon Aug  5 10:13:38 2024] PHP 8.3.9 Development Server (http://0.0.0.0:8000) started
    [Mon Aug  5 10:13:41 2024] 172.17.0.1:57508 Accepted
    [Mon Aug  5 10:13:41 2024] stdClass Object
    (
      [message] => Hello World
      [time] => 1722852821
    )
In the above example, we use print_r to convert an object to a string, so that the string can be written to the terminal. The print_r function creates human-readable output, but does not output valid PHP. To write strings that are valid PHP object literals that you can copy and paste back into your code to create objects, replace print_r with var_export.
Debugging in PHP
Logging is a way to detect errors. By adding log statements to your code with the value of variables, you can investigate and debug errors. But logging generally isn’t the best debugging tool, because:
Log statements take time to write and later remove.
The program must be run repeatedly and statements modified during the investigation.
The app can’t be paused to modify variable values.
A better alternative is to use a dedicated debugger.
Debug in VS Code
Visual Studio Code (“VS Code” or “Code”) is a free integrated development environment (IDE) that allows you to debug PHP. For more information, see the official VS Code documentation.
In this section, you’ll learn how to attach VS Code to PHP through Xdebug, a debugging extension for PHP. Please install VS Code before continuing.
PhpStorm, a proprietary alternative IDE to VS Code, also supports debugging with Xdebug and follows the same principles discussed in this guide.
Remote debugging and Docker dev containers
To ensure that you can follow this guide on any operating system, we will run VS Code in a Docker container.
If you already have PHP and Xdebug installed on your machine, you can run the example directly. If you don’t want to use Docker, install Xdebug before continuing.
You can run VS Code and PHP in the same Docker container using the Dev Containers extension. See the official documentation here.
In the Extensions sidebar in VS Code, search for and install the “Remote Development” extension pack that includes Dev Containers.
In your working folder, make another folder called
.devcontainer.
Create a file called dockerfile in .devcontainer and insert the code below.
dockerfileClick to CopyFROM --platform=linux/amd64 php:8.3 RUN pecl install xdebug && docker-php-ext-enable xdebug
This dockerfile installs Xdebug into the standard PHP Docker image.
Create a file .devcontainer/devcontainer.json and insert the code below.
.devcontainer/devcontainer.jsonClick to Copy{ "name": "PHP Development Container", "dockerFile": "dockerfile", "postCreateCommand": "", "remoteUser": "root", "customizations": { "vscode": { "settings": { "terminal.integrated.shell.linux": "/bin/bash" }, "extensions": ["xdebug.php-pack"] } } }
VS Code uses this JSON file to configure itself when it runs inside the container created by the Dockerfile. The extensions property is important. It tells VS Code which extensions to install before starting — something you normally do from the VS Code sidebar. Here we use the PHP extension pack, which includes the autocompletion extension and the Xdebug extension.
To find the names of your extensions to add to the configuration file, open your extension, and under the settings cog, click Copy Extension ID.
When you open the folder containing the .devcontainer folder in VS Code, a notification should ask you to reopen in a container. Click the button to confirm.
When the container finishes building for the first time and opens, you can work in VS Code in the same way as on your physical machine. Your code folder will now be located in a subfolder of /workspaces.
The first time the container builds, it will be slow. But VS Code will open as quickly as working from your local machine after the first build.
Launch configuration files
Whether or not you’re using Docker, to run your PHP script as a terminal app or from a web server, you need to create a launch configuration file. In VS Code, create the file .vscode/launch.json and insert the code below. (This is a modified version of the default file that you can create from the Run and Debug panel options.)
.vscode/launch.jsonClick to Copy{ "version": "0.2.0", "configurations": [ { "name": "Listen for Xdebug", "type": "php", "request": "launch", "port": 9003 }, { "name": "Launch currently open script", "type": "php", "request": "launch", "program": "${file}", "cwd": "${fileDirname}", "port": 9003, "runtimeArgs": ["-dxdebug.start_with_request=yes"], "env": { "XDEBUG_MODE": "debug,develop", "XDEBUG_CONFIG": "client_port=${port}" } }, { "name": "Launch built-in web server", "type": "php", "request": "launch", "runtimeArgs": [ "-dxdebug.mode=debug", "-dxdebug.start_with_request=yes", "-S", "0.0.0.0:8000" ], "program": "${file}", // "/workspaces/php/app/index.php", "cwd": "${workspaceRoot}", "port": 9003, "serverReadyAction": { "pattern": "Development Server \\(http://0.0.0.0:([0-9]+)\\) started", "uriFormat": "http://localhost:%s", "action": "openExternally" } } ] }
This file allows you to run and debug scripts from VS Code using the Run and Debug sidebar, or by pushing F5. The configuration above provides three options you need to choose from when running a script:
Listen for Xdebug — This option doesn’t run scripts in VS Code, but instead tries to attach to an existing Xdebug instance on the specified port. We won’t use this option in this tutorial.
Launch currently open script — This option launches the file you currently have focused, along with Xdebug, and tries to attach the PHP debug extension in VS Code to the running Xdebug port of
9003. Port9003is the default Xdebug port. If you want to run the same script every time, you can set theprogramproperty inlaunch.jsonto a specific file.Launch built-in web server — Similarly to the previous option, this option launches your PHP script in a web server instead of as a terminal application. There are two ports in this configuration section: Port
8000on which the web application runs and port9003on which Xdebug is exposed. Note that the configuration uses0.0.0.0instead of localhost to allow Docker to accept web browser requests from any machine rather than only those from inside the same container.
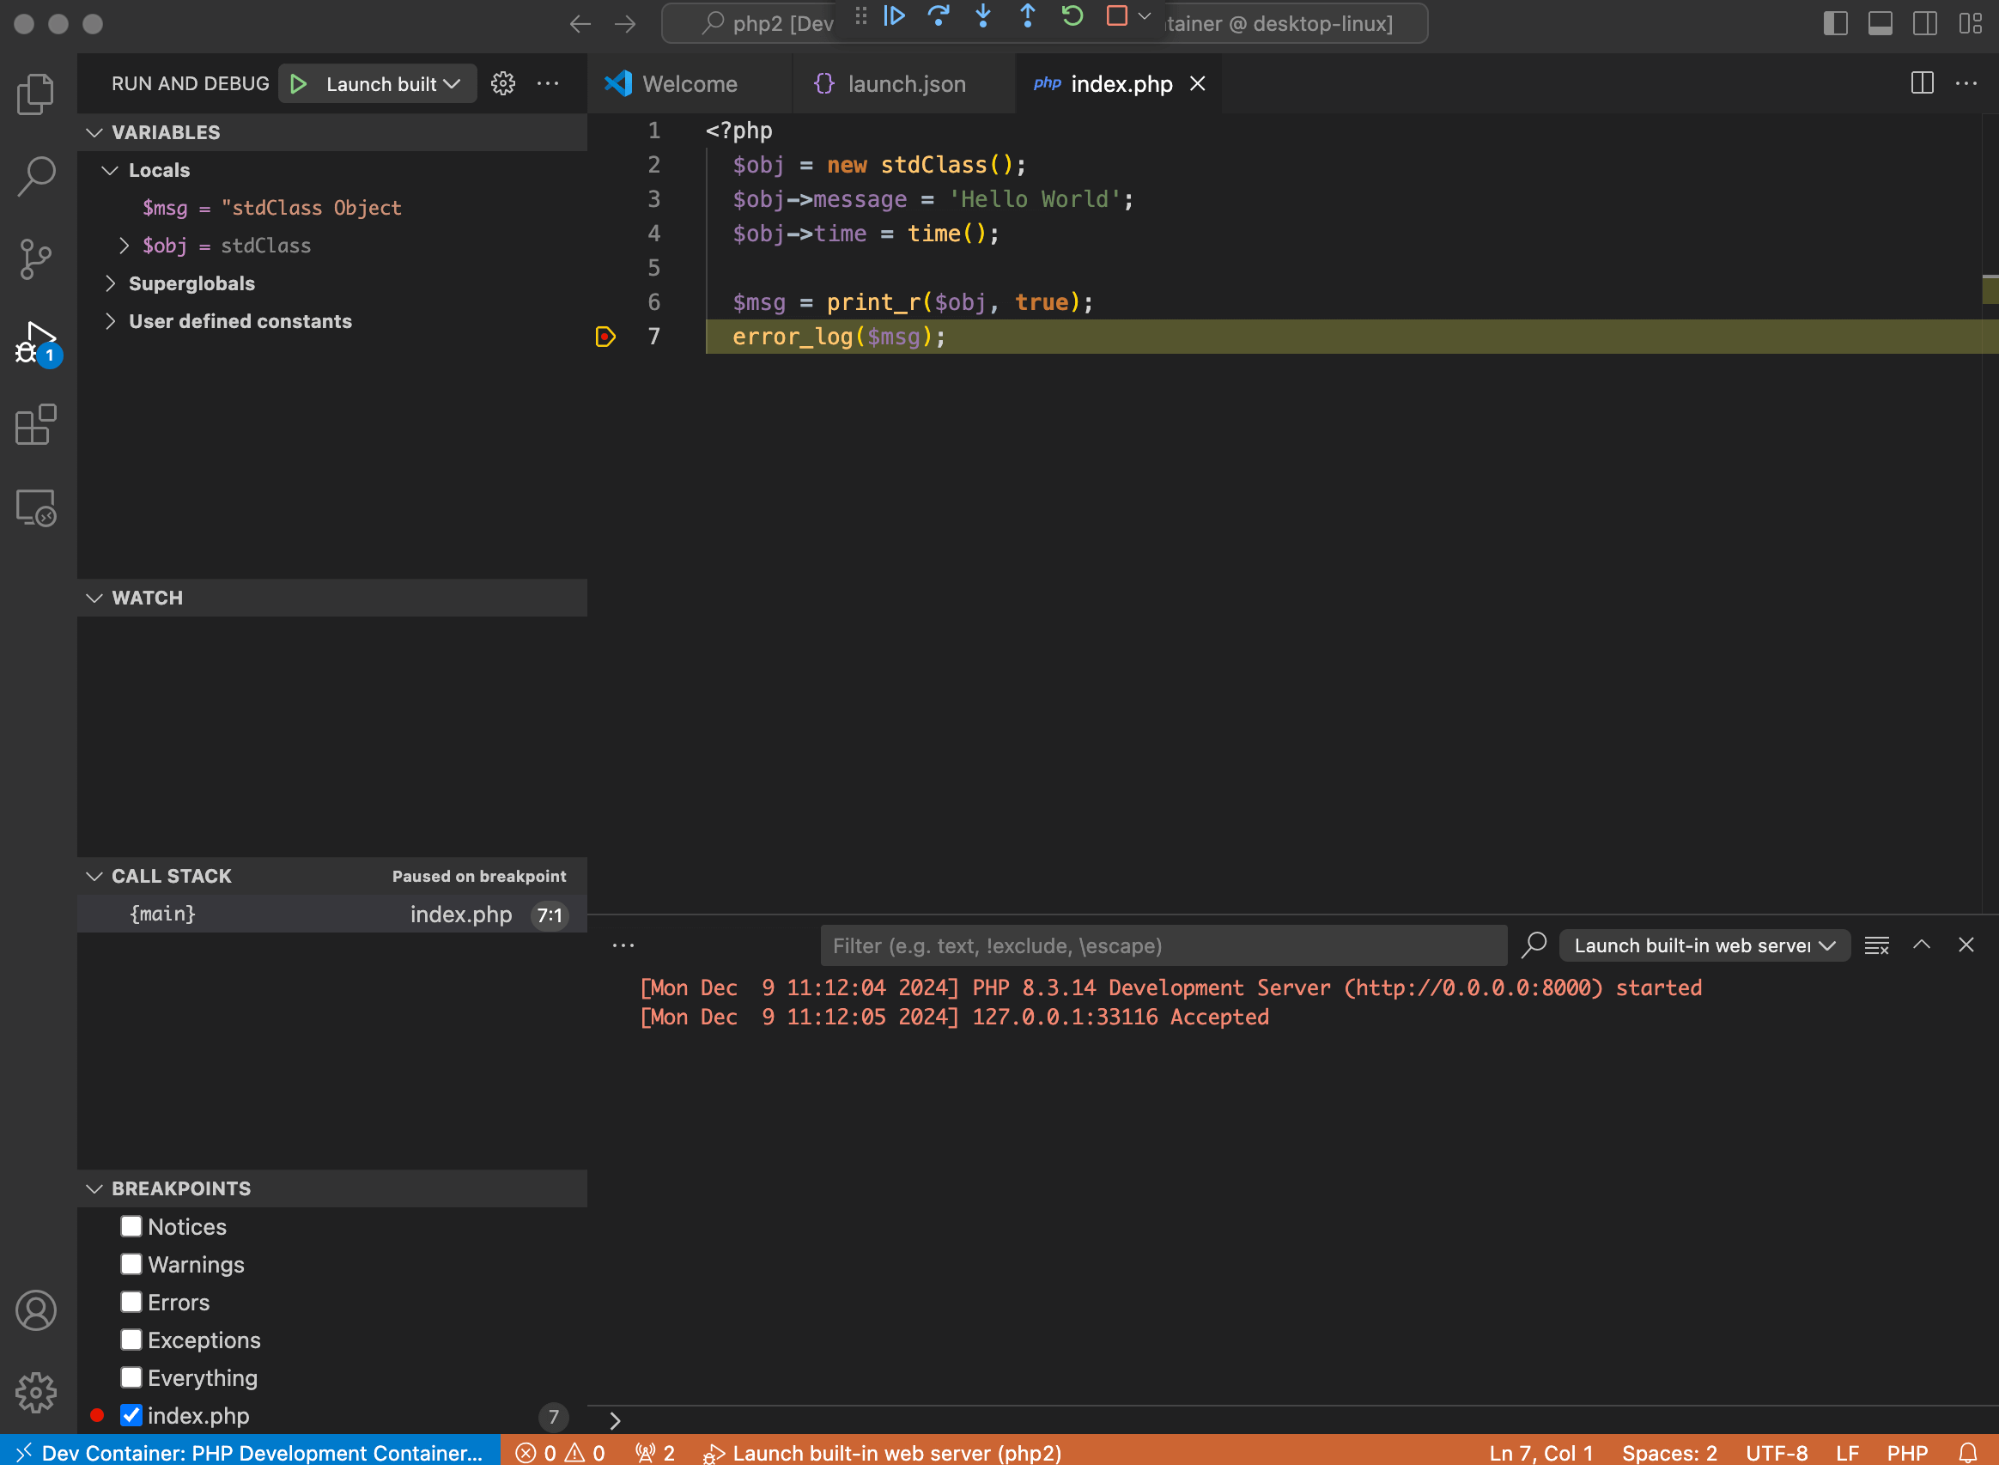
Now open the index.php file in VS Code, put a breakpoint in the code by clicking in the margin, push F5, and choose Launch built-in web server. Browse to the page at http://localhost:8000 and you should see VS Code attach to your script.
You can now use the standard VS Code debugging tools:
Step through the code using F10 or the buttons on the play bar at the top of the screen.
See variables in scope and add variables to watch in the sidebar on the left.
See debugging output in the TERMINAL tab at the bottom of the screen, where all your
error_log()statements will output.Change variables and run ad-hoc PHP code in the DEBUG CONSOLE at the bottom of the screen.
Set conditional breakpoints by right-clicking on a breakpoint and entering an expression. The breakpoint will cause execution to pause only when the expression is true.
By stepping through your code slowly and checking and changing the values of variables, you should be able to reproduce and fix errors your customers encounter.
Monitoring PHP errors with an online service
So far, this guide has used free tools. But monitoring your application — being alerted to any errors and having a dashboard of application performance available at all times — is more complicated. There are free tools like Prometheus and Elastic that you can set up on your server, but they are complex and beyond the scope of this guide. Additionally, if your monitoring server goes offline, you won’t be alerted to problems. Instead, you can use paid services, or the free starter tier of paid services, to provide an always-available monitoring service with a simple setup.
This section shows you how to monitor errors with the free tier of Sentry, a service dedicated to handling exceptions. Follow the instructions below to set up a Sentry account, connect your app to Sentry, and monitor your app on the Sentry web interface.
Go to https://sentry.io/signup and create an account.
Skip onboarding.
Click Create project.
Choose PHP.
Enter a Project name.
Click Create Project.
On the next page, with setup instructions, note your
dsnURL value. Keep it secret and do not commit it to GitHub.In any empty directory on your computer, create a file called
dockerfilewith the content below. The PHP Docker image doesn’t include Composer, so we need to install that. Then we install the Sentry plugin and the PHP sampling extension it relies on, Excimer.
dockerfileClick to CopyFROM --platform=linux/amd64 php:8.3 RUN apt update && apt install -y zip unzip git curl RUN curl -sS https://getcomposer.org/installer | php -- --install-dir=/usr/local/bin --filename=composer RUN pecl install excimer
Create
index.phpwith the content below, using yourdsnvalue. We first define the linerequire '/app/vendor/autoload.php';to load classes from libraries automatically. The code then starts Sentry, and throws an exception for Sentry to catch.
index.phpClick to Copy<?php require '/app/vendor/autoload.php'; \Sentry\init([ 'dsn' => 'https://979d2d76b96b@o4507746419671.ingest.de.sentry.io/45077464' ]); try { echo("Hello monitoring world!"); throw new Exception("The app broke :("); } catch (\Throwable $exception) { \Sentry\captureException($exception); }
Run the commands below in a terminal in the same folder as these files. The first command builds a Docker image based on PHP that includes Composer. The second command runs a temporary container based on the image, which installs Sentry and starts the PHP web server.
    docker build --platform linux/amd64 -t phpimage -f dockerfile . ;

    docker run --name phpbox --rm -v ".:/app" -p 8000:8000 --platform linux/amd64 phpimage sh -c "cd /app && composer require sentry/sentry && php -S 0.0.0.0:8000 -t /app"
Browse to http://localhost:8000.
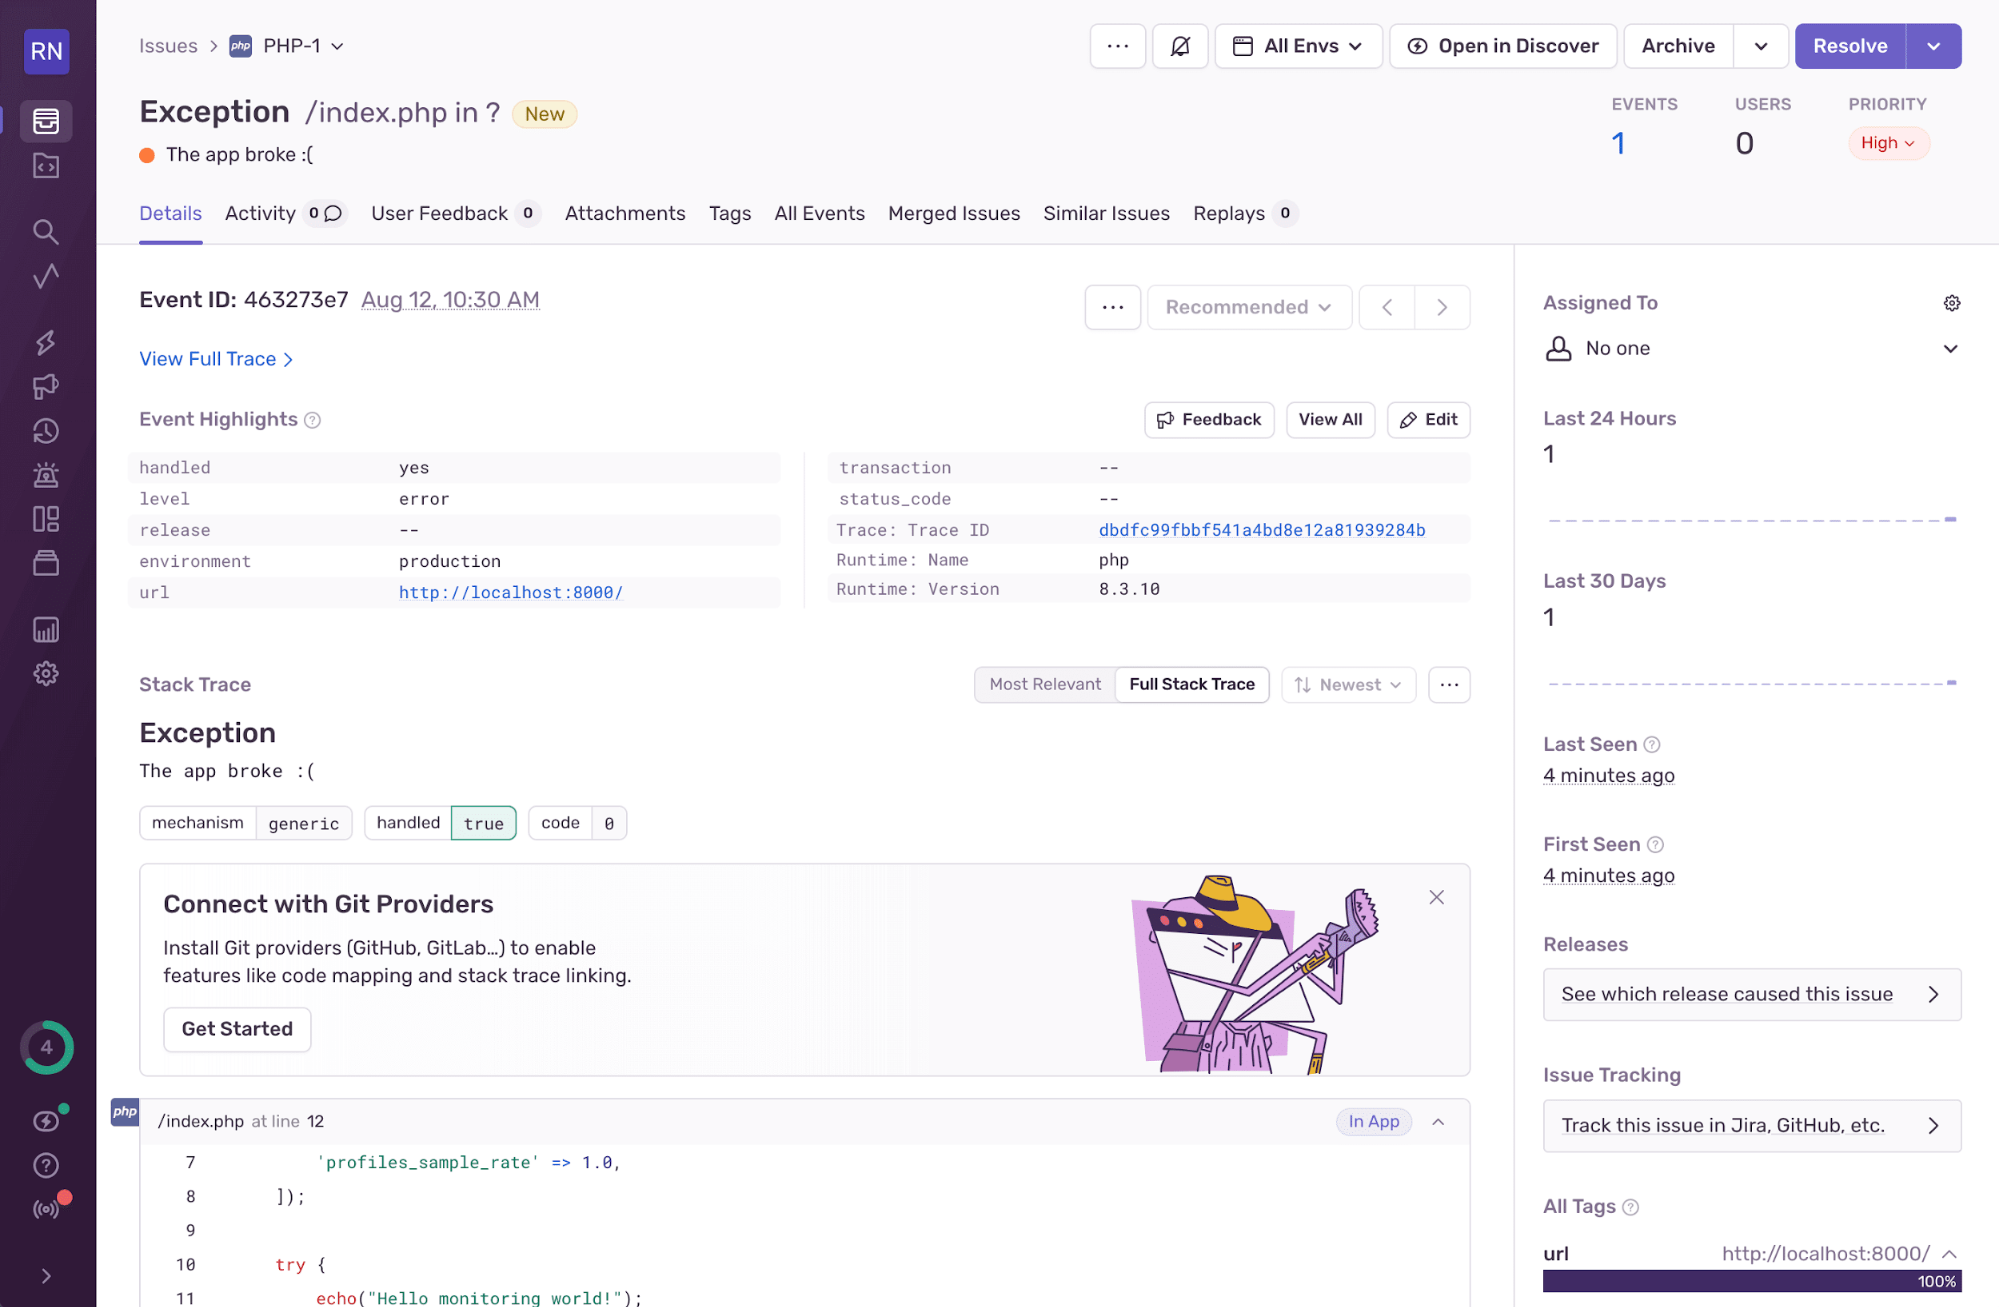
Back in the Sentry web interface, the error should have been detected. Click Take me to Issues.
You should see information about your error similar to the image below.
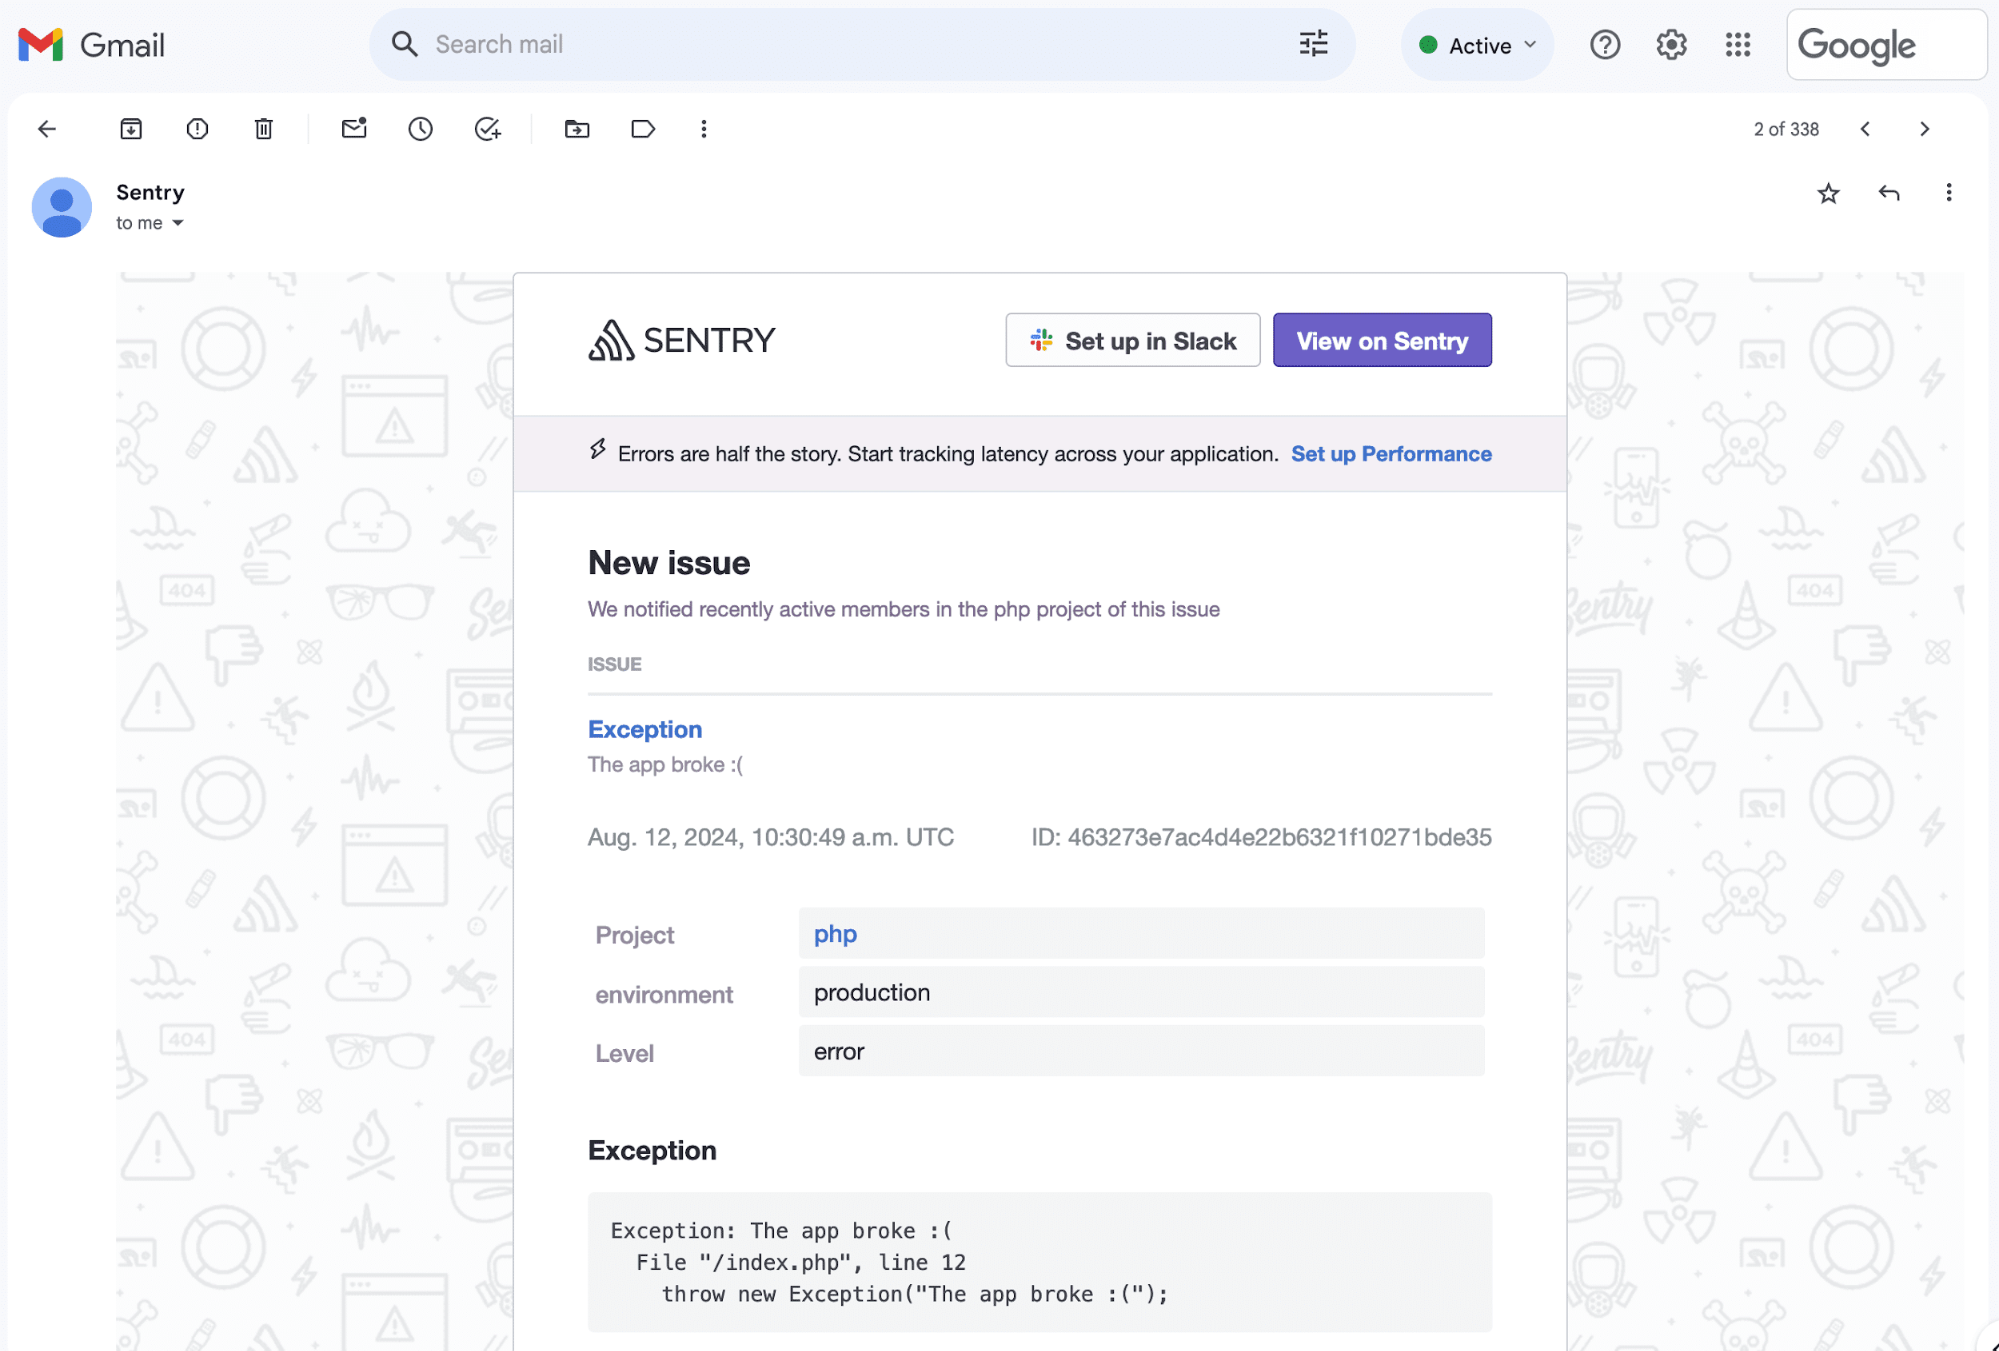
In addition to a dashboard of your app’s performance and errors, Sentry also automatically emails you to alert you of any errors occurring in your app.
Sending structured logs to Sentry
If you’ve read our Python logging post, this will feel familiar. Same idea, different syntax. Structured logs let you send messages to Sentry that aren’t just plain text, they come with attributes you can search, filter, and connect to traces and errors.
Sentry’s structured logging for PHP is supported in SDK v4.12.0 and later. Here’s how to set it up.
1. Enable logging in the SDK
First, enable logs when you initialize the SDK. The enable_logs option turns on structured logging.
\Sentry\init([
    'dsn' => 'https://examplePublicKey@o0.ingest.sentry.io/0',
    // Enable logs to be sent to Sentry
    'enable_logs' => true,
]);

// Somewhere at the end of your execution, you should flush the logger to send pending logs to Sentry.
\Sentry\logger()->flush();
That’s all it takes. Logs are now sent to Sentry as structured data, which means you can attach and query attributes directly in the Logs UI.
If you’re running long-lived CLI tasks, call \Sentry\logger()->flush() periodically to avoid high memory usage and make sure nothing gets dropped.
2. Send logs with attributes
Once logging is enabled, you can send messages at different log levels using logger(). The PHP SDK supports trace, debug, info, warn, error, and fatal.
\Sentry\logger()->info('A simple log message');
\Sentry\logger()->info('A message with a parameter that says %s', values: ['hello']);
\Sentry\logger()->warn('This is a warning log with attributes.', attributes: [
  'attribute1' => 'string',
  'attribute2' => 1,
  'attribute3' => 1.0,
  'attribute4' => true,
]);

// Somewhere at the end of your execution, you should flush the logger to send pending logs to Sentry.
\Sentry\logger()->flush();
Each log appears in Sentry with its message, level, and any attributes you’ve added. Those attributes — like attribute1 or attribute2 — show up as searchable, filterable fields in the Logs UI. No more scrolling through endless text output.
3. Filter or modify logs before sending
Don’t want every log level ending up in Sentry? You can intercept them using the before_send_log option. This hook runs before each log is sent, so you can filter, redact, or modify data on the fly.
\Sentry\init([
    'dsn' => 'https://examplePublicKey@o0.ingest.sentry.io/0',
    // Enable logs to be sent to Sentry
    'enable_logs' => true,
    'before_send_log' => function (\Sentry\Logs\Log $log): ?\Sentry\Logs\Log {
        if ($log->getLevel() === \Sentry\Logs\LogLevel::info()) {
            // Filter out all info logs
            return null;
        }

        return $log;
    },
]);
In this example, info logs are ignored, while everything else is sent to Sentry. It’s also a handy place to scrub sensitive fields or add context before sending.
4. Default attributes
Sentry automatically attaches several attributes to each log to make debugging easier:
environment– from your SDK configrelease– your app’s release versiontrace.parent_span_id– links logs to specific tracessdk.name/sdk.version– which SDK sent itserver.address– the host that sent the loguser.id,user.name,user.email– if user context is setorigin– marks logs created by SDK integrations
If your log messages use parameters, Sentry also adds:
message.template– the original message stringmessage.parameter.X– the parameterized values
These attributes connect your logs to errors and performance traces, giving you a single, searchable view of what went wrong and why.
Enable enable_logs, send structured messages, and flush before shutdown. Sentry takes care of making your logs useful, searchable, connected, and visible alongside your errors and traces.
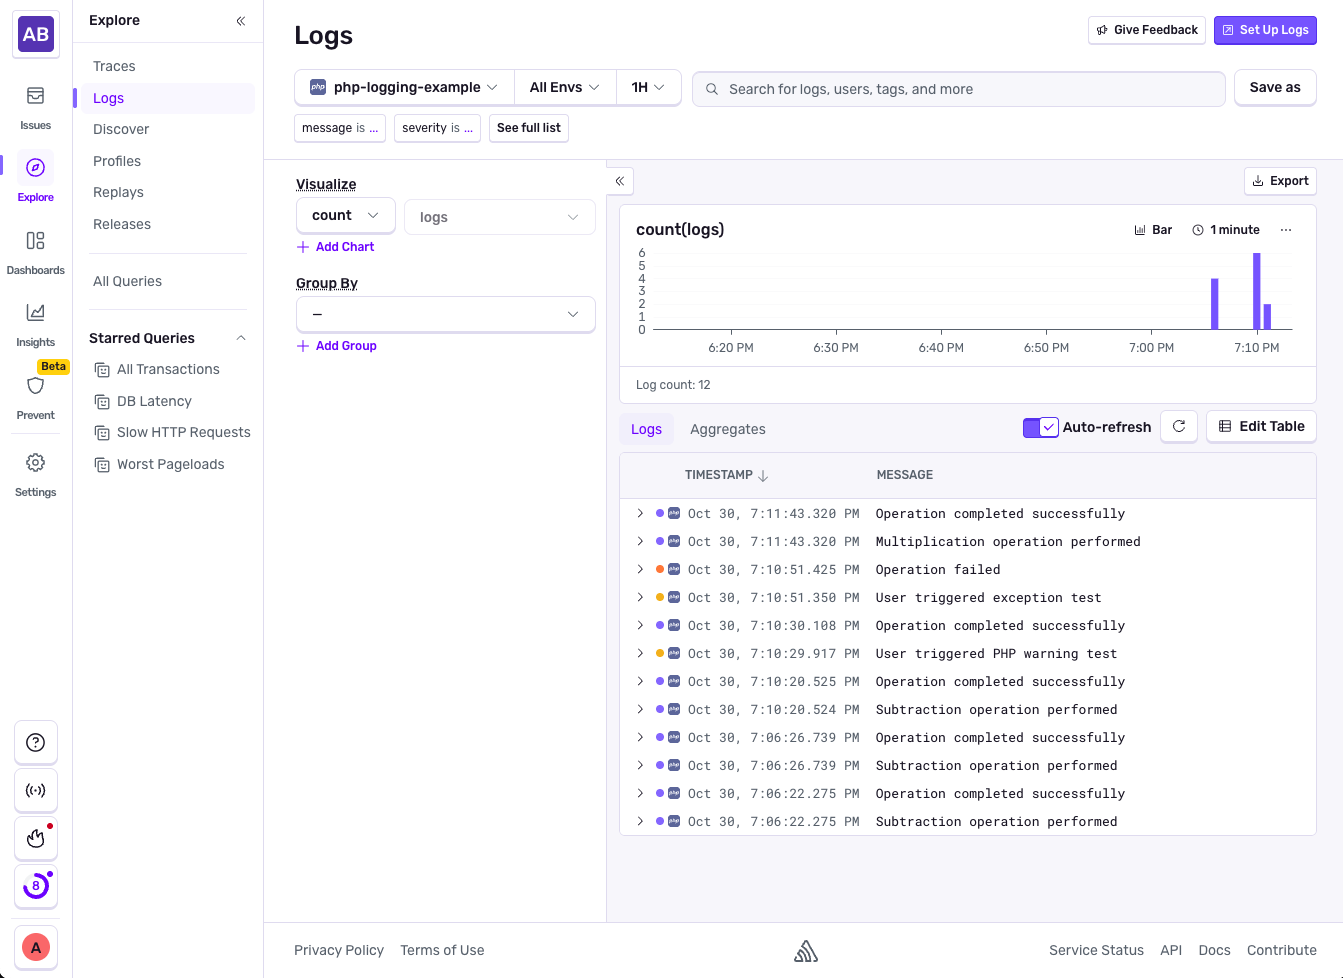
Once you're all done with setting up structured logging with Sentry, you will see start showing up under Explore > Logs. By enabling auto-refresh, the logs will automatically update as new events happen.
And that's it, you're now logging with Sentry. Now you can go ahead and set up distributed tracing to see even more performance metrics and insights to see the full picture of your application health.
Debugging and logging in PHP
This guide explained how errors work in PHP and showed you how to log messages to the browser and terminal for simple debugging, how to debug interactively with Xdebug and Visual Studio Code, and how to set up an error monitoring dashboard and alerting system with Sentry. We also walked through how to send structured logs to Sentry.
Once you’re familiar with these concepts, we suggest looking into application security, performance optimization, and automated testing in PHP.


