How to Configure Lightweight Browser Tracing for Debugging at Scale


Ben Coe -


Sentry’s auto-instrumentation, using BrowserTracing, is convenient. You can get interesting insights about your frontend application out-of-the-box, such as whether slow and failing API calls are hurting your user experience (summarized in Network Requests), or how your website stacks up against industry standards for performance (summarized in Web Vitals).
A downside to auto-instrumentation is that for certain architectures a lot of spans can be created creating a hard to read trace and consuming span volume.
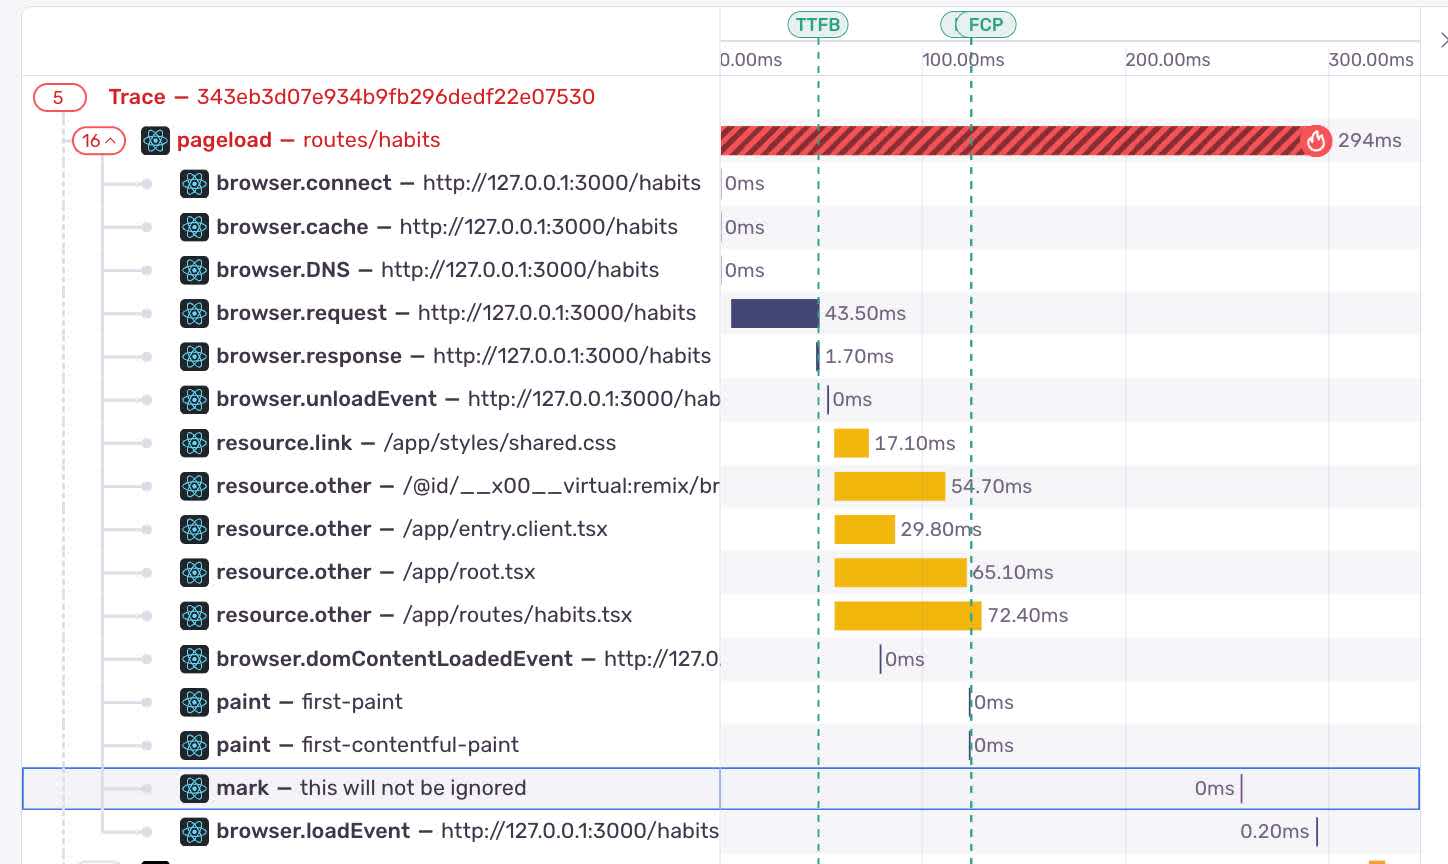
Here’s an example from my own project:
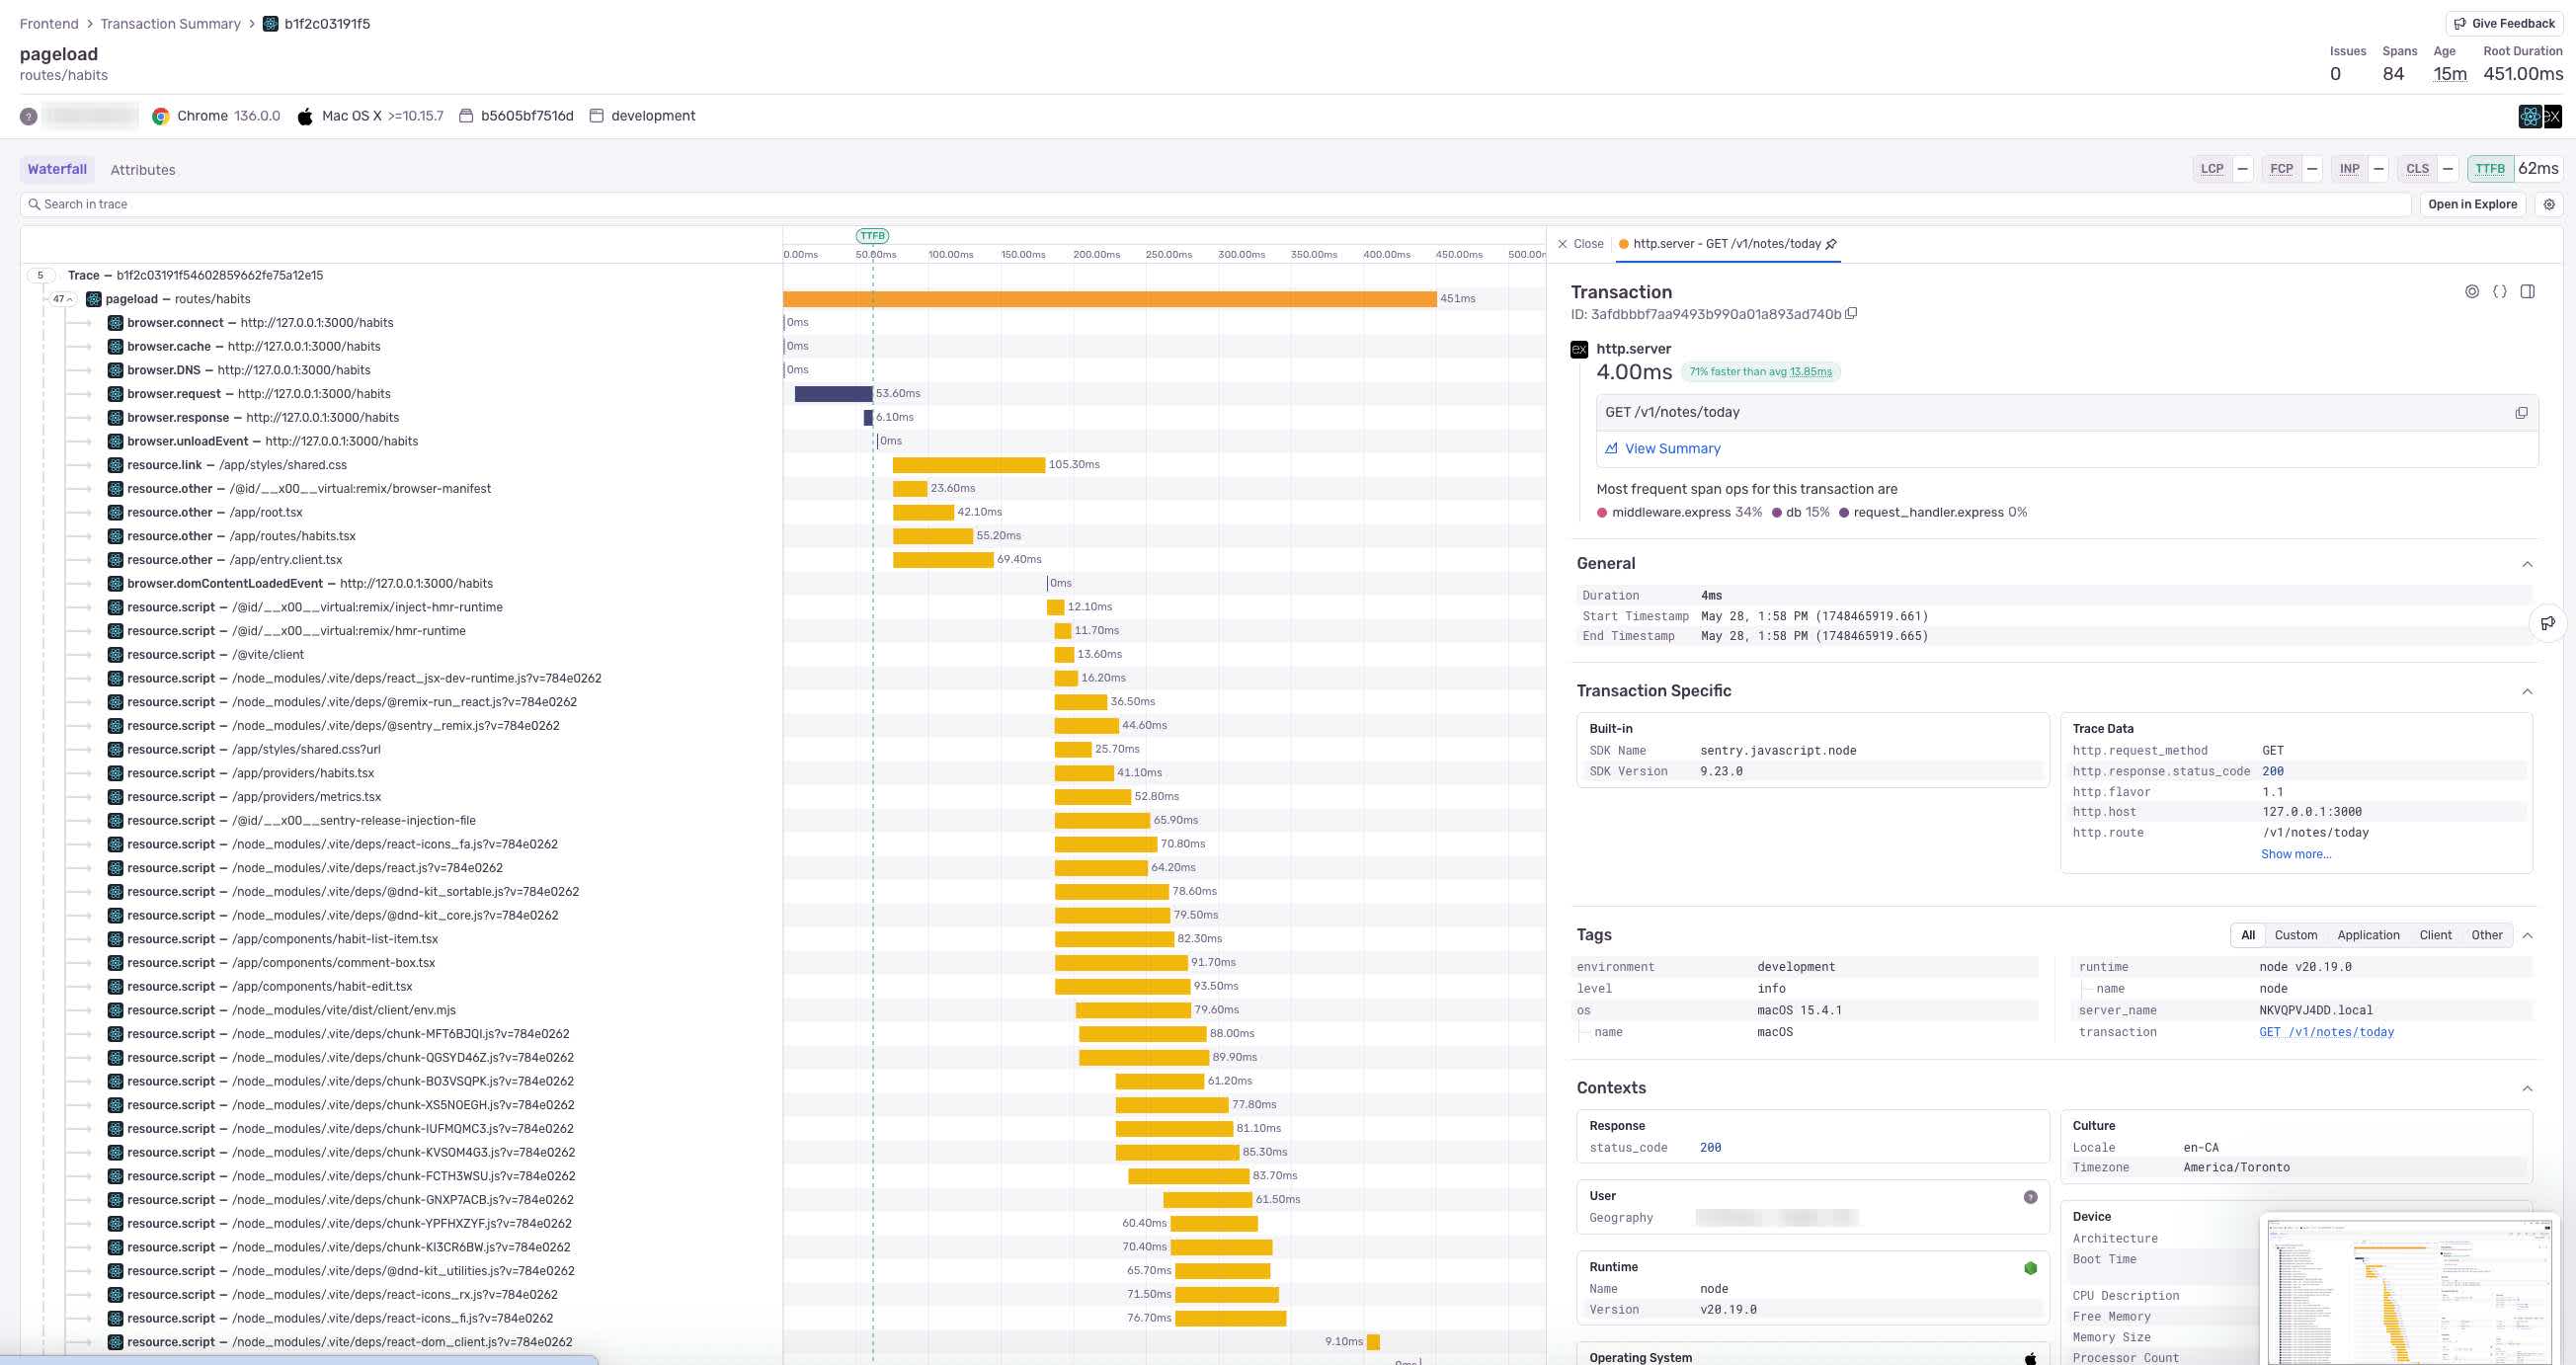
As a side-effect of running in development mode, my website loads in dozens of scripts to get up and running. This creates a large trace that’s:
Hard to read.
Uses up more of my monthly span volume than I’d like.
The good news? There’s options to cut down on span noise and make your traces more focused and readable. In this post, I’ll show you how to fine-tune your sample rate and span collection so tracing scales with you—letting you keep an eye on what matters, like whether login is slow or checkout flows are failing, and helping you actually answer the questions you care about.
Configuring the trace sample rateConfiguring the trace sample rate
tracesSampleRate allows you to control what percentage of frontend traces are sent to Sentry. For high traffic websites, you will be able to answer many interesting questions with tracing without collecting 100% of traces.
Note: A major advantage of using traceSampleRate to control span volume, vs., turning off certain spans (as discussed in Using configuration to reduce span count), is that you receive more information dense traces, useful for debugging difficult problems.
You can control the sample rate when initializing Sentry, like so:
Sentry.init({ dsn: '[MY-DSN]', // Only send 1/10 traces to Sentry. tracesSampleRate: 0.10 });
You may be asking, what’s an appropriate sample rate?
There’s no one size fits all answer to this question. Here’s a question I would ask instead, “what questions are you trying to answer with your telemetry?”.
Suppose I want to know how many times a 401 error occurs on a backend server. You can use Trace Explorer and Span Metrics to answer this question, like so:
In this example, we’re told 401 errors occur 1,000,000 times in a 24 hour period. Trace Explorer estimates this frequency taking into account the tracesSampleRate (see: "How Sampling Affects Queries in Trace Explorer”).
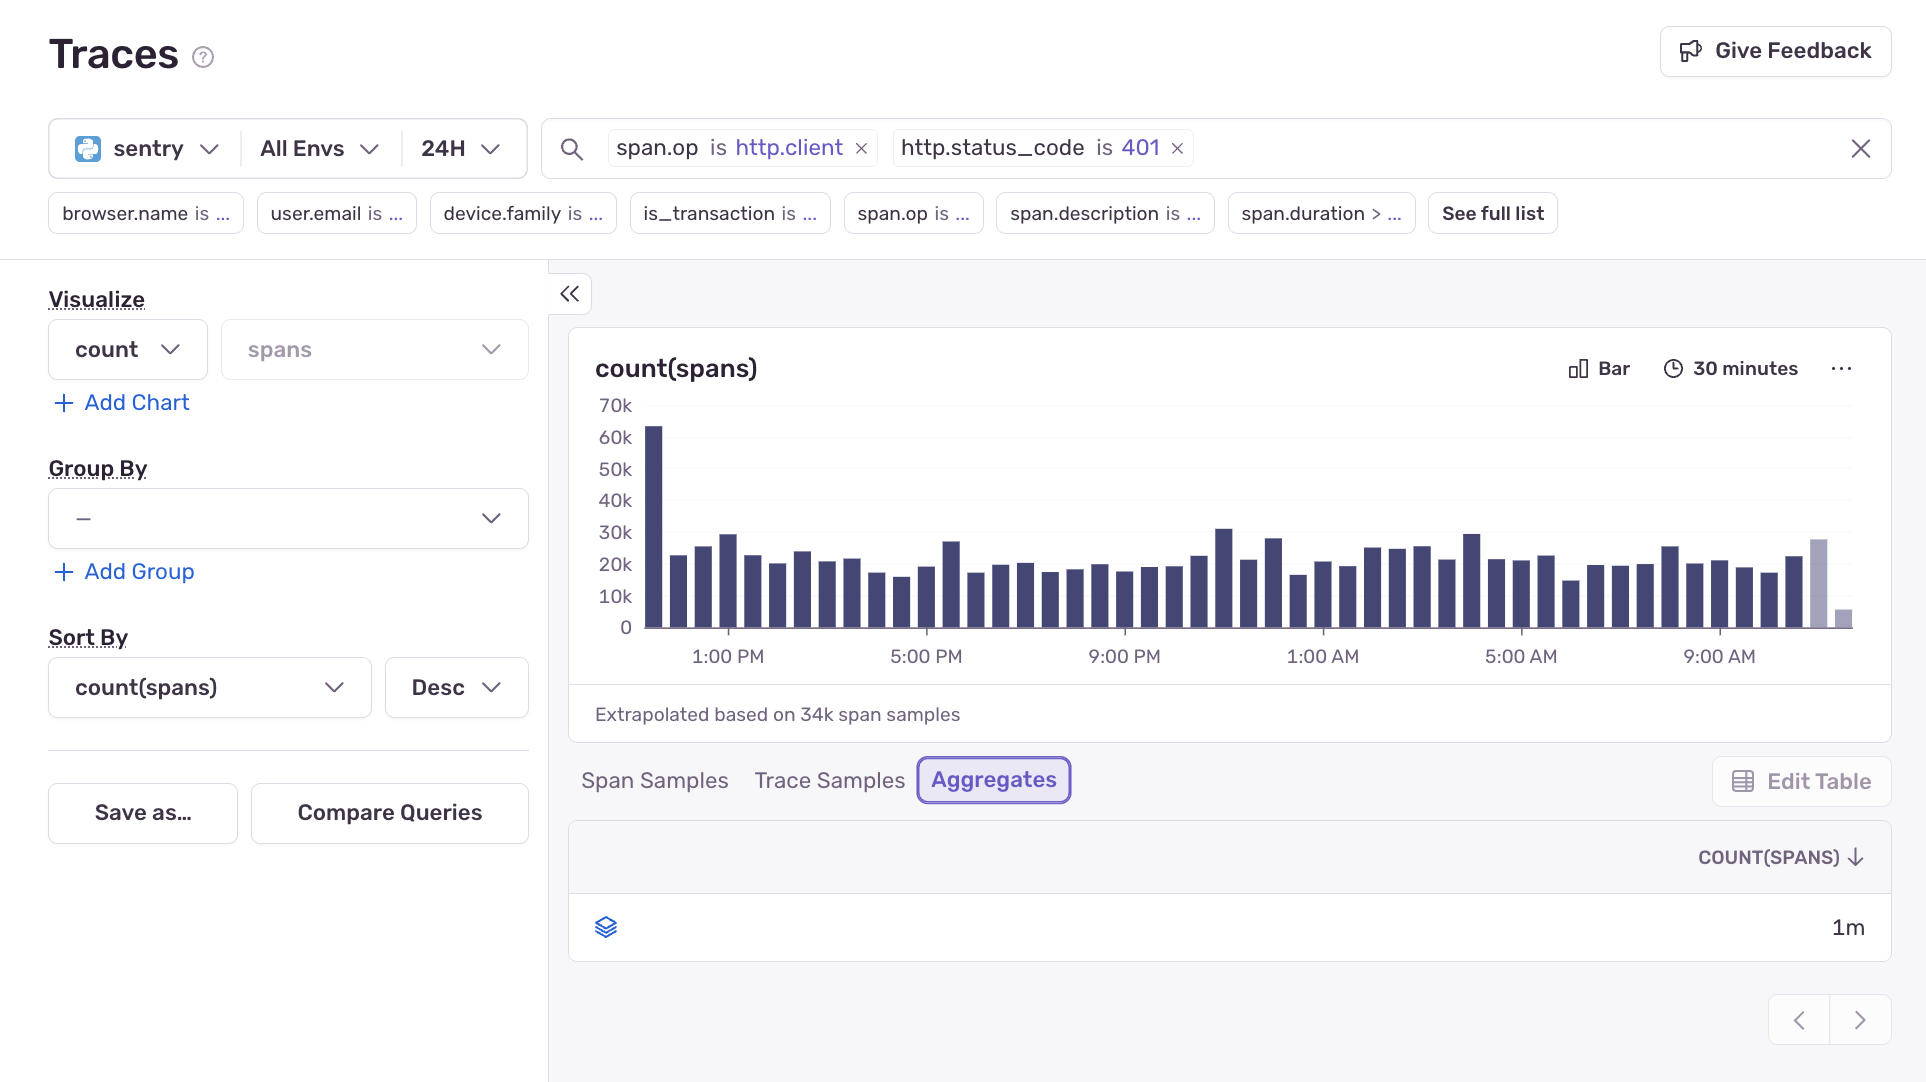
For the question, how many times a 401 error occurs on my backend server, the sample size of 34,000 (shown under the chart) gives us relatively good confidence that 1,000,000 is a reasonable estimate of the actual number of times this event occurred.
Now, suppose I have a more specific question. How many successful frontend API calls were made by users in Romania? Again you can answer this question in Trace Explorer, like so:
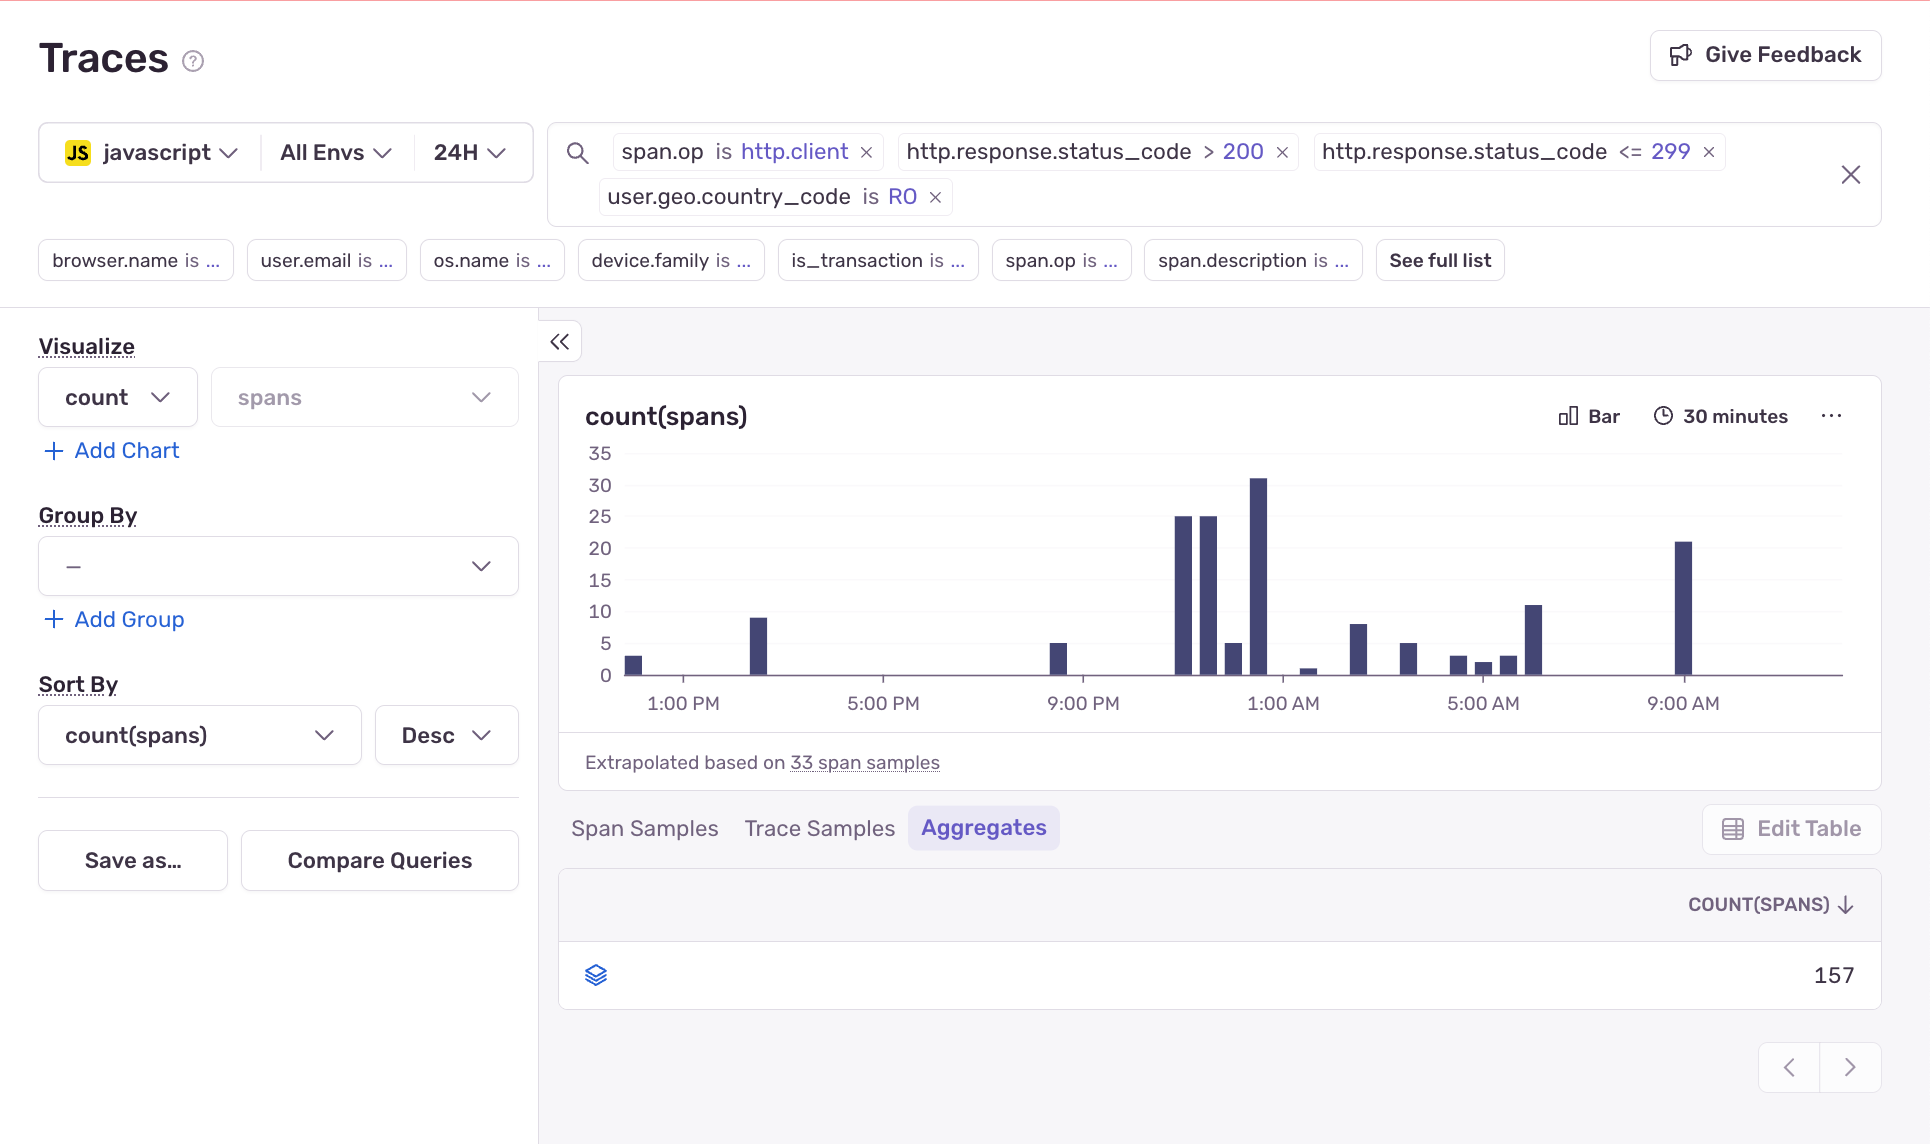
Trace Explorer estimates that we receive 157 2xx status API calls from Romania. However, looking closer, we see that this figure is based on only 33 samples.
Given the small number of samples this estimate is likely to be more variance than our prior example, which had 34,000 spans to work with.
If answering “How many successful frontend API calls were made by users in Romania?” is critical to your business, you may need to keep a higher sample rate.
Let’s talk about some ways you can reduce your span volume without lowering your sample rate.
Using configuration to reduce span countUsing configuration to reduce span count
BrowserTracing out-of-the-box instruments several different types of spans in your application:
browser- information about the pageload request lifecycle (entry typenavigation).resource.*- resource timing information containing the duration of how long images, CSS, JS files etc. took to load.measure- custom time measurements. Some of them are set by our SDK, some by SDK users or 3rd parties, some by the browser.mark- custom time markers. Some of them are set by our SDK, some SDK users or 3rd parties, some by the browser.paint- paint timing information.ui.long-animation-frame- a span showing the duration of a long animation frame event detected by the browser.Web Vitals measurement spans, such as CLS and LCP.
http.clientspans, which tell you about your websites interaction with a backend API.
Depending on the questions you’re trying to answer about your website performance, you may be able to turn off some of these spans simplifying your trace and reducing your span volume.
Ignoring resource spansIgnoring resource spans
Render blocking resource spans can be a major contributor to a bad frontend user experience. When you’re digging into frontend performance issues they’re a great starting point, ask yourself:
Have you optimized the script files and other assets required to bootstrap your website: removing unused dependencies, minifying code, and
Have you bundled the JavaScript critical to bootstrapping your website into a small number of files?
Are you serving your assets from a CDN?
tldr; resource spans are important and shouldn’t be ignored. However, turning off certain resource spans can be also be a good way to reduce your span volume without reducing your sample rate.
To ignore resource spans, simply pass an array of strings to ignoreResourceSpans when initializing the Sentry SDK. The strings in this array correspond to the prefix you will see on spans in your trace (resource.script, resource.other , resource.link, to name a few).
Sentry.init({
  dsn: '[MY-DSN]',
  tracesSampleRate: 0.2,
  integrations: [
    Sentry.browserTracingIntegration({
      ignoreResourceSpans: ['resource.script']
    }),
  ]
});
In my own case, I was able to reduce spans by 65% turning off the resource.script resource span:
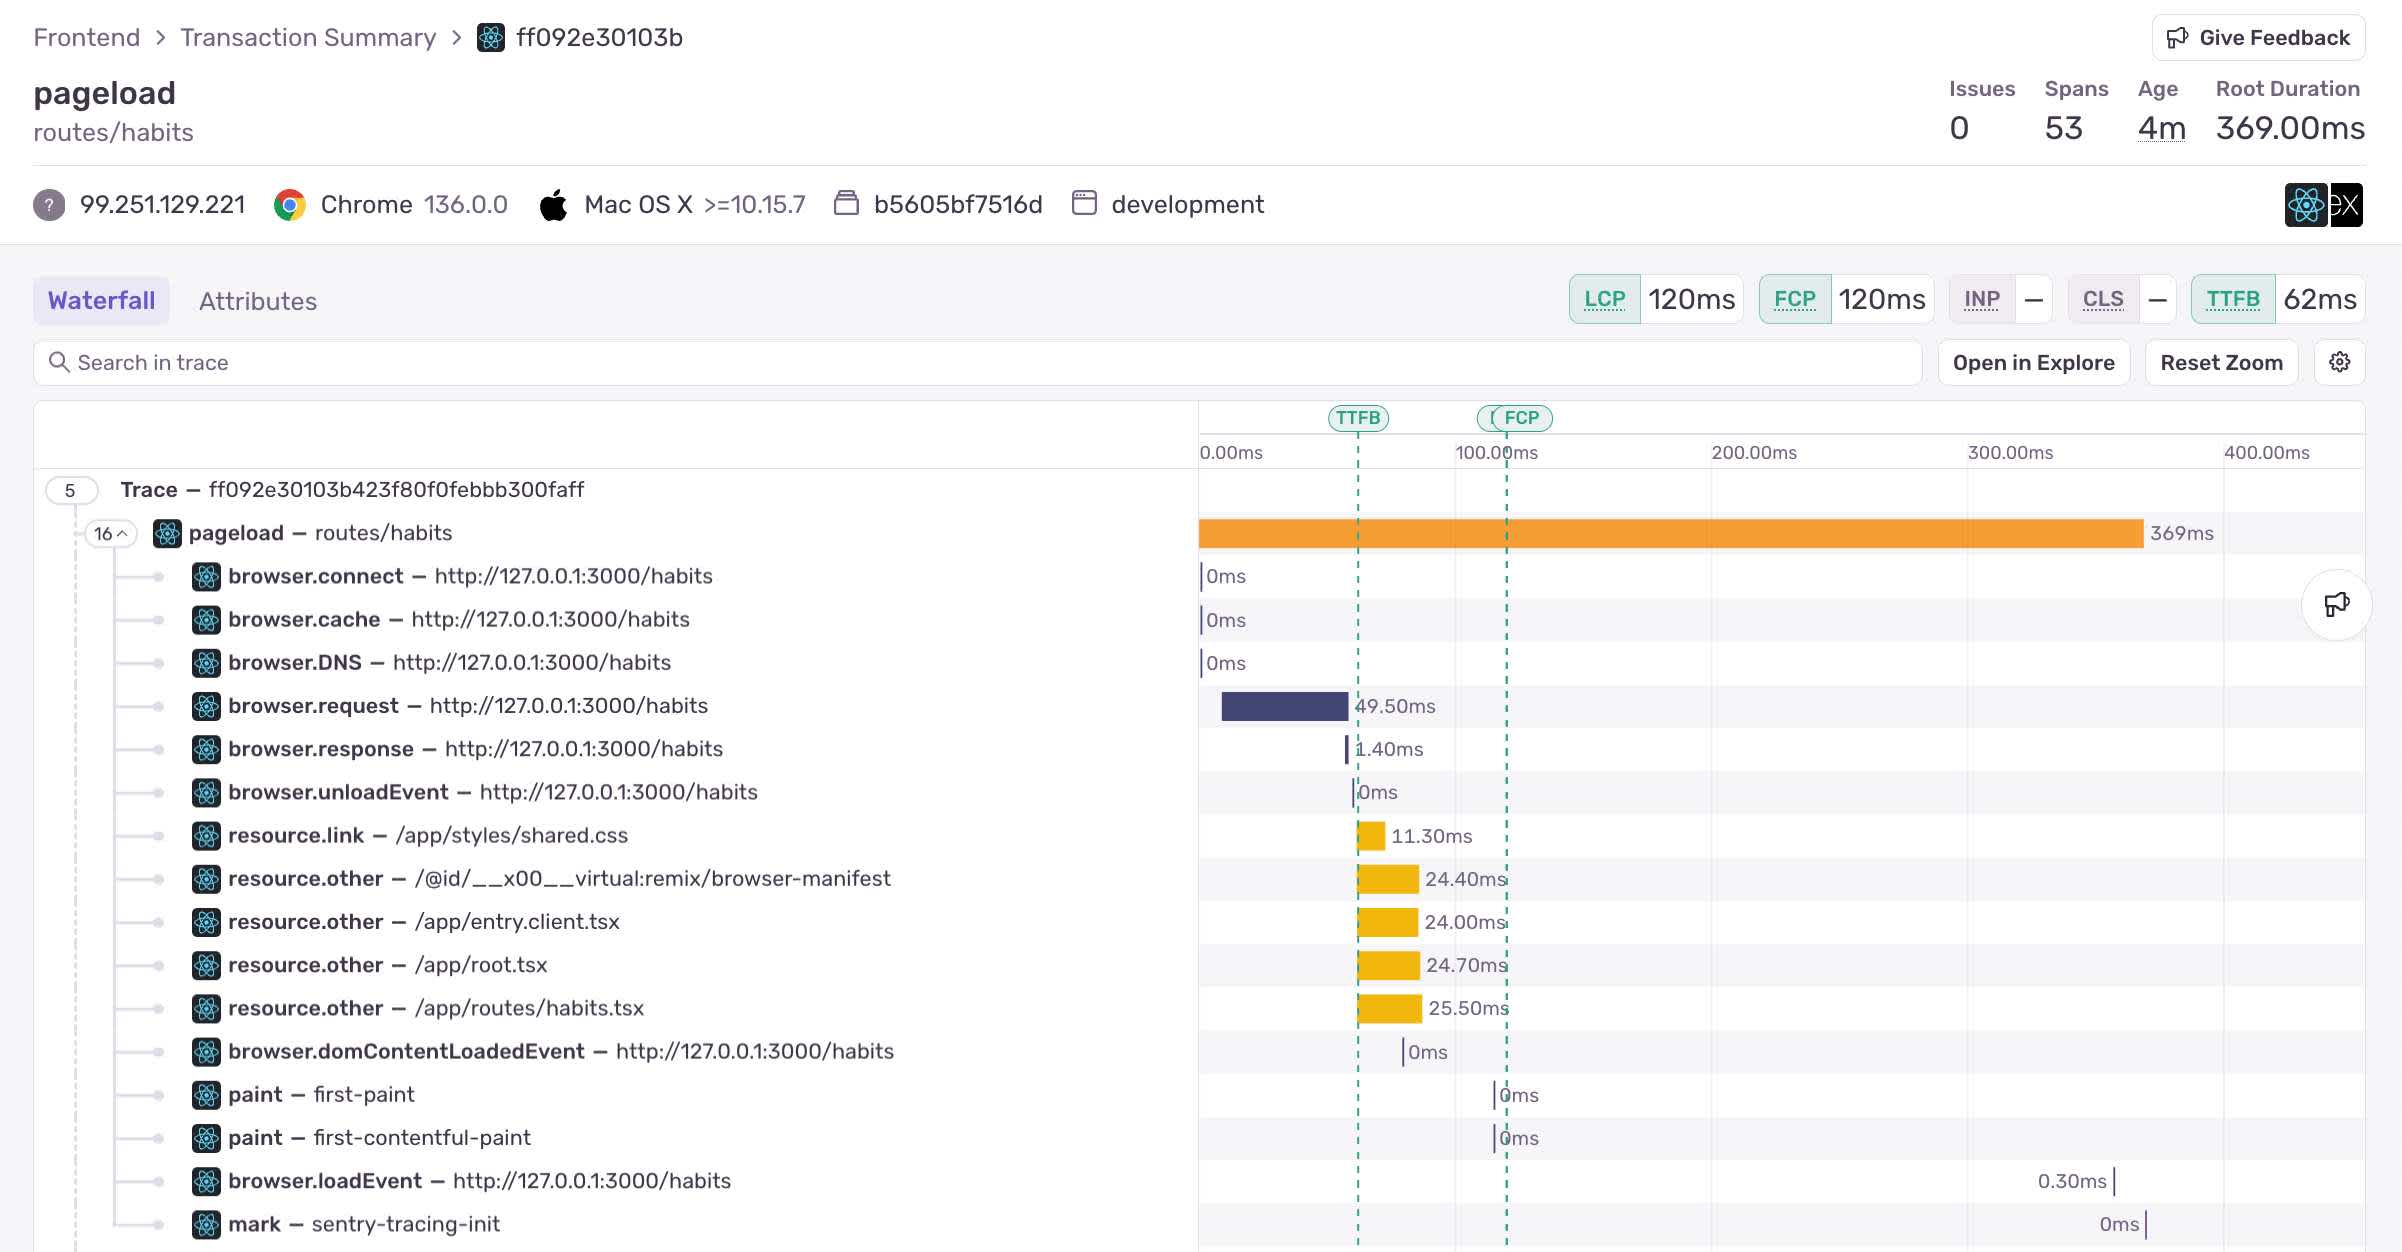
Removing resource.script spans reduces the trace size by 65%.
Ignoring resources spans is likely to give you the biggest bang for your buck, in terms of reducing frontend span volume. However, depending on the structure of your trace, here are some other configuration settings you might consider for reducing your trace size.
shouldCreateSpanForRequest to reduce http.client spansshouldCreateSpanForRequest to reduce http.client spans
shouldCreateSpanForRequest to reduce http.client spanshttp.client spans tell you whether your frontend has slow or failing interactions with backend APIs (summarized in Network Requests).
There may be some cases where your trace has many http.client spans that you’re not getting value from. As an example, perhaps you also have the backend API instrumented and find you get enough information from the http.server spans created corresponding to your frontend’s http.client calls.
You can turn off http.client spans specifically for your API using shouldCreateSpanForRequest:
Sentry.init({
  dsn: '[MY-DSN]',
  tracesSampleRate: 1,
  integrations: [
    Sentry.browserTracingIntegration({
      shouldCreateSpanForRequest: (url) => {
        if (url.includes('127.0.0.1:9999/some-api-i-control')) {
          return false;
        } else {
          return true;
        }
      },
  ],
});
Turning off Long Animation FramesTurning off Long Animation Frames
If you’re seeing a lot of Long Animation Frames in your trace, this is a good indication that your frontend has noticeable lag and feels janky. You should probably fix this.
However, you may still have good reason to turn off long animation spans. Perhaps, for instance, you have Profiling set up which gives you a deeper understanding of the underlying root cause of UI jank.
You can turn off Long Animation Frames like so:
Sentry.init({
  dsn: '[MY-DSN]',
  tracesSampleRate: 1,
  integrations: [
    Sentry.browserTracingIntegration({
      enableLongAnimationFrame: false,
    }),
  ],
});
Ignoring mark and measure spansIgnoring mark and measure spans
The browser mark() and measure() APIs allow you to measure arbitrary events during the lifecycle your frontend session. For instance, you could add a performance mark to tell you when a specific component loads on the page during a pageload.
Sentry represents browser measurements and marks as spans in your trace:
In some cases, marks and measures are added automatically by the Sentry SDK and its integrations.
If you’re finding that you’re not getting value out of these browser performance spans, or that too many are being added, you can turn them off using the configuration setting ignorePerformanceApiSpans , like so:
Sentry.init({
  debug: true,
  dsn: '[MY-DSN]',
  tracesSampleRate: 1,
  integrations: [
    Sentry.browserTracingIntegration({
      ignorePerformanceApiSpans: ['ignore me please', /sentry/],
    }),
  ],
});
This configuration takes either a string or regex which should match the text after the hyphen for the mark or measure span you wish to ignore.
Summing things upSumming things up
Sample rates are a great way to manage your span volume, but not the only way. You can customize your auto-instrumentation to reduce the number of spans you’re sending and simplify your traces.
When considering both sample rate and configuring auto-instrumentation, you should be asking “what questions you’re trying to answer?”.
Very specific queries, like how people are using your application in a certain region of the world, may require a higher sample rate to answer questions accurately.
Turning off certain resource spans can reduce your trace size, but may make it harder to solve certain problems, like identifying scripts that are blocking your webpage from loading.
We’re here to help, hit us up on Discord if you have questions about sample rate, tracing configuration, or anything else (within reason… I won’t, for instance, give investment advice).