A VP of Engineering (from a company I’m not allowed to name) told me recently: “You helped us find and fix real user-facing issues. Now we need to convince our CTO why that matters more than the standard SLO’s and systems.”
Here’s the thing: your CTO is not wrong in measuring the systems and basic uptime. That’s the baseline though. They’re all trying to watch everything, but they’re_ seeing_ nothing as it relates to users.
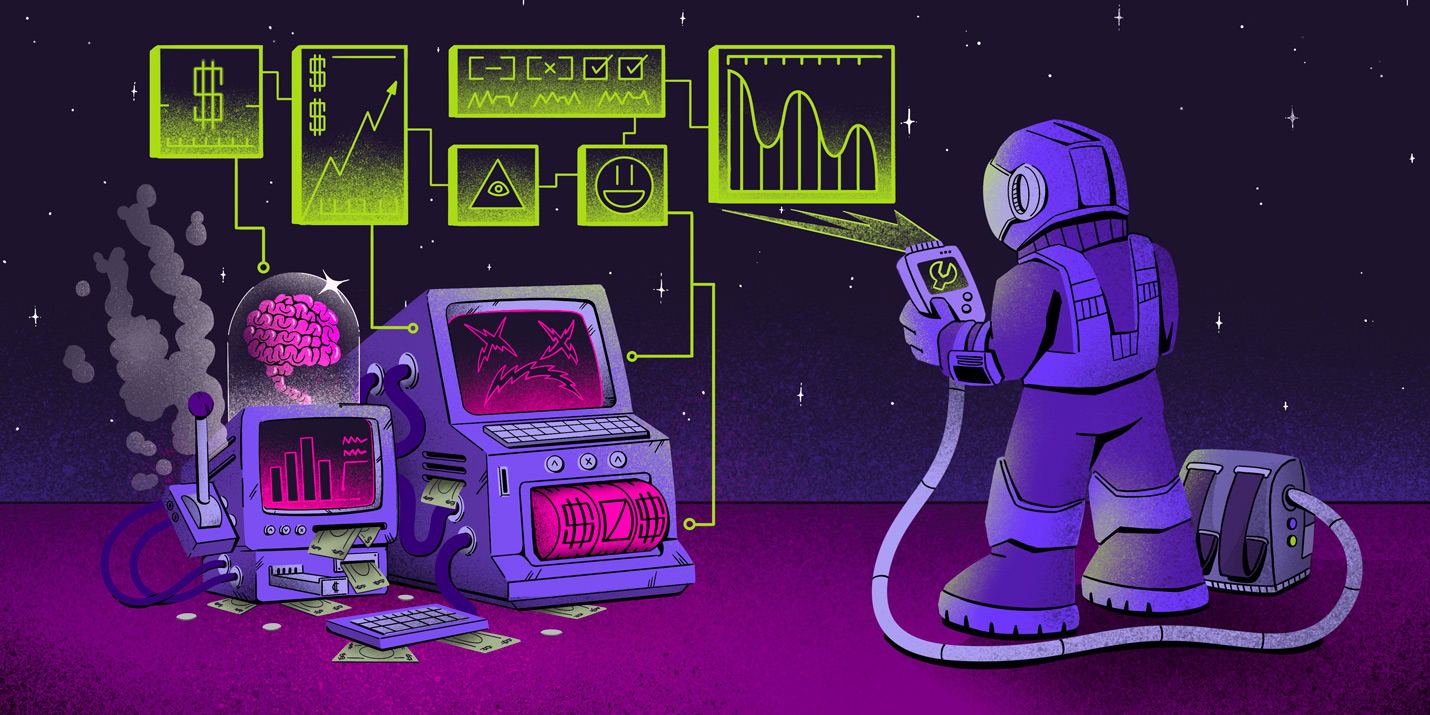
The traditional monitoring trap
Uptime looks great. Latency is within SLOs. Error budgets are fine. Dashboards are green.
And yet: your users are still failing. Not because your system is down. Your system is fine. But somewhere between “user clicks button” and “user gets what they wanted,” something broke. Silently. No alert. No threshold crossed. Just a user who gave up and left.
Code breaks. That’s not the scandal. The scandal is found out three weeks later when it’s escalated by the sales team because a big customer is frustrated and leaving.
Money moments
Every product has a handful of “money moments” — the specific hyper-crucial parts of your product where the user succeeds or you lose money. Not “is the API up.” Not “did the page load.” The actual thing they came to do.
Just a few examples we’ve heard of recently:
A retailer hit perfect uptime through Black Friday,but… Conversion dropped 12%. The money moment — a user completing checkout — was broken for anyone with a specific browser extension. No server errors. No alerts. Three weeks of lost revenue. The fix took an hour. Realizing the issue existed took forever.
A payments company met every SLO,but… Customers complained about “random” failures. The money moment — a transfer that actually completes and confirms — was failing intermittently for cross-border payments. A timeout edge case; Dashboards only showed averages. Users felt pain. Six lines of code, buried under months of noise.
A B2B platform looked healthy by every metric,but… the money moment — a new customer hitting their “aha” moment — was broken for enterprise accounts with a specific config. Sales found it before monitoring did. Dashboards all said the system was “up” but the product was broken.
Same pattern. Every time.
You’re measuring the wrong thing
Here’s the difference:
What most teams measure: Is every service running? Are metrics within thresholds? Is the system healthy?
What actually matters: Did the user succeed? If not, what code broke? How fast can we fix it?
One is horizontal. Watch everything, hope you catch something.
The other is vertical. Follow the money moment end-to-end. Know immediately when it breaks. Trace it to the release. Fix it.
You can do both. But if your dashboards are green yet users are failing, you know which one you’re missing.
What to actually do
This isn’t complicated.
Name your money moments. Not fifty different flows. Identify the three to five that determine if your product works — the ones that matter to your user, and whether or not they can do what they came to do. What are the moments where users succeed or you lose them?
Monitor them by segment. Not averages. By customer tier, by region, by device, by release. The bug that breaks your biggest customer doesn’t show up in aggregate metrics.
Tie them to releases. When a money moment fails, the first question is “what changed?” If you can’t answer that in minutes, you’re flying with your eyes closed.
Measure time-to-fix, not time-to-alert. Nobody cares how fast your dashboards turned red. They care how fast you found the broken code and shipped the fix.
This isn’t theory
Teams that monitor their money moments instead of just their dashboards keep finding the same thing.
One SaaS company had three APM tools and zero visibility into actual user flows. A dev spotted a call firing eight times instead of once buried across async queues, messaging layers, and persistence. Once they could trace the money moment end-to-end, they fixed it in minutes. Before? That would have taken days of log spelunking.
An influencer marketing platform found a 50-second page load that only impacted power users, and kept them from accessing one of the most critical workflows. By tracing the user flow instead of just watching service health, they identified the broken release in five minutes and had it fixed within the hour.
A language learning app with 200+ microservices cut debugging time by 12x. One engineer spotted bot activity and confirmed it in under ten minutes — before it could slow the site to a halt and lose them users. “This has saved years of my life.”
One of the world’s biggest AI research companies learned to better detect otherwise-quiet crash loops during model training, dramatically speeding up the process of evolving from model to model. Monitoring the actual user experience instead of just infrastructure metrics made the difference.
Same pattern every time: the fix was straightforward once they could see where the money moment broke.
The bottom line
Code breaks. Always has. Always will.
The teams that win aren’t the ones with the greenest dashboards. They’re the ones who find the broken stuff fast and fix it before users notice.
Your uptime is not your product. Users succeeding is your product. Everything else is noise.
We trained and deployed a new issue grouping model that prevents 20% more duplicate issues, halves incorrect merges, and makes future model upgrades trivial.