Dashboard updates: Fewer clicks, more control, faster widget building
Dashboard updates: Fewer clicks, more control, faster widget building
You're reviewing your production metrics when suddenly an error spike appears on your dashboard. Your immediate thought isn't "how do I build a new view to investigate this?" but rather "how do I find out the cause quickly?" This is exactly what happened to one of our engineering teams last month when they spotted an unusual pattern in their API response times. Instead of running ad-hoc queries from scratch, they turned to a custom dashboard they had built after a past incident.
By correlating trends across errors and tracing data, they quickly pinpointed the culprit: a missing index causing inefficient query execution. A quick fix later, response times were back to normal—all without hours of manual investigation.
Dashboards aren’t just static reports; they’re dynamic tools that help teams spot anomalies faster, connect the dots between signals, and cut straight to the root cause.
Over the past few months, we’ve made a series of updates to improve how you build, manage, and navigate dashboards—from a redesigned widget builder to new ways to organize and protect your dashboards, you can spend less time configuring and more time focusing on what matters.
A more intuitive way to build widgets
Widgets are the building blocks of dashboards, and we’ve redesigned the widget builder to make creating and editing them easier, more intuitive, and better integrated with your workflow.
Side-panel design - lets you build and edit widgets without leaving the page
Live preview - updates instantly as you tweak settings, without requiring extra scrolling or dealing with sticky headers.
Streamlined layout - with less visual clutter, you can quickly identify the necessary steps to build queries faster.
Refined widget library access - lets you choose between building a widget from scratch or starting with a prebuilt one without taking up space in the builder.
This update simplifies widget creation while keeping the flexibility you need to customize dashboards to your exact requirements.
Keep dashboards exactly how you designed them
It’s release day, and your team is closely monitoring a Critical Release Dashboard to catch any issues before they escalate. Errors, latency, throughput—everything you need is right there. Or at least, it should be.
But when things start going sideways, you realize your failure rate chart is missing, filters have changed, and your latency widget is now showing p50 instead of p95. Someone edited the dashboard. Now, instead of quickly spotting the issue, you’re scrambling to fix the view—wasting precious minutes during an incident.
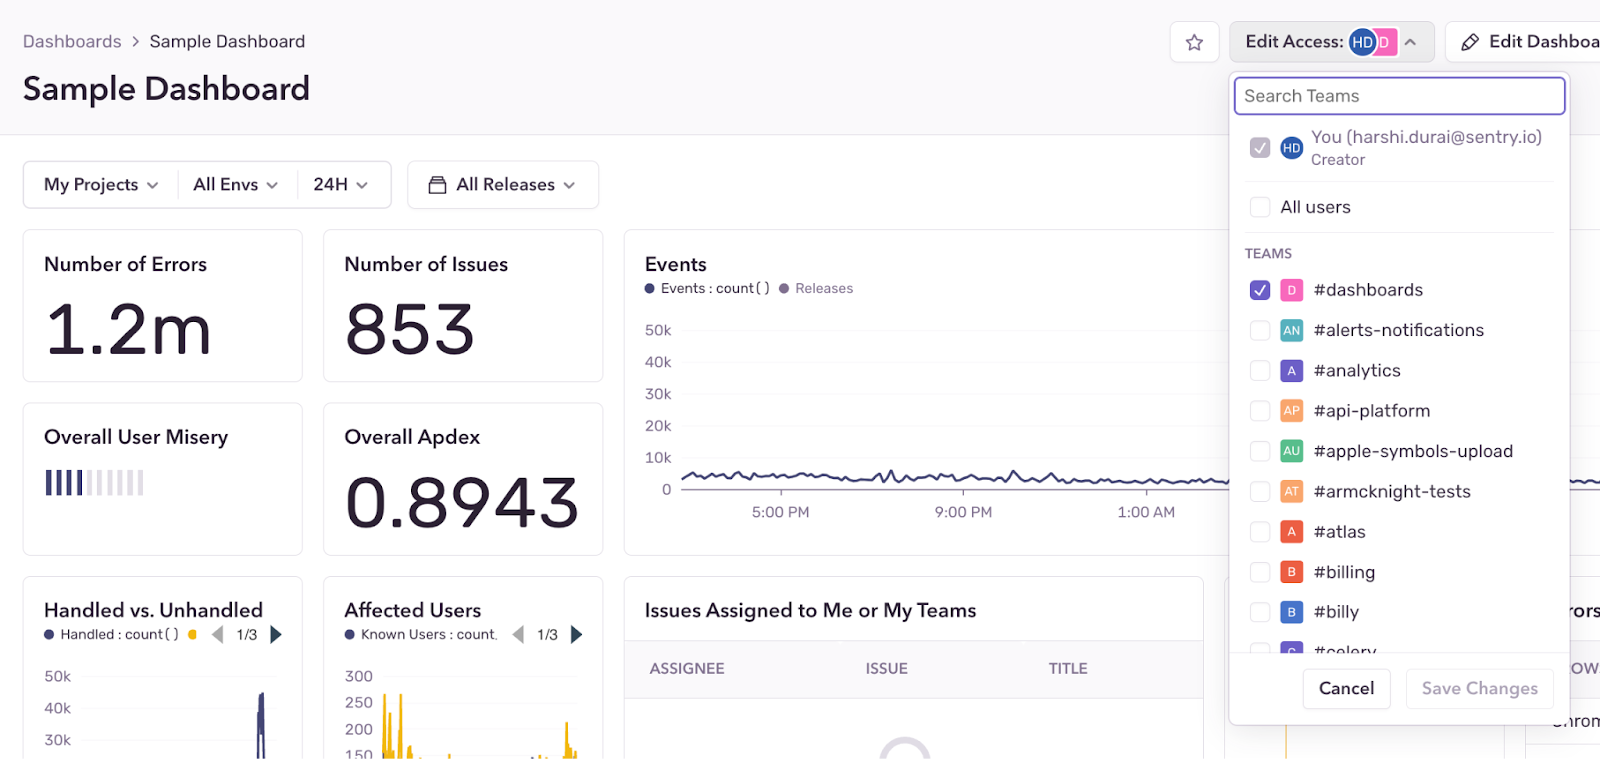
Dashboards should reflect the insights you care about most—without unintentional changes from other teams. You now have the option to control who can edit your dashboards.
This means now you can keep your critical release health dashboard locked down or give access to just your team. The new Edit Access selector gives you just the right level of control—because sometimes the best collaboration happens with clear boundaries.
Favorite and organize dashboards
As your collection grows—separate dashboards for monitoring your checkout flow, authentication flows, and key API endpoints —finding the right one quickly becomes important. That's why we’ve introduced dashboard favoriting—so you can pin important dashboards to the top of your list.
Just click the ⭐ icon on the Dashboard Details page or Dashboards landing page, and your most-used dashboards will always be within reach.
We’ve also added a Table View, giving you a more compact way to organize and manage dashboards. Now, you can switch between:
Grid View – A visual card-based layout
Table View – A condensed, tabular format
Together, these updates make it easier to stay on top of your dashboards, whether you prefer a clean grid of key metrics or a sortable list of insights.
Getting started
With Sentry’s dashboards, you can go beyond monitoring and straight to resolution. When you notice a spike in transaction failures, you can drill down directly to the exact database query that's slowing down or the specific exception being thrown in your code. This connection between high-level metrics and implementation details means you can identify, diagnose, and fix issues without constant context switching.
These improvements reflect our ongoing commitment to making monitoring and debugging more straightforward. And we’re just getting started—expect more improvements in the coming months.
Available to all Business and Enterprise plans, jump into dashboards to create your own.
Don’t have a Sentry account yet? No problem—you can try it for free or request a demo to get started.


