The core KPIs of LLM performance (and how to track them)
The core KPIs of LLM performance (and how to track them)
A few months ago, I built an MCP server for Toronto’s Open Data portal so an agent could fetch datasets relevant to a user’s question. I threw the first version together, skimmed the code, and everything looked fine. Then I asked Claude: “What are all the traffic-related data sources for the city of Toronto?”
The tool call fired. I got relevant results. And then I hit an error: “Conversation is too long, please start a new conversation.” I had only asked one question.
The culprit was a huge JSON payload from the API that stuffed the context window on the first call. Easy fix once I saw it. But there are plenty of other ways an AI app without monitoring can go sideways: silent tool timeouts, runaway loops that spike token usage, slow retrieval, model downgrades that break JSON formatting, or plain old 500 errors.
Moments like these are why I’ve compiled a few key metrics I monitor to surface what matters quickly.
What makes a “good” LLM KPI?
As Rahul put it, “Prompt in and response out is not observability. It is vibes.” A good KPI is not a raw counter. It is a directional signal tied to product outcomes, especially for AI agent performance metrics.
Think in three lenses:
Reliability: Is it working correctly?
Cost efficiency: Are we spending within reason?
User experience: Does it feel fast and responsive?
The metrics below map directly to those lenses, and to real failures you have probably seen: token spikes from a loop, a flaky vector DB dragging responses, or a quiet model change tanking output quality. They also align with common search terms like LLM evaluation metrics, LLM metrics, and LLM latency, so you can find the right guidance and help others find yours.
The 10 core LLM performance metrics to capture
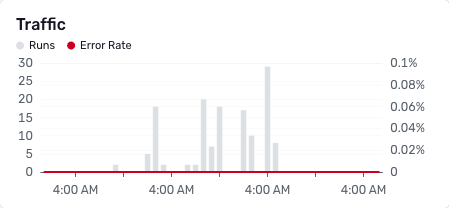
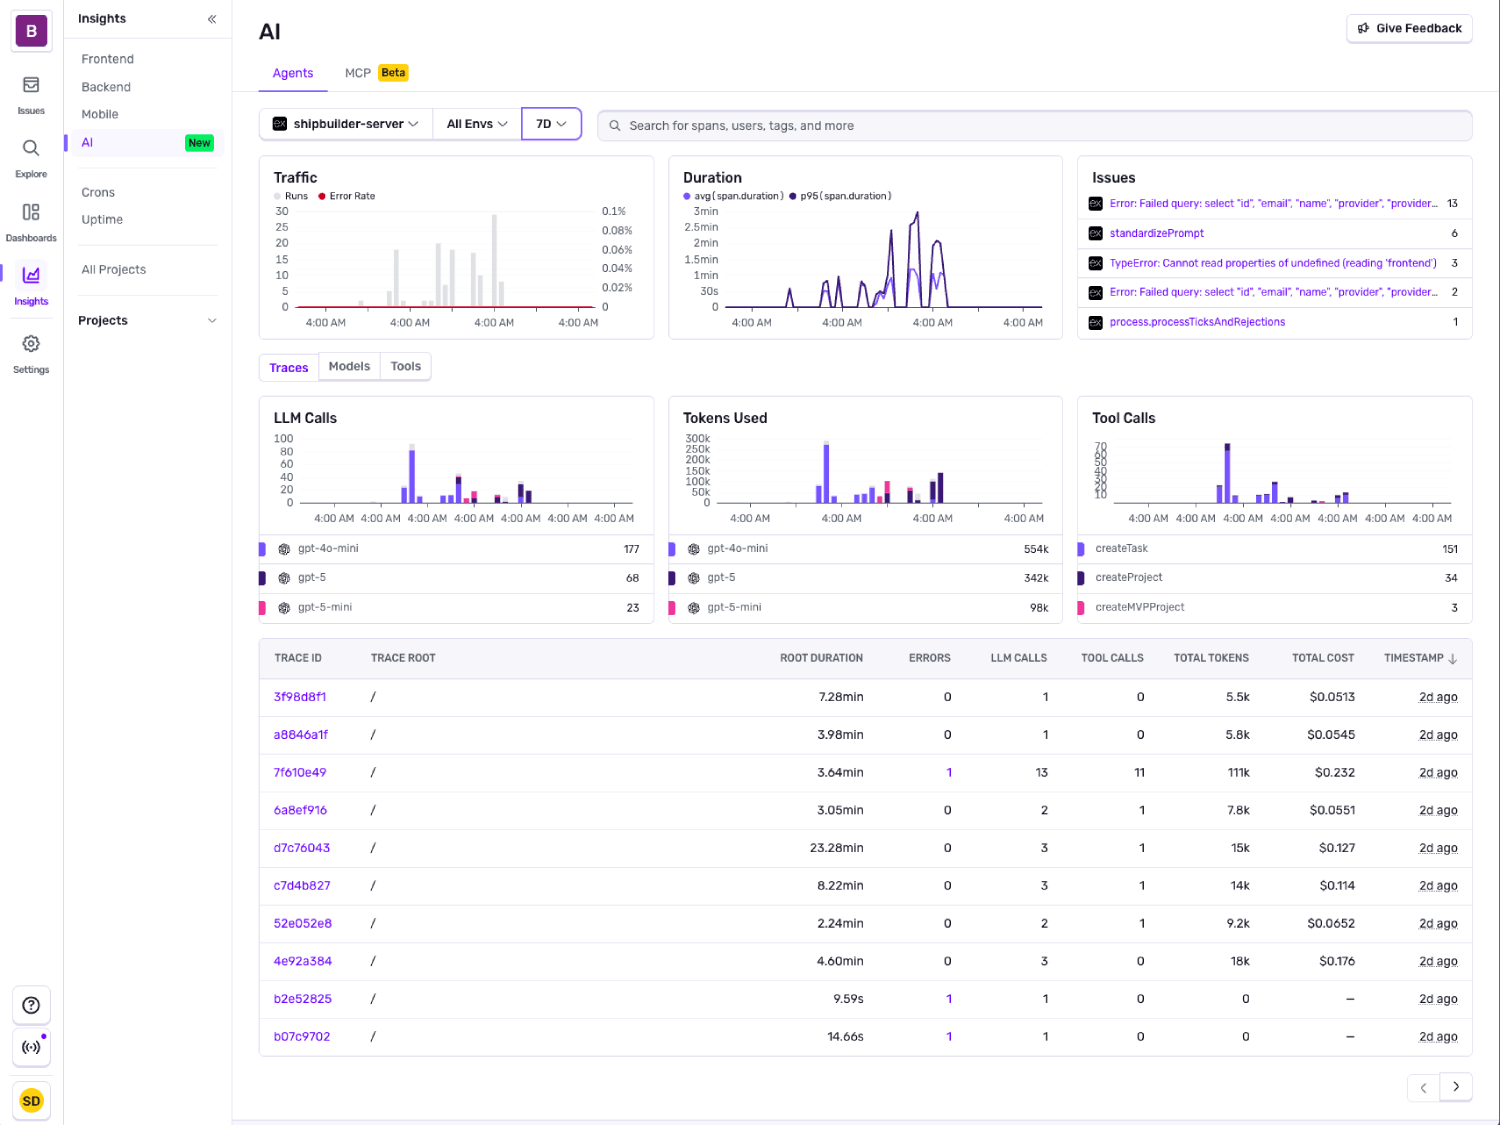
Agent traffic (Runs per time window)
What & Why: Traffic volume is your heartbeat. A flatline suggests outage. A spike might mean a loop or flash crowd.
Tips:
Plot runs per minute or hour
Overlay deploys and feature flags
Alert on flatlines and sudden 10× jumps
Lens: Reliability, UX
A healthy pattern is a predictable daily shape with gentle growth after releases; investigate if traffic flatlines for 5 minutes, spikes 3x baseline for 10 minutes, or drops more than 50 percent outside quiet hours.
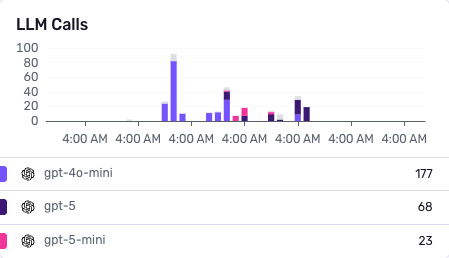
LLM generations (# of model calls by model)
What & Why: Understand your model mix. A change in model routing can increase cost, latency, or failure rate.
Tips:
Bucket by model and version
Alert on volume shifts or routing anomalies
Lens: Cost, Reliability
Under normal conditions, your routing mix is steady and changes only with deploys or flags; dig in if any model’s share shifts more than 20 percent from the 7-day median or an unexpected version appears.
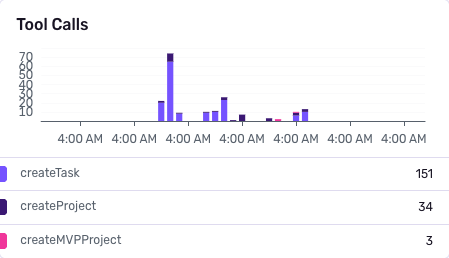
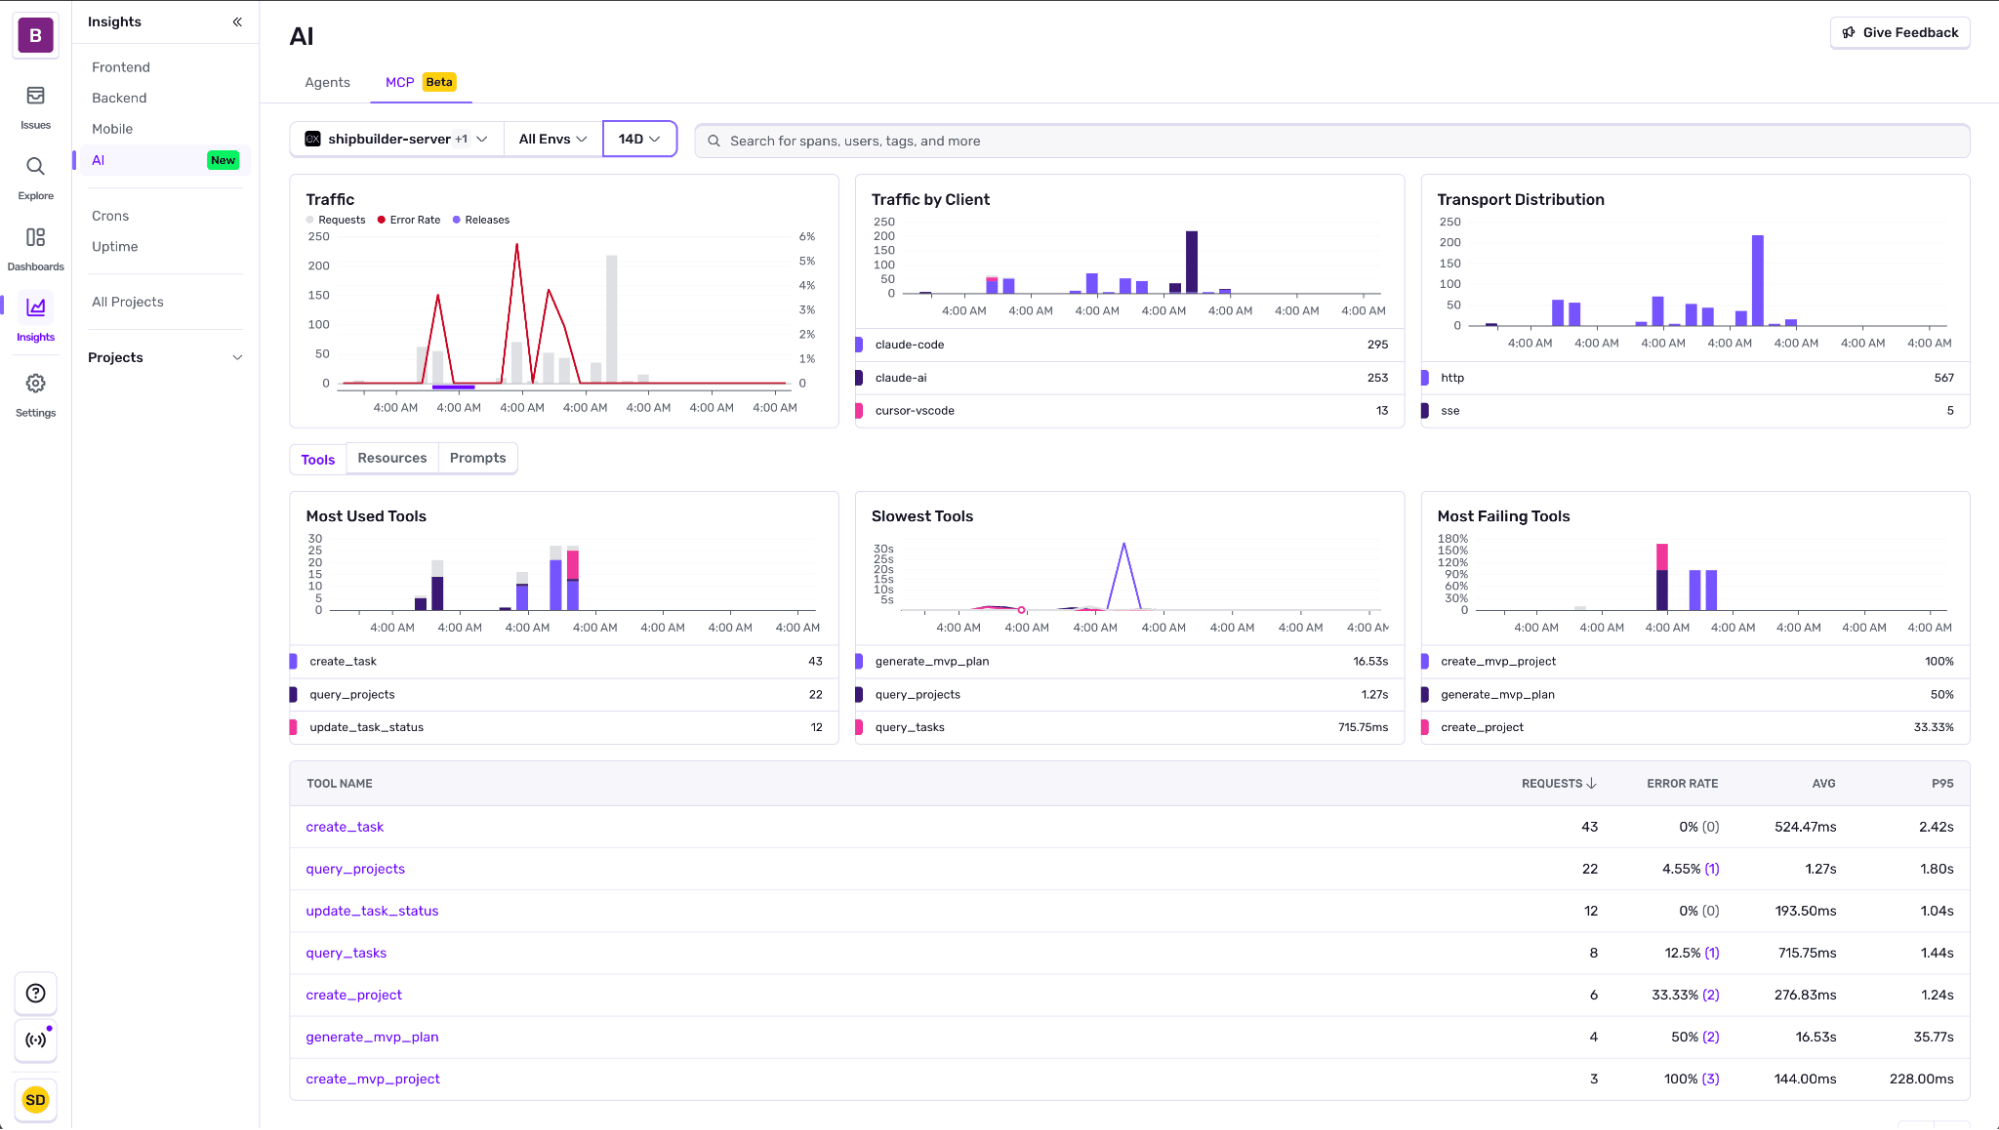
Tool calls and average duration
What & Why: Tools like search APIs, vector DBs, and functions are common failure or slowness points.
Tips:
Capture tool call counts and durations
Alert on spikes or timeouts
Lens: Reliability, UX
Aim for high success rates and a stable p95 duration; raise a flag if p95 climbs by 50 percent, timeouts exceed 1 to 2 percent, or new error classes cluster for a tool.
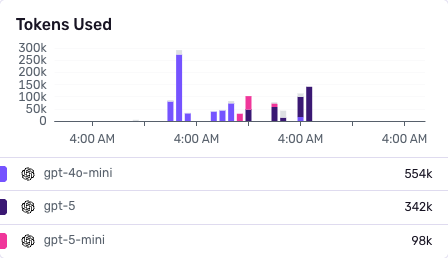
Token usage (Prompt, completion, total)
What & Why: Tokens directly drive cost and latency. Spikes often point to loops or prompt bugs.
Tips:
Track tokens/request, per model
Alert on outliers or hourly surges
Lens: Cost, UX
Typical behavior is stable tokens per request by route and model; investigate jumps of 50 percent, hourly token surges, or a growing tail near the 99th percentile.
LLM Cost (Aggregated Spend)
What & Why: Cost climbs with traffic, token bloat, or model swaps. Catch spend spikes early.
Tips:
Calculate cost/model
Alert when daily budget or per-request cost thresholds are exceeded
Lens: Cost
Cost looks healthy when per-request spend tracks your target and daily totals stay within budget; react if cost rises faster than traffic or per-request cost climbs after a prompt or routing change.
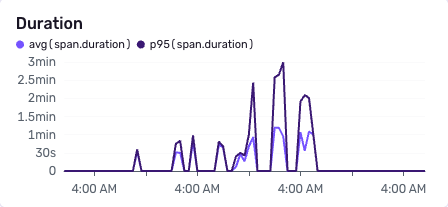
End-to-End latency (p50 / p95 + First token)
What & Why: Full response time matters but first-token latency is what the user feels.
Tips:
Track p95, p99, and first-token latency
Alert on regressions compared to weekly baseline
Lens: UX
Good UX shows a steady first-token time and p95 within your SLO, with p95 roughly 3 to 4 times p50 at most; watch for first-token increases while totals stay flat, or a 20 percent p95 regression versus a rolling baseline.
Critical step duration
What & Why: Break down generation into stages—retrieval, LLM call, post-processing. This isolates bottlenecks.
Tips:
Use spans or structured logs per step
Alert on max duration per stage
Lens: Reliability, UX
In a balanced run, no single stage dominates; investigate if one stage exceeds 60 percent of total time or its p95 jumps versus the 7-day baseline.
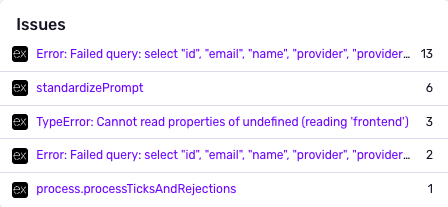
Error count and error rate
What & Why: Errors include tool call failures, JSON parsing errors, model timeouts, or misroutes.
Tips:
Group by error class
Alert on error % above threshold (e.g. 5%)
Lens: Reliability
Healthy systems keep error rate low and stable, with few parsing or timeout issues; act if overall errors exceed 5 percent or class-specific spikes appear, for example JSON parsing, timeouts, or 429s.
Agent invocations and nesting depth
What & Why: Multi-agent orchestration gets complex fast. High depth often signals runaway loops.
Tips:
Track depth of calls per request
Alert on depth > 3 or abnormal fan-out
Lens: Cost, Reliability
For controlled orchestration, depth stays between one and three and fan-out is bounded; dig in if depth exceeds three, invocations per request surge, or tokens rise without matching user traffic.
Handoffs (Agent → Agent or human)
What & Why: Handoffs indicate poor coverage or user friction. Rising handoff rate is a quality red flag.
Tips:
Log escalation events
Alert on handoff % increase
Lens: UX, Reliability
The target is a low handoff percentage trending down over time; investigate week-over-week increases or clusters on specific intents, routes, or models.
Most modern LLM-observability tools (like Sentry) expose these with minimal config, below are some dashboards and alerts you can set up in Sentry to keep track of these.
Getting started with Sentry’s AI observability
Here is a minimal Node.js example using the Vercel AI SDK. Once enabled, Sentry's AI observability captures model calls, tool executions, prompts, tokens, latency, and errors. You can then build alerts and dashboards around the LLM metrics that matter.
import * as Sentry from "@sentry/node";

// Sentry init needs to be above everything else
Sentry.init({
  tracesSampleRate: 1.0,
  integrations: [Sentry.vercelAIIntegration()],
});

import { generateText } from "ai";
import { openai } from "@ai-sdk/openai";

// Your AI agent function
async function aiAgent(userQuery) {
  const result = await generateText({
    model: openai("gpt-4o"),
    prompt: userQuery,
    experimental_telemetry: {
      isEnabled: true,
      functionId: "ai-agent-main",
      recordInputs: true,
      recordOutputs: true,
    },
  });

  return result.text;
}
With this setup, each agent run links to a full trace. That makes it easy to confirm a fix, for example a slow span improves, and to watch for regressions with alerts for p95 latency, tokens per request, and error rate.
Your LLM ops cockpit: Dashboards and alerts to set on day one
You can find more information about the different AI agents and MCP monitoring tools in our documentation.
Beyond the default views we provide, here are a few examples of how you can instrument custom dashboards and alerts to help keep tabs on reliability, cost-efficiency, and user experience.
Daily cost by model
Having a clear understanding of cost across different models all in one single widget instead of going to the provider dashboards simplifies your operations. Pair it with an alert for high spend instead of waiting for the bill to come in at the end of the month.
End-to-end latency
Beyond cost it’s also really important to understand how each model is performing. The 3 data points that are useful to understanding user experience are:
Average AI response milliseconds to first chunk: how long it took before you got the payload from the LLM
P50 AI response milliseconds to finish: general user experience of a complete LLM response
P95 AI response milliseconds to finish: gives insight into anomalies you might want to look into
Quick wins that pay off immediately
Overlay deploys and flags so KPI spikes line up with changes, which speeds up root cause analysis.
Start with tokens, cost, p95 latency, and error-rate alerts to catch costly regressions with minimal noise.
Keep operational telemetry, not prompts or outputs, so you meet privacy needs without losing the metrics your alerts depend on.
Other LLM metrics you’ll probably also want to track
Hallucination and factual accuracy rate
Toxicity and bias scores
Retrieval precision and recall for RAG
User sentiment, thumbs up or down, CSAT
Hardware utilization, CPU and GPU
Prompt quality and versioning
Policy violation counters
Next steps to keep LLMs in check
You do not need dozens of charts. You do need the right performance metrics for AI agents: traffic, tokens, cost, latency, including first-token latency, errors, and a few orchestration signals. Audit your current observability setup against these LLM evaluation metrics, plug the gaps, and set a few sane alerts. If you already use Sentry for errors or traces, enable AI Agent Monitoring and see these dashboards in your own app. You can also check out or documentation for AI observability.

![[Upcoming Workshop] Building and Monitoring AI Agents and MCP servers banner image](http://images.ctfassets.net/em6l9zw4tzag/72NEaA4KpL72uA7oWCIBio/b730f8fc0046e71103b4143d96225f54/building-mcp-servers-workshop-1200x1200-compressed.jpg)