Building an Observable Enterprise App
Building an Observable Enterprise App
Once an app is launched to market, it’s up to the engineering team to ensure that it continues to meet its SLAs. See how we use VMware Tanzu Observability (Wavefront) and Sentry to proactively monitor and fix issues before they become production problems.
Every engineering leader has experienced the anxiety and stress of taking an app to production. It’s a mix of excitement and trepidation – your creation will be used in real life, but what if something goes wrong? The culmination of multiple teams’ efforts – from engineering, SRE and sales, to product management and marketing, just to name a few – are on the table.
To get your app across the line, several quality, operations and security checkpoints need to be passed. While this minimizes the probability of something obvious being wrong, the ultimate responsibility of meeting the app’s SLA rests with the engineering team.
Solving the challenge of running an app in production
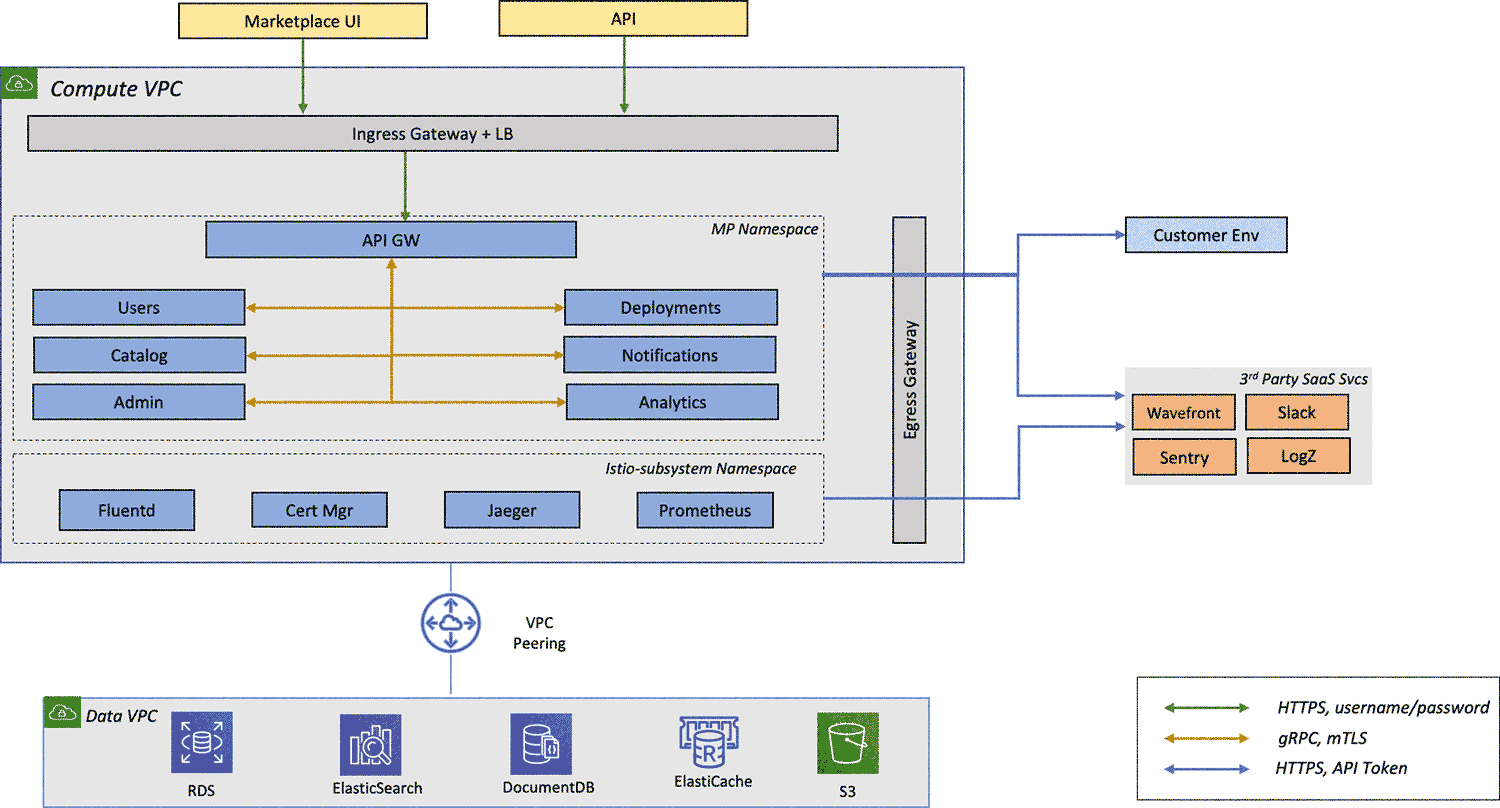
Below, I’ll talk about the observability pattern developed by my team to prepare ourselves for the challenge of running an app in production. For reference, Cloud Marketplace by VMWare is a microservices-based app built on Kubernetes (K8S).
Below is an abstracted diagram of our app structure:
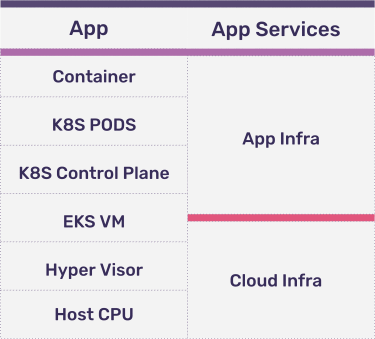
An abstracted compute stack for a microservice looks like:
If you are running a managed K8S cluster such as Amazon Elastic Kubernetes Service (EKS), it’s generally the cloud provider’s responsibility to maintain the cloud infrastructure layer. However, we have seen cases where the EKS worker node VMs must be monitored and configured for appropriate loads and set with correct auto-scale parameters, so we include part of it in our app infrastructure layer.
We use VMware Tanzu Observability (aka Wavefront) to monitor our app infrastructure stack. For the VMs, we monitor CPU, Memory, N/w I/O and Storage I/O. Wavefront also gives us the native integrations with other AWS services in our stack. This allows us to do resource monitoring and capacity planning for all AWS services in a single dashboard.
We often get asked, “Why Wavefront?”
We had three requirements for a monitoring system. It should:
Be enterprise identity ready – that is, it should be integrated with our identity system and allow for SSO
Be a managed service
Give us meaningful information out of the box – that is, it should have pre-created dashboards that meet 80% of our requirements
Wavefront checks all these boxes – we couldn’t be more pleased with the service.
For the K8S stack, Wavefront comes with predefined dashboards that make our jobs extremely simple. We already had Istio Service Mesh taking care of collecting data and running a Prometheus service out of the box. We implemented dynamic integration with Prometheus using the Prometheus storage adapter and in less than an hour we had our cluster observability setup for all K8S levels down to the container.
Now, we can get metrics from all Kubernetes layers, including clusters, nodes, pods and containers; as well as system metrics which we use for our Horizontal Pod Autoscaler (HPA) using Wavefront HPA adapter.
To monitor the app layer, we started with centralized logging, however a number of issues emerged:
Logging is reactive – Logs are normally used as investigative tools. Let’s say we have a user permission check that spans multiple microservices. In a log search, you’ll have to create something equivalent of multiple joins in an SQL DB to construct the right query to find the right log entry traced through all the relevant microservices.
Log persistence depth can vary – Normally in an enterprise, a customer reports an error, support creates a Support Request (SR), which is triaged by various teams before it reaches the engineering team. If that length of time is higher than your depth of log persistence it will become hard to debug the problem, resulting in lowered customer satisfaction. Increasing the depth of log persistence becomes expensive so we need a lightweight separate system to log customer exceptions and errors.
Logging is not exceptions tracing – Traditionally, logs are multiple-level informational, warning, debug or error logs. One can configure the logger to log exceptions – which can be a failure or a bug, but the single line logging entries are not enough to debug an issue across disjointed microservices. In addition, logging is ineffective when it comes to the deduplication of exceptions.
Sentry slashes our time to resolution
Given these challenges, we realized the need for a tool that meets the same requirements we had for Wavefront. In addition, we needed a tool that:
Has a real time alerting mechanism that can be easily integrated into our workflow, such as Slack or Jira
Can de-duplicate and group exceptions
Gives complete meta-data of all exceptions including stack trace
Like Wavefront, Sentry was the only error monitoring platform that met all the above requirements and more. Sentry allowed us to respond to bugs and exceptions as they happened in our application stack from a click in the client browser all the way down to the database.
Recently, Sentry notified our engineering team via Slack that Firefox version 68 threw a certificate error for API gateway to a customer who was trying to access Cloud Marketplace. Without Sentry, we wouldn’t have known about the certificate issue until a customer filed a support ticket. Routing that ticket to the right team would have taken weeks. Not to mention, Firefox 68 was so new that our own Browerstack testing had not been updated to accommodate that version. Because Sentry sent us all the context about the issue including the stack trace, we were able to get an intermediate certificate from IT and push fixes to production in a matter of hours – before it became a widespread problem.
The example above shows why we consider Sentry to be a mission-critical service. It helps us reduce our time to resolution from weeks to hours and, more importantly, deliver a quality customer experience.
Sentry also helps us get ahead of issues before they hit production. Before a production release, we deploy a canary release. The idea is similar to that of a canary in the coal mine – before we make the latest version generally available to 100% of our users, we will update one of the many pods of the updated microservice to the new version and use Sentry to make sure the canaries don’t stop singing.
Using Istio virtual router, we will route all vmware.com domain accesses to new code, while external customers are still accessing old code. Suddenly all internal users, field and partners with VMware accounts become our expanded testing team – which, coupled with Sentry real time alert notifications, allows us to quickly diagnose, fix and push fixes to production, without affecting a single customer. This practice has significantly reduced the number of issues our customers face in production.
In conclusion
In this era of CI/CD software engineering, which sees frequent pushes to production, it’s impossible to fully test the long tail of app changes for each iteration. It’s so much easier to build an observable system and a team culture of quickly reacting to observability alerts. For our collection of microservices, the combination of VMware Tanzu Observability and Sentry enables us to do just that.
Resources
Visit VMware Cloud Marketplace to browse the catalog or learn more here
Contact VMware for any further questions
Visit Tanzu Observability to learn more about Wavefront


