We use GitHub workflows to make sure our products match our expected quality standards, and by using Sentry Tracing we improved CI run time by 71%. Here’s how you can too:
Your workflows are slowing you down
Writing code and delivering new features is now faster than ever, especially when agents do the work. On the other hand, the build and verification processes become the new bottlenecks of engineering.
While the exact setup varies for each developer and project, a standard setup is automated testing in Continuous Integration (CI) pipelines, such as GitHub Actions. With the demand for quality assurance increasing, and feedback cycles taking longer because of slow or failed CI checks, the speed of delivering features slows down.
So you start to investigate what exactly is slowing you down.
GitHub provides insights into how long your jobs and workflows take in total, but it only surfaces combined run information at any given time, or a sum of all your run minutes. While this is helpful, it does not tell the full story when e.g. the same job takes 9 minutes on one run and 15 minutes on another. Besides that, you also have to actively monitor your run times to make sure they are stable (no flaky tests), and do not increase constantly until all your efforts are wasted.
So (if you have the bandwidth) you start to compare multiple runs, structure the data, extract trends manually, and see yourself become a data scientist instead of just delivering the features you initially wanted to.
Sentry’s distributed tracing can do that work for us: it treats a CI run like any other API request.
Investigating CI using Sentry Tracing
Each workflow consists of multiple jobs, with each job being a series of sequential steps, each with a different time duration. Using the model behind tracing, these steps can be represented as spans, with full workflows being shown as entire traces, leveraging many features of Sentry such as Explore and custom dashboards.
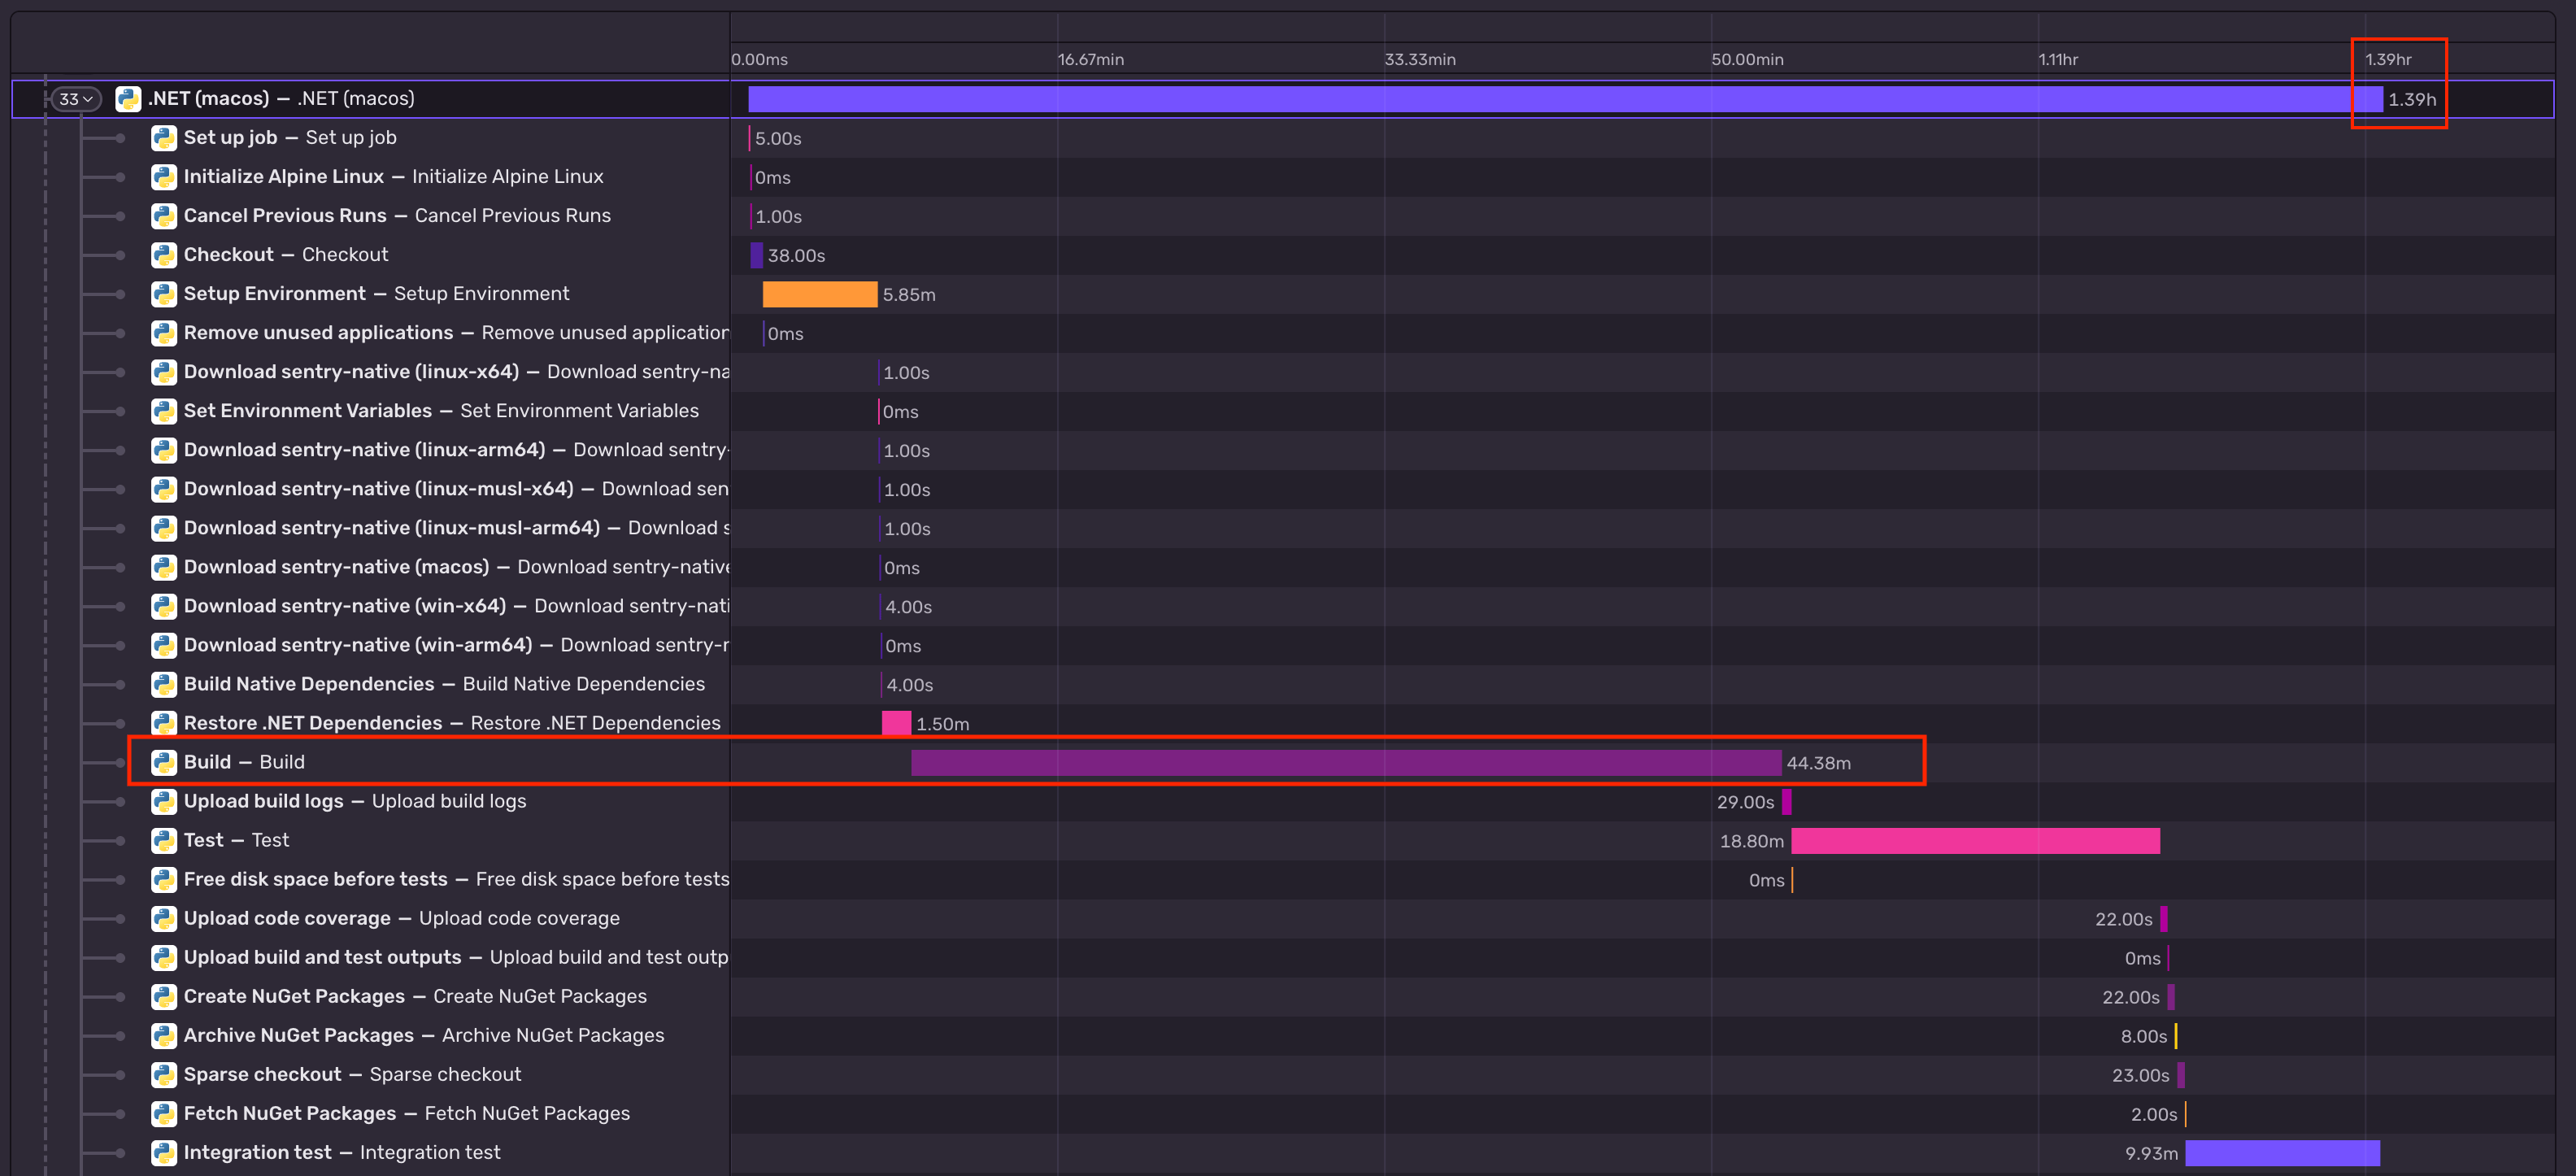
The following screenshot is an example trace of the .NET (macos) job in the build workflow of the Sentry .NET SDK. By opening it up in the trace explorer we can see that the step Build is the longest contributor with ~44 min of the overall ~1 h 23 min.
While the actual efforts that can improve workflow duration depend on your type of project and setup, in our case we were able to implement general improvement strategies such as proper caching strategies across runs and parallelizing tests.
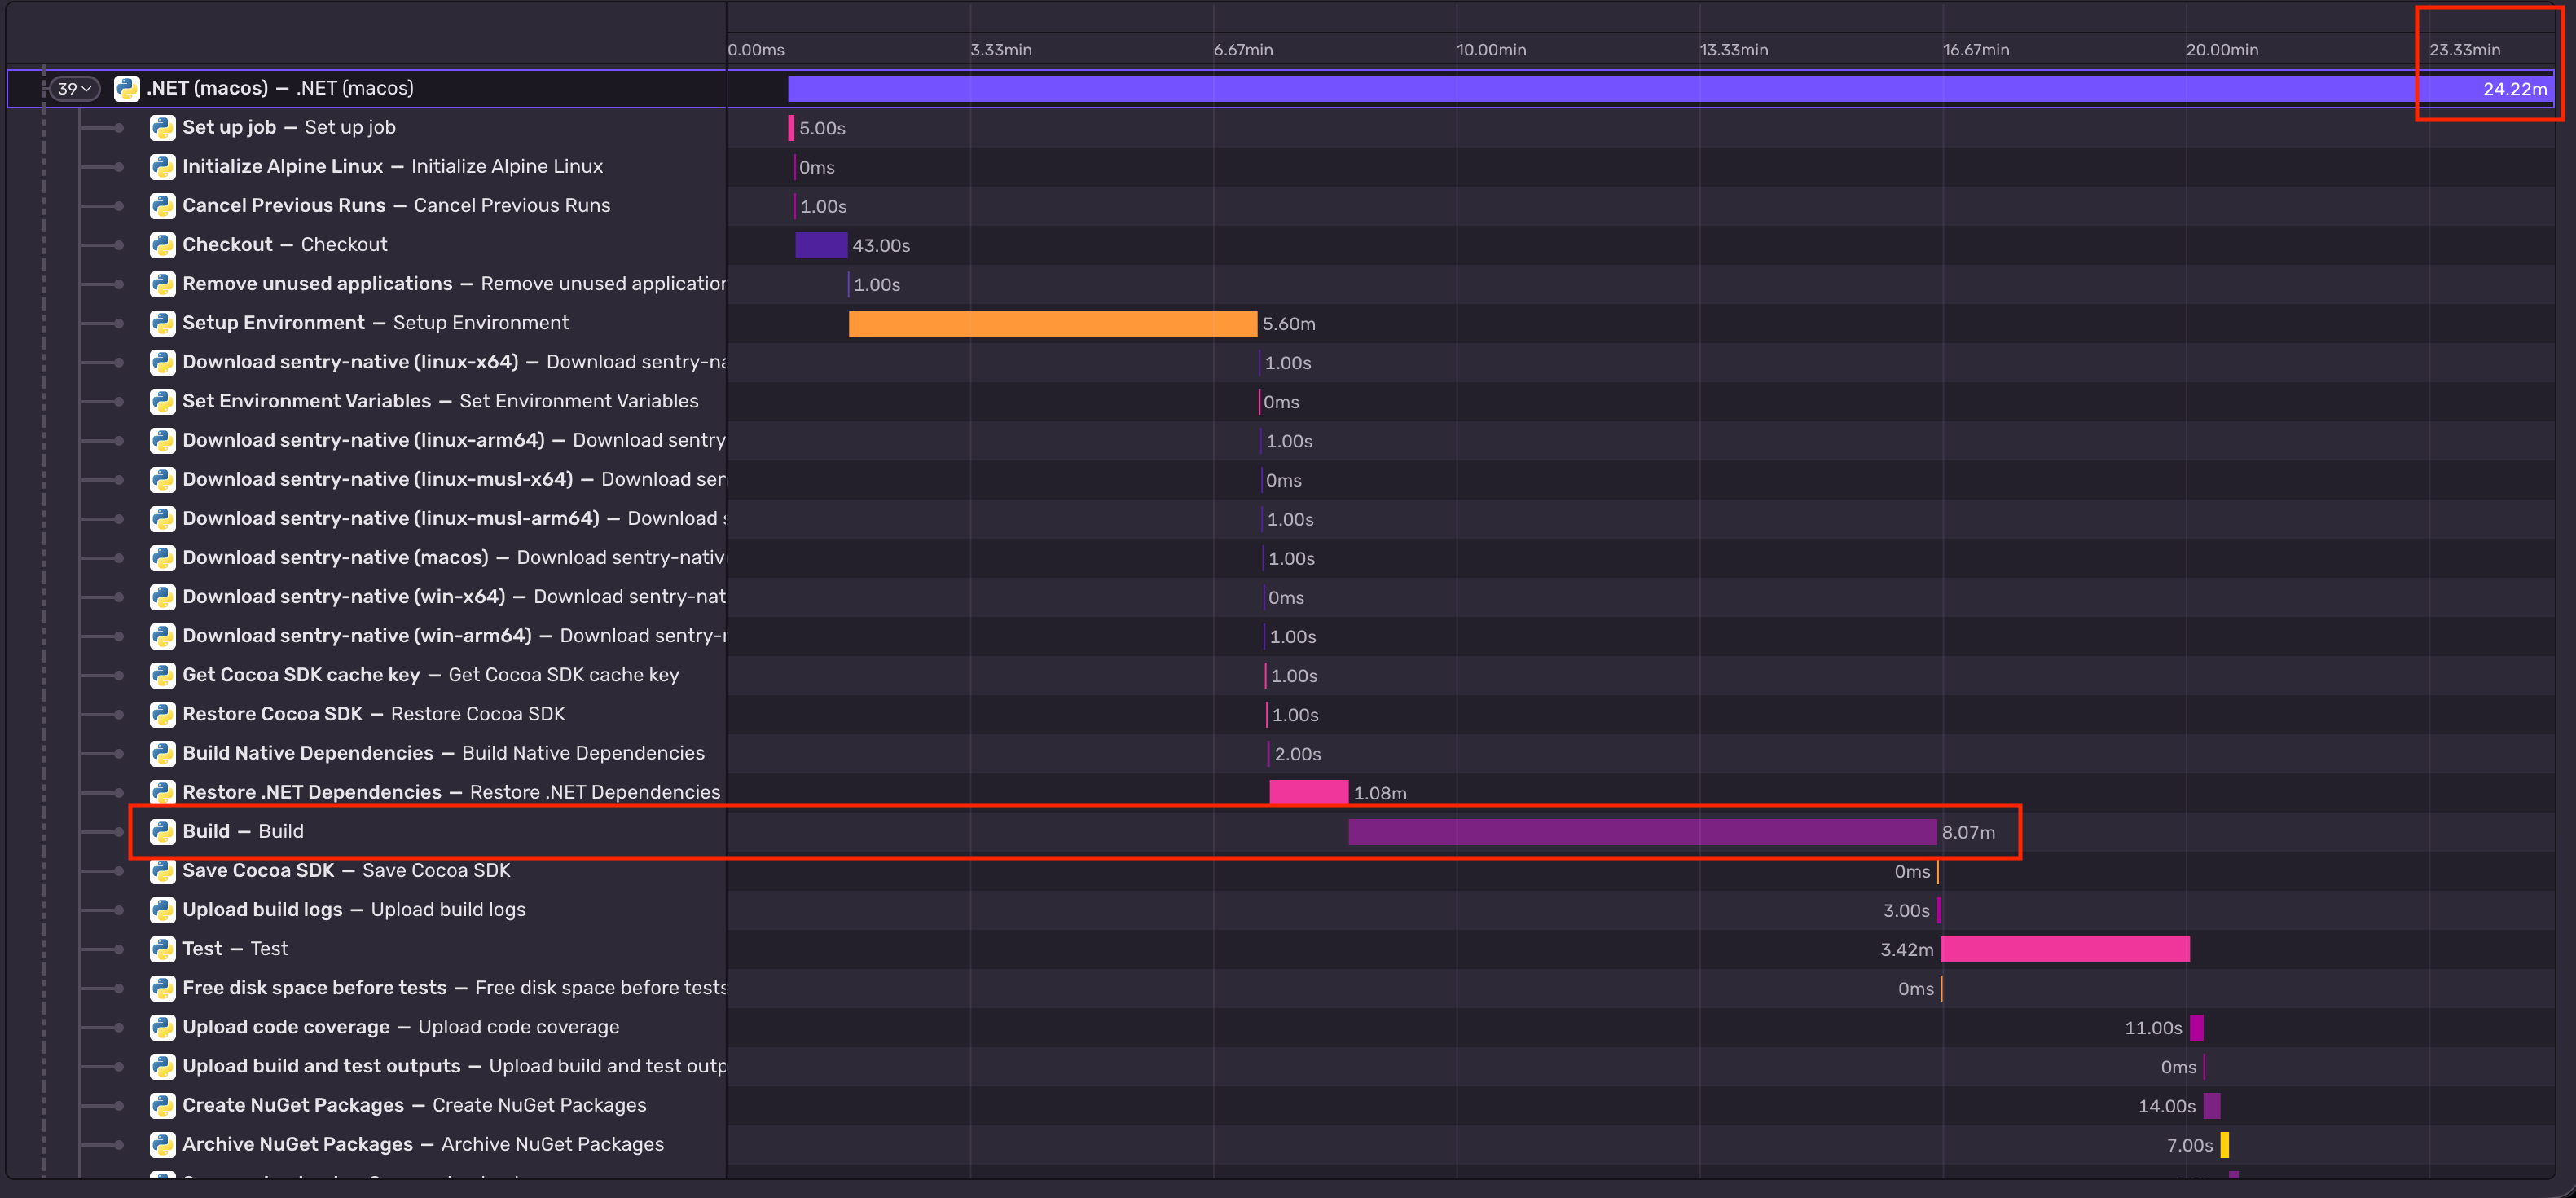
Bringing it all together we can now open up another trace of the same workflow and see that the Build span is now down to only ~8 minutes, with an overall time of only ~24 min.
That makes this job about 3.4x faster, a 71% cut in duration.
Gaining visibility using custom dashboards
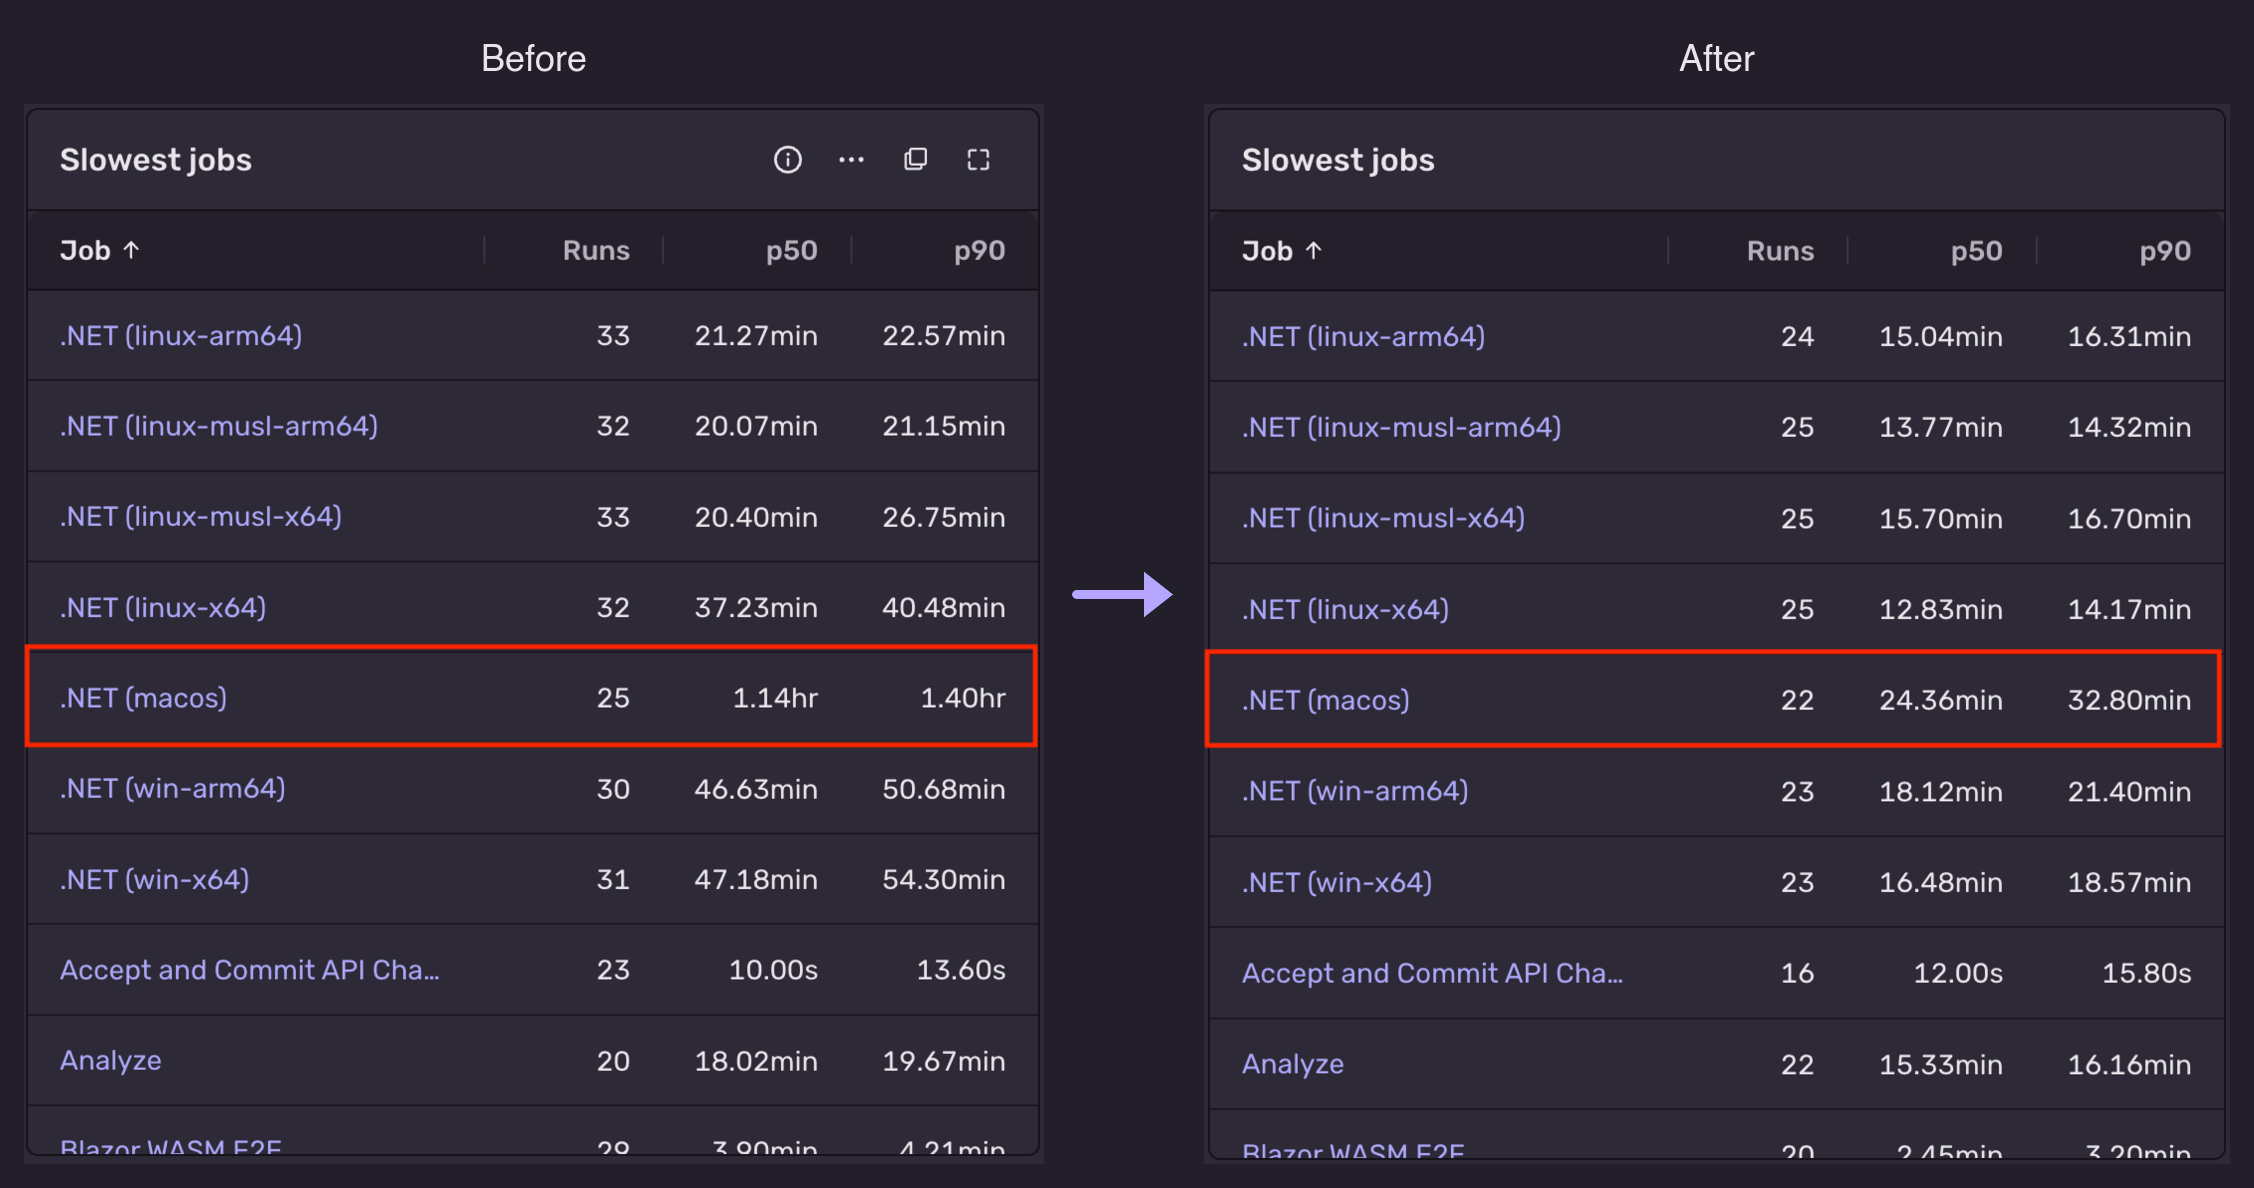
Using a custom dashboard we can now use the collected individual traces and compare the data across multiple jobs, allowing us to easily see p50 and p90 distributions over time, making sure we are not comparing outliers.
This shows us that efforts can really pay off as we are now able to say that we reduced the time of workflow runs by about 64%, allowing us to focus time on the right places.
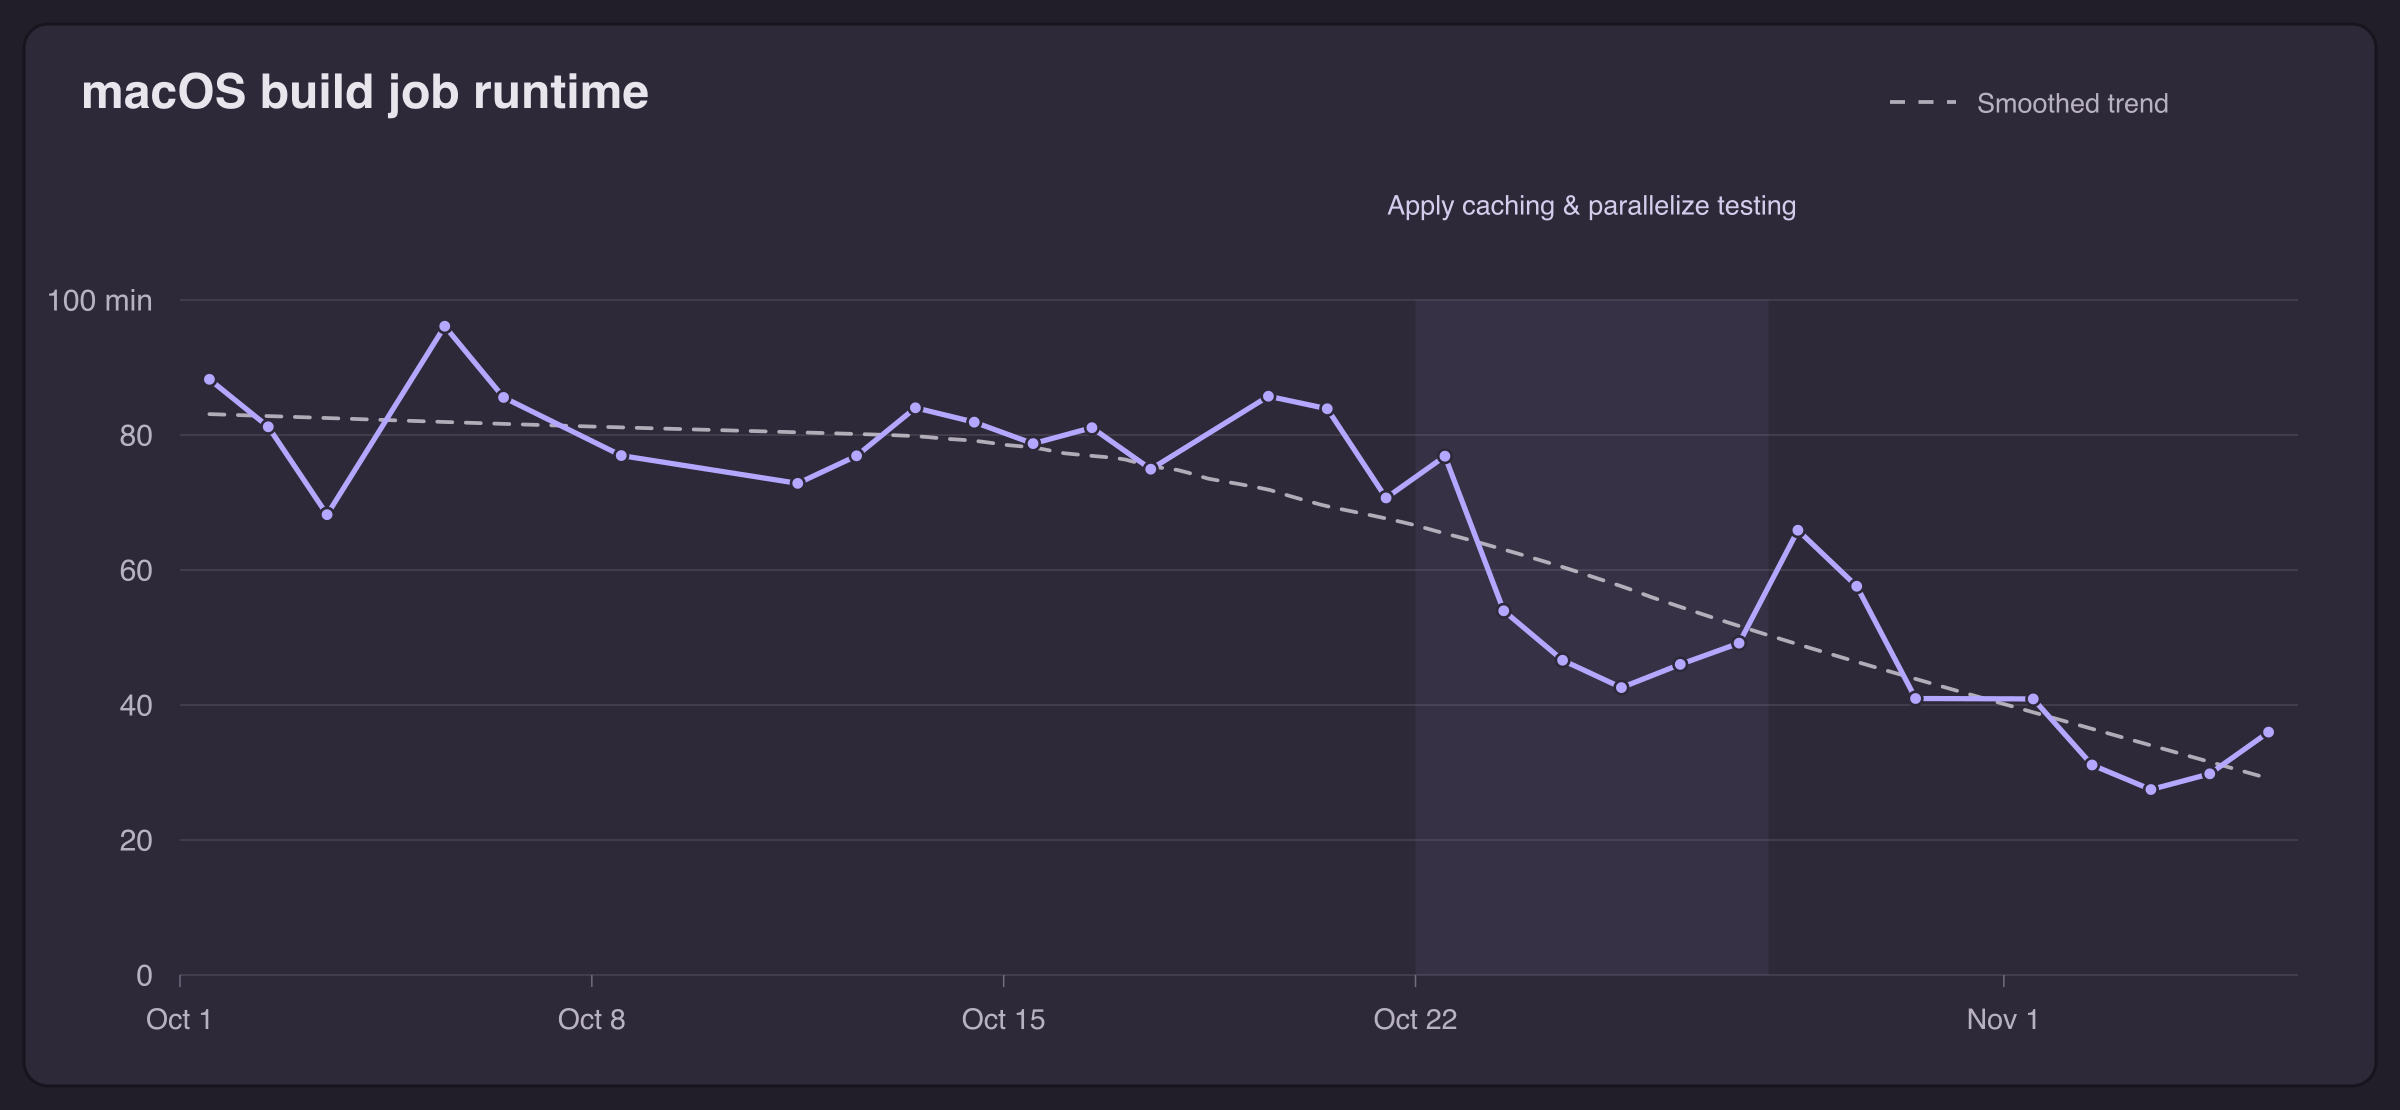
Together with the new Sentry CLI we can go another step further and even access the raw data and use it to generate graphs making the gains even more accessible. Bringing it all together we can clearly see the downwards trend as expected:
The best part: you can use it too!
Collecting traces for GitHub Actions workflows is almost effortless. To get started all you need to do is follow these steps:
Create a new project in Sentry, e.g. ci-telemetry or github-actions-ci-data. No worries about picking a platform or alerts for now, as it doesn’t matter for this use case.
Next, create a private repository named .sentry in the GitHub organization or user account that owns the repositories you want to monitor. Each owner needs its own .sentry repository.
In the new repository commit a file called sentry_config.ini and configure the DSN to the project you created earlier:
Finally, install our GitHub App and make sure it can access .sentry and all the workflows you want to monitor in Sentry. Note: our GitHub App can’t read your code. It asks for read access to Actions, repository metadata and the single sentry_config.ini file. When a workflow job completes, the app looks up the run’s branch, commit and commit author (whose name and email become the event’s user), reads your DSN from .sentry, and sends the job to your Sentry project. Feel free to check out the code in the sentry-github-actions-app repository.
That’s it! One project, one repo, one commit and one app installation and you will start to receive GitHub workflow jobs as Sentry traces*.
* Keep in mind that the ingested traces count toward your span quota (or your transaction quota on older plans).
Next steps for us at Sentry
The GitHub app to collect GitHub Actions workflow telemetry in Sentry should be considered experimental, but now it’s your time to shine!
Try it out and let us know what works for you, what can be improved, and what you want to see next. The easiest way to make your voice heard is upvoting and commenting on issues in the sentry-github-actions-app repo on GitHub.
Let's stop debating it and just lean in: you can have both. Sentry is now shipping a unified CLI and MCP experience for agents with access to sandboxes.
An environment variable that was never expanded turned a single release into a 44-million-row database liability, sending symbolication CPU to 76%. Here's how we investigated and fixed it.
A coding agent with access to our own traces through the Sentry MCP found small backend fixes that together removed hundreds of millions of queries a week.