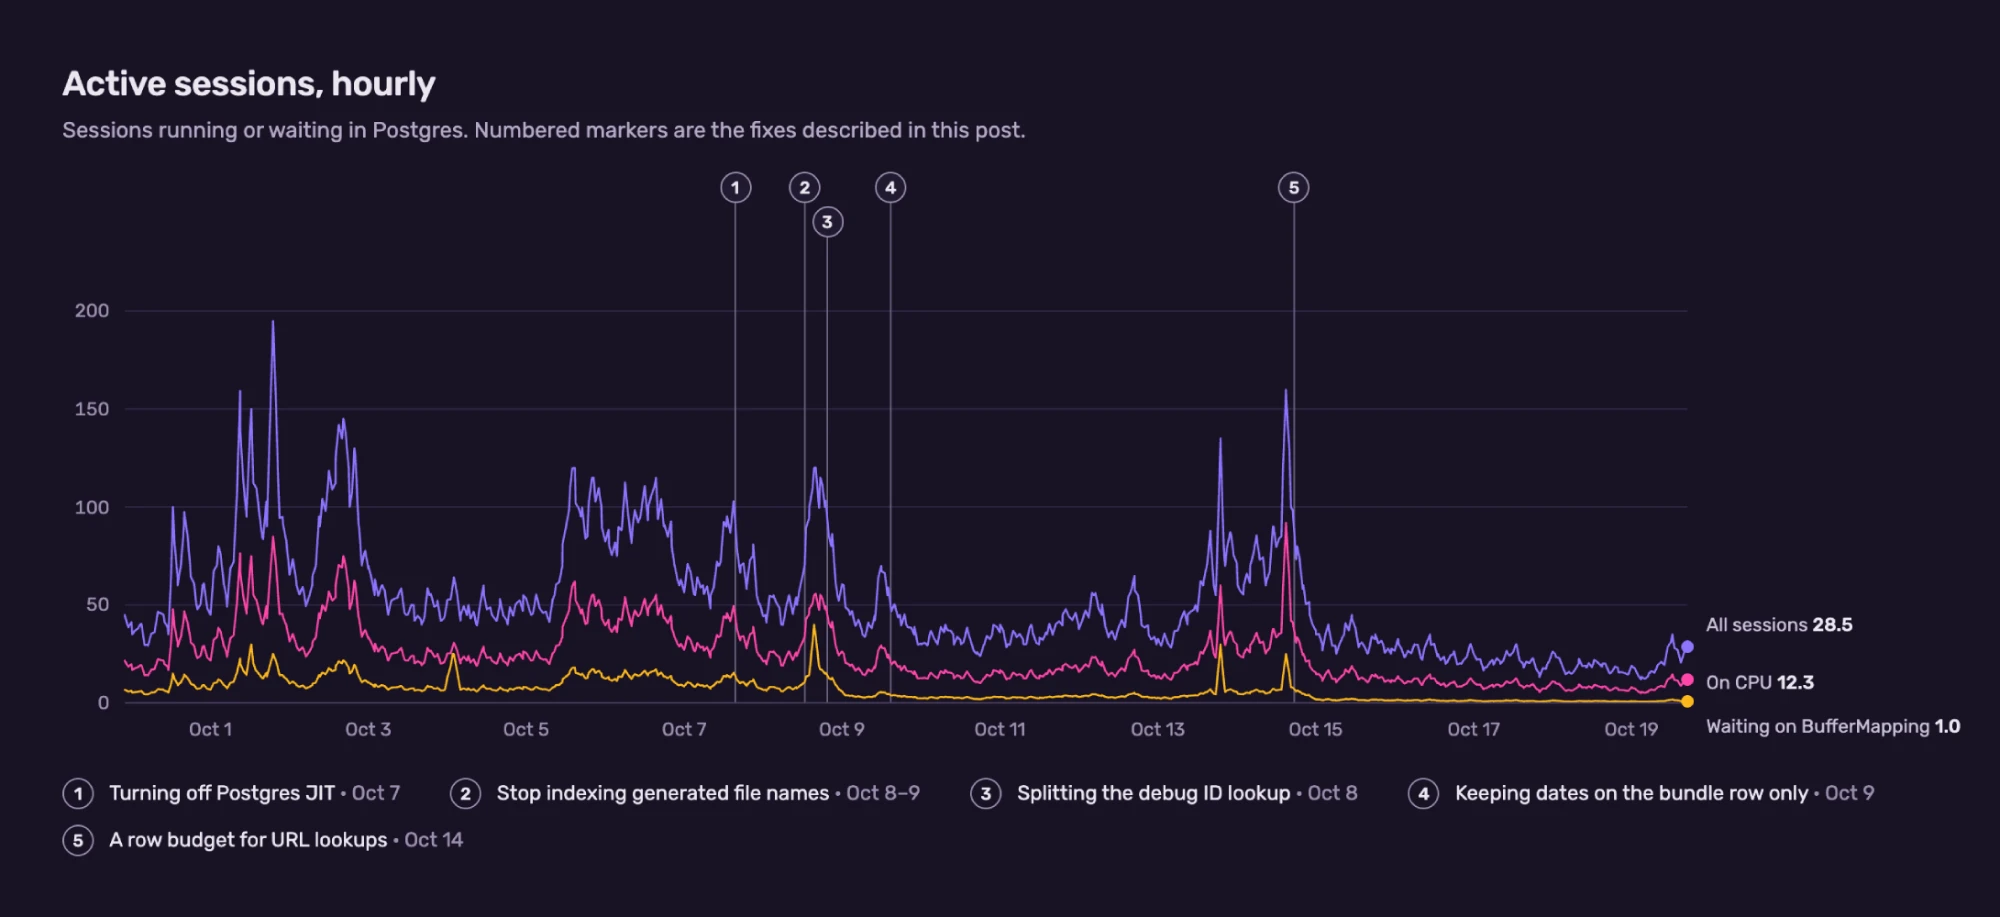
TL;DR: A few releases with broken names had piled up tens of millions of rows, and one unbounded lookup kept trying to scan all of them. Capping how much work a single lookup can do cut database CPU from 76% to 19% and symbolication timeouts by 98%. Bigger hardware hadn’t managed either.
How Sentry finds your source maps
When a JavaScript error reaches Sentry, the stack trace points at minified code. Sentry finds the source map that was uploaded for that build to be able to show you the original file and line.
Source maps are uploaded in artifact bundles. There are two ways to find the right one:
By debug ID. Modern build tooling stamps each file with a unique ID, so the lookup is exact.
By release and URL. Older setups match on the release name plus the file’s URL. We keep a URL index to make that fast, one row for every file in every bundle.
Symbolicator, our open-source symbolication service, does the lookup when it processes an event. Bundles that are still in use get their “last used” date renewed, and bundles nobody has used for about 90 days are cleaned up.
All of this lives in a Postgres 14 database dedicated to files. The URL index is by far its biggest table.
The problematic database
This database has been a problem for a while. Load and storage kept growing, and every once in a while someone got paged about it. In early October it caused an incident where symbolication latency spiked for customers in our US region, the latest in a long line of problems with this database.
We’d already tried the usual database fixes: bigger instances and more indexes. But load and storage kept growing anyway, and the extra indexes made storage worse, since every index is more data to write, keep, and clean up. That’s why I decided to go straight to the source and look at how Sentry itself stores and queries this data.
Investigating the issues
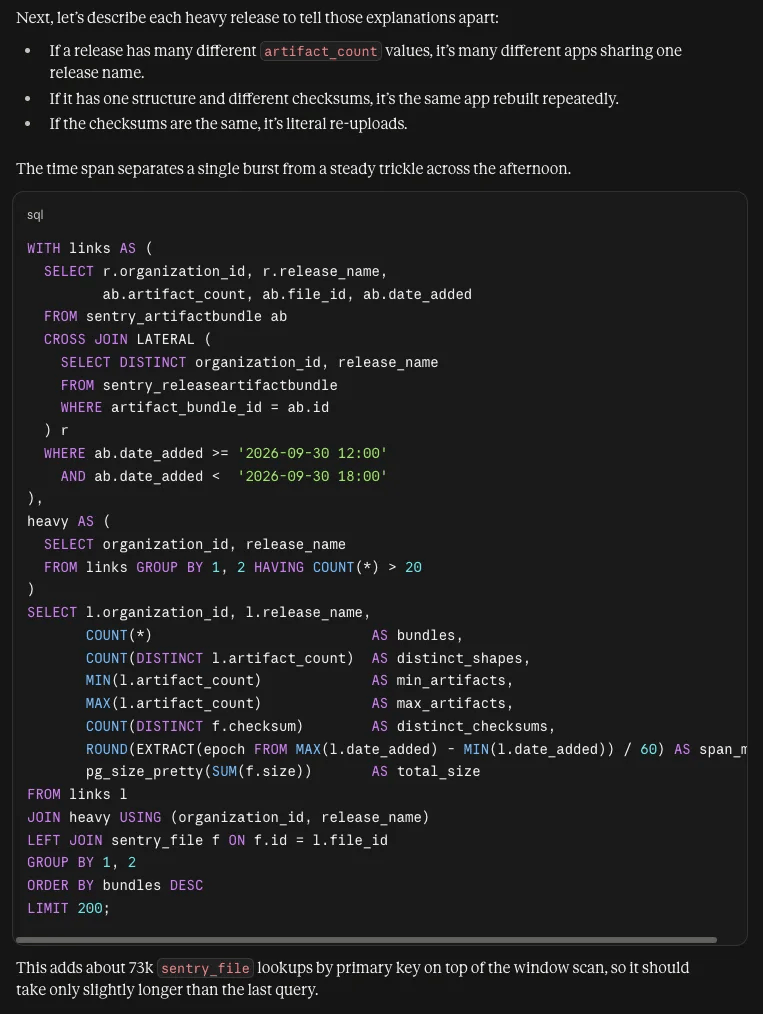
I’m not an expert in these systems, so I paired with Claude to investigate. It read the code, suggested queries and kept track of what we’d learned, while I ran everything myself against read replicas. I then reviewed the findings with engineers who were more familiar with these systems. I started with a simple prompt: help me investigate the layout of the artifact bundles in this database and find the releases with the most artifacts. A few hours of back-and-forth later, things were starting to make more sense.
A few things made that work well:
One query at a time. The model proposed a single query, I ran it and pasted the result back, and the next step depended on what came back. That was slower than asking for a plan up front, but every step was grounded in real data rather than guesses.
Keep a running record. A dedicated doc with timelines, findings, and dead ends gave colleagues (and agents) somewhere to track the progress.
Guardrails stay with the human. No direct database access for the model. Heavy reads ran against our read replicas.
Ask for sources. Every timestamp and number had to point back to a graph, a query result or a pull request. That caught several mistakes before they spread.
We had found some suspicious releases causing an outsized share of the load. The worst of them, which a teammate had already found and blocked from lookups after it kept showing up in our query-killer logs, was named, literally, VERCEL_GIT_COMMIT_SHA. I was having a hard time building a mental model of how things were fitting together, so I asked Claude to build some visualization to help me out.
VERCEL_GIT_COMMIT_SHABlocked from lookups
A never-expanded environment variable put every Vercel build in one release, under generated file names that a URL lookup can never match.
Bundles
0
of 13,595
Files per bundle
3,226
average
URL index rows
0M
100% generated names
Index disk
0.0 GB
estimated
Active, last 14 days
0
0% of bundles
Rows per renewal
6,132
bundle, links, index
Day 0(May 14, 2026)
Uploads
URL-indexed
Cleanup due
One square is 10 bundles, oldest at the top left. Stripes mark generated names.
Not uploaded yet
Indexed, idle
Idle 90+ days: cleanup should delete
Uploaded or renewed in last 14 days
Checked by the lookup
Cancelled here at 10 s
Somewhere in a customer’s build config, an environment variable was referenced but never expanded. So instead of each deploy getting its own release named after its commit, every build landed in the same release, forever. Even worse, the bundled files used generated names, so URL lookups could never match them anyway.
Note: This isn’t a bug in Vercel or in our Vercel integration. The string comes from the project’s own build configuration. It can happen with any CI provider’s variables. We saw the same pattern with release names like undefined.
More than 200 organizations had a release with this exact name. The worst one had:
13,595 bundles (2,039 active)
3,226 files per bundle
44 million URL index rows with all generated file names
13 GB of disk for that index alone
More than 6,000 rows rewritten every time a bundle was renewed
A single URL lookup against that release took 7.4 minutes uncached and 53 seconds with everything already in memory. We normally cancel queries that run longer than 30 seconds and had lowered that to 10 seconds during the incident, so this query could never finish. Then Symbolicator would retry it two more times.
After enough digging, we’d also turned up a pile of smaller issues, like odd queries and unused indexes. At that point I went from investigating to fixing.
Fixing the issues
These are the changes that mattered most, in order of impact.
A row budget for URL lookups (October 14)
We capped a single URL lookup at scanning 1,000,000 URL index rows. Lookups on huge releases now stop early instead of running until they’re killed and retried. The miss gets cached, avoiding doing the work again.
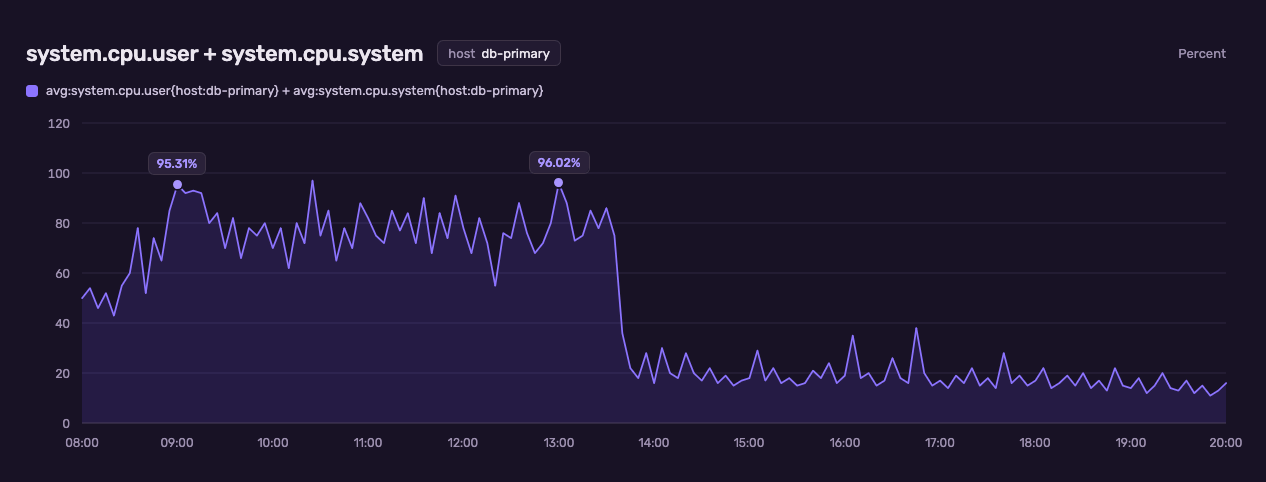
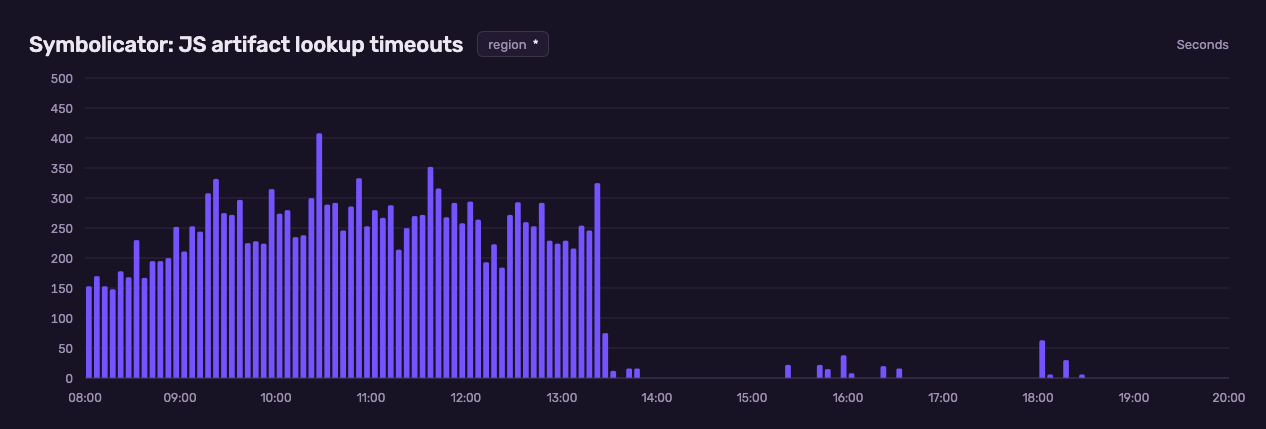
Since the fix about 0.5% of URL lookups hit the cap. Those few lookups were driving roughly three-quarters of the CPU on our primary database hosts. Once the budget went live, CPU usage dropped from 76% to 19% on our busiest host. Symbolicator timeouts to Sentry went from constantly happening to sporadic.
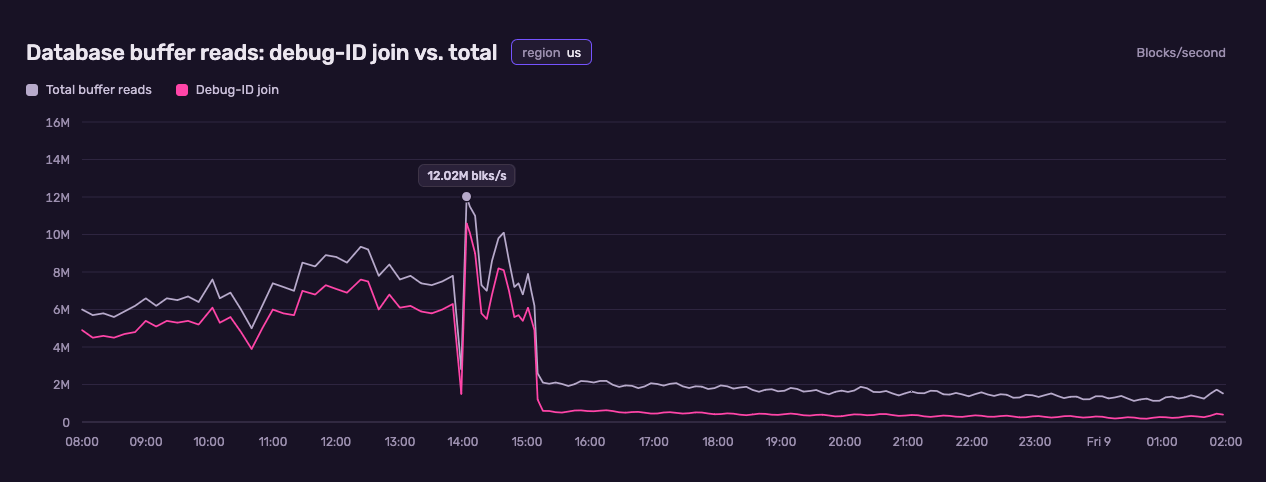
Splitting the debug ID lookup (October 8)
One of our joins across the bundle, project, release, and debug ID tables got much heavier after the query plan shifted. We replaced it with three single-table queries that start from the debug ID. That prevents the planner from picking a bad plan.
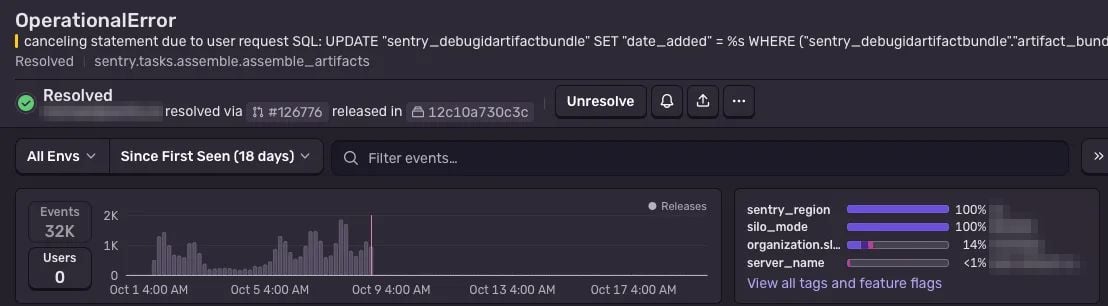
Keeping dates on the bundle row only (October 9)
Re-uploading an existing bundle used to rewrite the date on every one of its debug ID and URL index rows. Running that update was slow enough that the query timeout could cancel it. The whole upload then failed along with it. Now only the bundle row’s date changes, and if that update gets cancelled, the upload still goes through.
Before the fix, uploads hit this error about 32,000 times in 18 days. Since then, none. The tables now collect 110 to 210 million fewer dead rows a day.
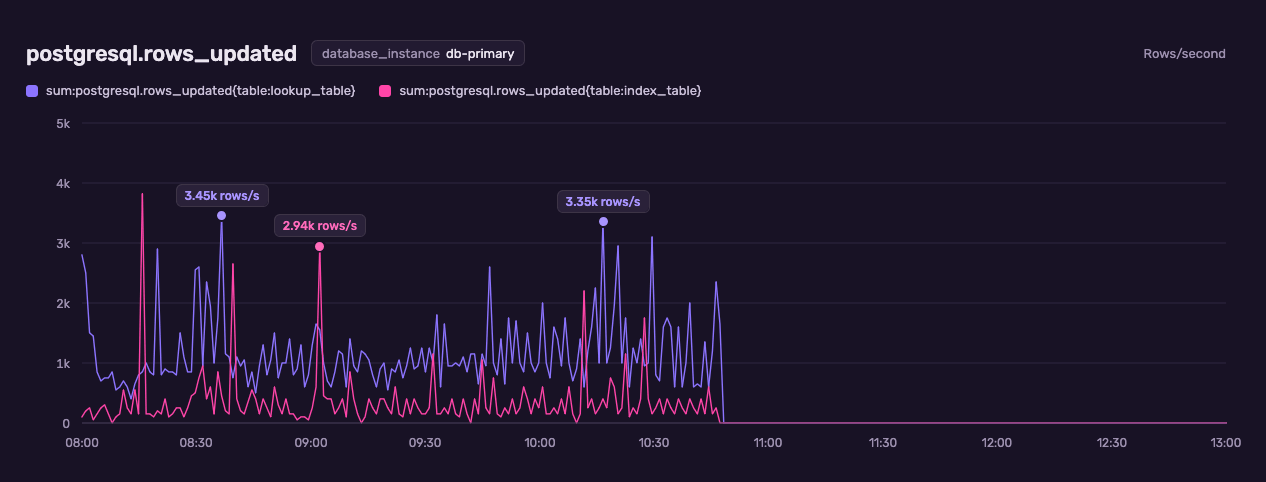
Stop indexing generated file names (October 8–9)
Files named after their own debug ID can never match a URL lookup, but we were writing them into the URL index anyway. They made up about a third of all its rows, so we stopped writing them. URL index inserts dropped by about 35% in both regions, roughly 170 million fewer rows a day in the US alone.
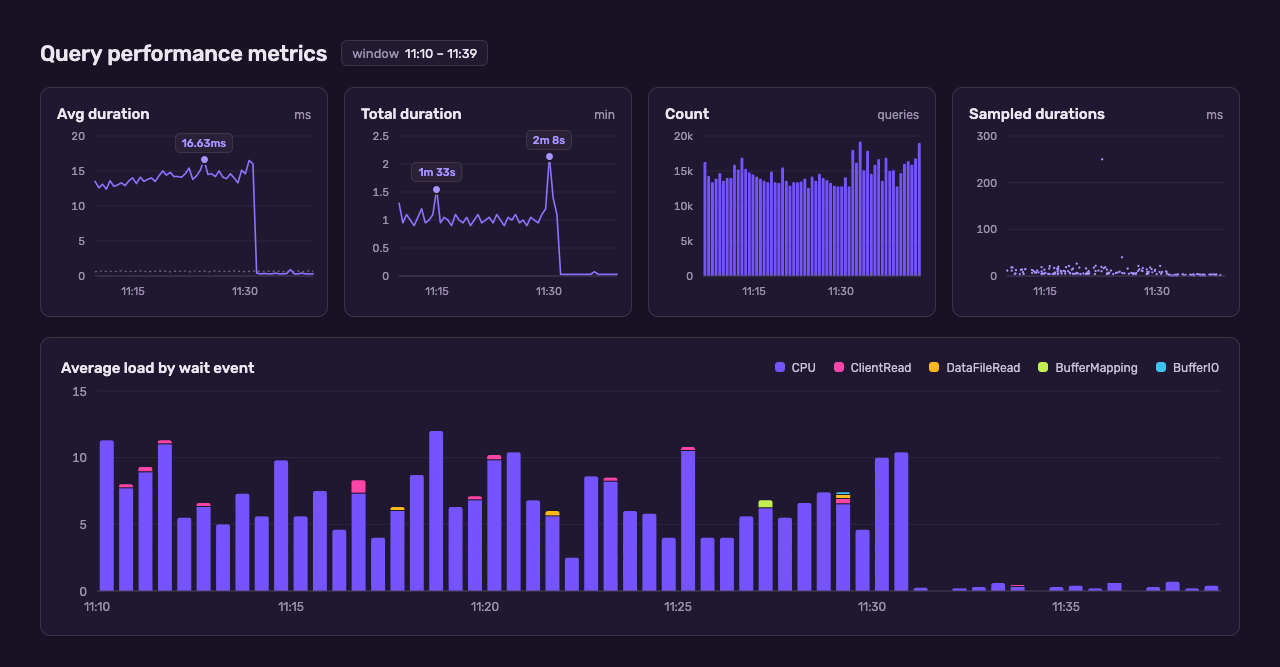
Turning off Postgres JIT (October 7)
Postgres can compile expensive queries to machine code right before running them. That’s called just-in-time (JIT) compilation. It does this by default for any query with an estimated cost above 100,000. For one of our legacy release file lookups, compiling took longer than it saved every single time.
JIT is now off permanently in our database configuration: latency per call fell from 14.5 ms to 0.12 ms, and busy database sessions from about 7.5 to 0.06.
Results
Weekday-morning load on our busiest database host fell from 104 active sessions to 24 (−77%), while serving 10% more queries. Symbolicator lookups that timed out per hour fell from 3,250 to 80 (−98%).
Lessons
Customer data can have an outsized effect on system load. Our tables were designed around releases with a reasonable number of builds. A few releases with broken names built up a huge amount of data. We had an unbounded query that tried to scan all of it.
Don’t retry things that can never succeed. Postgres would happily run these queries, our timeout would happily kill them, and Symbolicator would happily retry them, multiplying the load.
Limits are good. Bounding the work per request fixed what extra capacity couldn’t. The releases that hit the cap were already failing on timeouts, so they don’t lose anything.
Check your own release names
If you deploy a continuous integration (CI) system that sets your release from an environment variable, it’s worth a quick look.
Open Releases in Sentry and look at the names (or just ask your agent to do it with the Sentry MCP)
If you see a release named after a variable (like VERCEL_GIT_COMMIT_SHA), or undefined, your build is passing the variable’s name or an empty value instead of the commit.
Make sure the variable is set and expanded in your build before it’s passed to Sentry. Your source maps will match more often, and our database will thank you.
A coding agent with access to our own traces through the Sentry MCP found small backend fixes that together removed hundreds of millions of queries a week.
Starting with Sentry Android SDK 8.51.0, profiling on Android 15+ devices is powered by Perfetto through Android's ProfilingManager API, with no configuration changes needed.
Most of a session happens after the page users landed on. With soft navigation web vitals in SDK v11, every page they visit gets its own LCP, CLS, and INP.